Following graph shows the income of a company in six different years. Study the graph , carefully and the questions that follow.
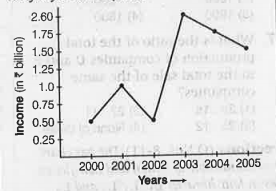
Find the percentage decrease in income from 2001 to 2002.
0.5
0.33
0.25
Data insufficient
Step by step video & image solution for Following graph shows the income of a company in six different years. Study the graph , carefully and the questions that follow. Find the percentage decrease in income from 2001 to 2002. by Maths experts to help you in doubts & scoring excellent marks in Class 14 exams.
Updated on:21/07/2023Similar Questions
Following graph shows the income of a company in six different years. Study the graph , carefully and answer the questions that follow.
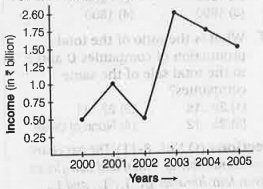
In which year income of the company is the highest?
View SolutionFollowing graph shows the income of a company in six different years. Study the graph , carefully and answer the questions that follow.
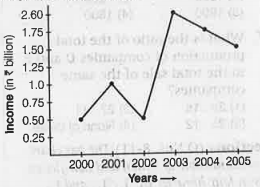
What is the ratio of the income of the company in the years 2000 and 2005 ?
View Solution
Knowledge Check
Study the following graph and answer the questions.
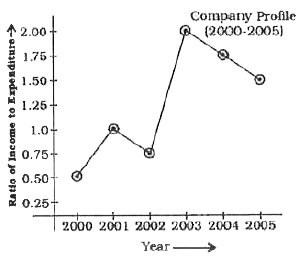
Find the percentage decrease in income from 2001 to 2002.A50%B33%C3712%DData inadequateThe graph shows the production of food grains of a country in different years. Study the graph and answer the questions.
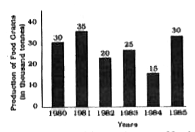
The percentage increase in production from 1984 to 1985 wasA15B30C50D100Study the following graph carefully and answer the questions that
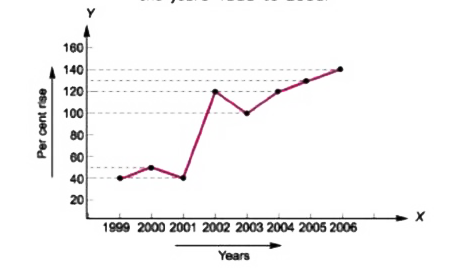
For how many years , the percent rise was more than 100 % ?AOneBTwoCThreeDNone of these
In the given bar graph , the white bar shows the income and the black bar shows the expenditure of company (in Rs. Lakhs) . Study the graph and answer the question that follows .
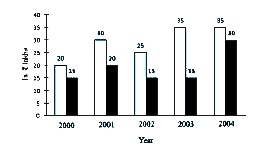
The percentage decrease in the income of the company in 2002 as compared to that in 2001 is :
View SolutionFollowing bar graph shown the income and expenditure ( in Rs. lakhs) of a ceremony. Read the graph carefully and answer the questions.
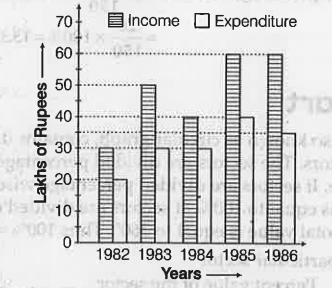
What is the average income of the company are the years?
View SolutionThe following graph shows the production of wheat flour (in 1000 tonnes) by three companies X, Y and Z over the years. Study the graph and answer the questions.
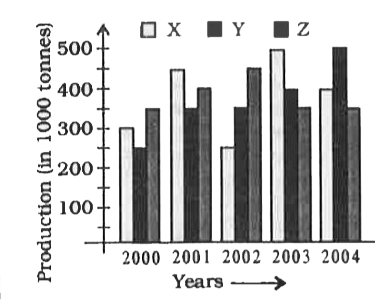
What is the percentage Increase in the production of company Y from 2002 to 2003?
View SolutionThe following graph given the annual percent profit earned by a comppany during the period 1996-2001. Study the graph carefully and answer the questions that follow.
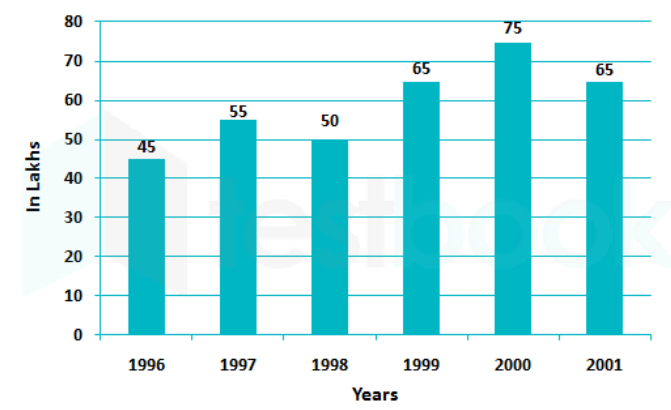
The perofit earned by the company is maximum is the year :
View SolutionThe following graph given the annual percent profit earned by a company during the period 1996-2001 . Study the graph carefully and answer the questions that follow
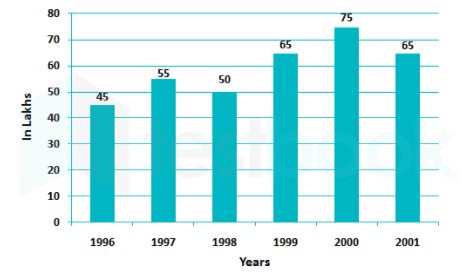
The period in which the profit of the company has increased fasted is:
View Solution