Study the following table carefully and answer each of the questions.
Number of types of different tyres sold, by a company over years
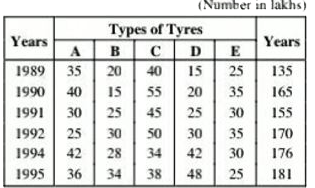
In which of the following years the percentage sale of 'D' type of tyres was maximum as compared total sale of that year?
1992
1994
1990
1995
The correct Answer is:D
Step by step video & image solution for Study the following table carefully and answer each of the questions. Number of types of different tyres sold, by a company over years In which of the following years the percentage sale of 'D' type of tyres was maximum as compared total sale of that year? by Maths experts to help you in doubts & scoring excellent marks in Class 14 exams.
Updated on:21/07/2023Topper's Solved these Questions
Similar Questions
Study the following graph carefully and answer the question given below.
The graph gives the three types of mobile phones manufactured by a company over the years.
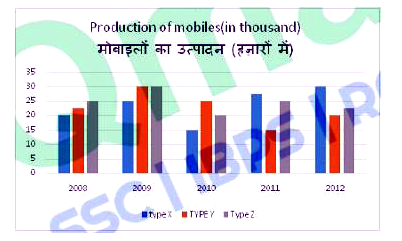
In which of the following years, the percentage production of type Y to Z type mobile phones is the maximum ?
View SolutionRead the following table carefully and answer the questions given below:
Number of questions asked in different subjects during different years in an examination of Bank.

In which year the percentage of the questions asked from Reasoning is maximum ?
View Solution
Knowledge Check
Study the following graph carefully and answer the questions given below
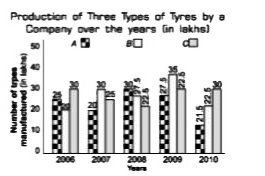
The total number of all the three types of tyres manufactured was the least in which of the following years?A2009B2010C2006D2008Study the following graph carefully and answer the given questions :-
The following graph shows the % profit of two companies over the years :-
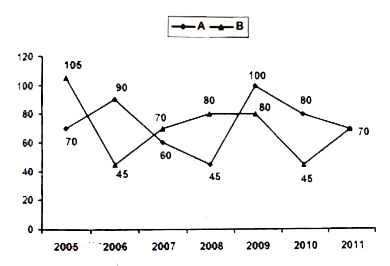
In which of the following years the ratio of expenditure to income was the least for company B?A2006B2009C2008D2005Study the following table carefully and answer the questions given below :
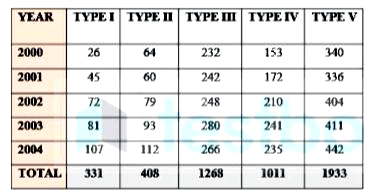
The percentage increase in sales in 2003 over the previous year was maximum for which Type of vehiclesAType IIBType ICType IIIDType V
Study the following graph carefully and answer the given questions :-
The following graph shows the % profit of two companies over the years :-
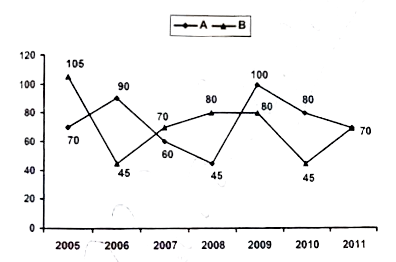
In which of the following years was the total income more than double the total expenditure in that year for company A ?
View SolutionStudy the following graph carefully and answer these questions :-
Expenditure and profit percent of a company in different years
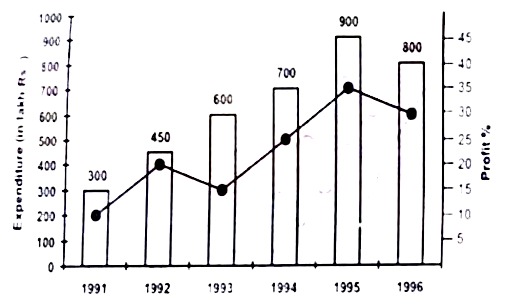
What is the average percentage profit for given years ?
View SolutionStudy the following graph carefully to answer the questions that follows
The % of five different types of cars produced by a company during two years is given below:
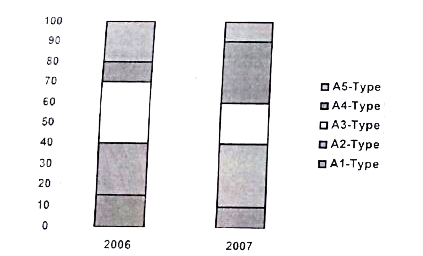
In the case of which of the following types of cars was the % increase from 2006 to 2007 the maximum?
View SolutionStudy the following graph carefully and answer these questions :-
Expenditure and profit percent of a company in different years
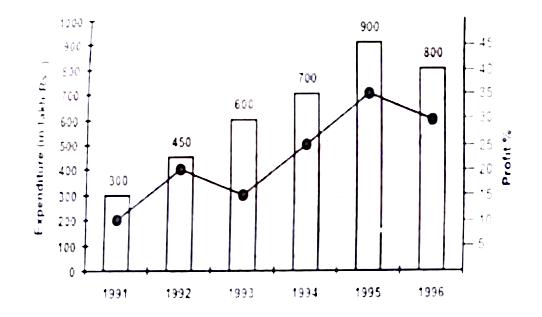
What is the total amount of profit earned in given years ?
View SolutionStudy the following table carefully to answer the questions that follows.
Number of Articles (in thousands) Manufactured (M) and Defective (D) company over the years-
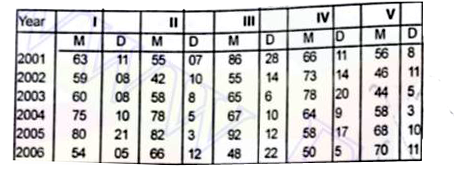
During which year was the percentage increase/decrease in manufacture from the previous year the highest for unit II ?
View Solution
