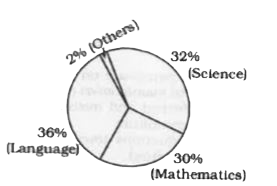
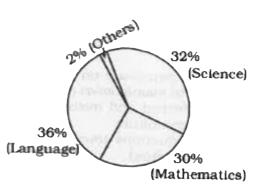
The following pie-chart shows the number of students who failed in different subjects in an examination. Examine the chart and answer the following questions. The total number of students who have failed is 500.

The number of students failed in science is less than the number of students failed in all other subjects by :
170
140
180
160
The correct Answer is:C
Step by step video & image solution for The following pie-chart shows the number of students who failed in different subjects in an examination. Examine the chart and answer the following questions. The total number of students who have failed is 500. The number of students failed in science is less than the number of students failed in all other subjects by : by Maths experts to help you in doubts & scoring excellent marks in Class 14 exams.
Updated on:21/07/2023Topper's Solved these Questions
- STATISTICS AND DATA INTERPRETATIONBOOK - KIRAN PUBLICATIONCHAPTER - STATISTICS AND DATA INTERPRETATIONEXERCISE - TYPE-VIII
8 Videos
- STATISTICS AND DATA INTERPRETATIONBOOK - KIRAN PUBLICATIONCHAPTER - STATISTICS AND DATA INTERPRETATIONEXERCISE - TYPE-VI
86 Videos
- SIMPLIFICATIONBOOK - KIRAN PUBLICATIONCHAPTER - SIMPLIFICATIONEXERCISE - TEST YOURSELF
25 Videos
- TIME AND DISTANCEBOOK - KIRAN PUBLICATIONCHAPTER - TIME AND DISTANCEEXERCISE - Type -XI
74 Videos
Similar Questions
The following piechart shows the number of students who failed in different subjects in an examination. Examine the chart and answer the questions 5 to the total number of students who have failed is 500.

Number of students who failed in Mathema tics is less than the students who did not qualify in language is -
View SolutionThe following pie-chart shows the number of students who failed in different subjects in an examination. Examine the chart and answer the following questions. The total number of students who have failed is 500.

The central angle of the sector for the students who have failed in mathematics is :
View Solution
Knowledge Check
In a class, there are 225 students. Which of the following cannot be the ratio of the number of sutdents passed to the number of students failed?
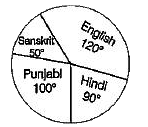
A2:3B7:8C5:4D3:4The Pie-graph given here shows the number of students opting different subjects in a school. If there are a total of 720 students, then by studying the pie-graph answer the questions.

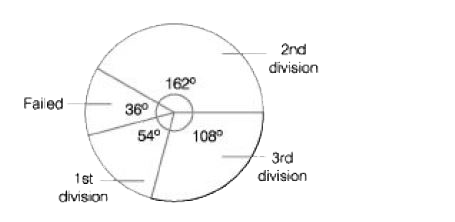
The total number of students studying English and Punjabi subjects areA220B440C110D240The following pie chart shows the performance in an examination in a particular year for 360 students.The total number of students who have passed in 2nd and 3rd division is
 A162B270C108DNone of these
The following piechart shows the number of students who failed in different subjects in an examination. Examine the chart and answer the questions 5 to the total number of students who have failed is 500.

Total number of students who did not qualify in Mathematics or Language or Science, is
View SolutionIn an examination,20% of total number of students failed in History,15% of total number of students failed in Hindi and 5% of total number of students failed in both.Find the percentage of students who passed in both the subjects.
View SolutionFind the error in the given sentence I am sorry for the students who failed in the examination .
View Solution1700 students took an exam 85% students passsed it. Find the number of students who failed in the exam.
View SolutionIn an examination, 19% students fail in Mathematics and 10% students fail in English. If 7% of all students fail in both subjects, then the number of students passed in both subjects is
View Solution
