The given bar graph represents the number of students who appeared in the board examination in session 2017-18 and 2018-19. Study the graph and answer the question that follows.
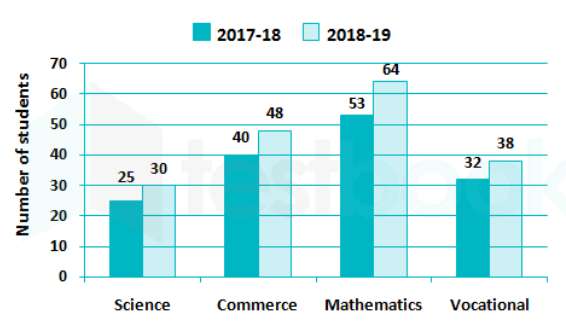
The difference between the average number of students of Science and Mathematics streams in 2017-2018 and that in Commerce and Vocational in 2018-19, is:
8
6
4
2
The correct Answer is:C
Step by step video & image solution for The given bar graph represents the number of students who appeared in the board examination in session 2017-18 and 2018-19. Study the graph and answer the question that follows. The difference between the average number of students of Science and Mathematics streams in 2017-2018 and that in Commerce and Vocational in 2018-19, is: by Maths experts to help you in doubts & scoring excellent marks in Class 14 exams.
Updated on:21/07/2023Similar Questions
The given bar graph represents the number of students who appeared in the board examination in session 2017-18 and 2018-19. Study the graph and answer the question that follows.
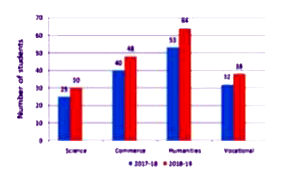
What is the ratio of the total number of students appeared in examination in 2017-18 and 2018-19?
View SolutionThe given bar graph represents the number of students who appeared in the board examination in session 2017-18 and 2018-19. Study the graph and answer the question that follows.
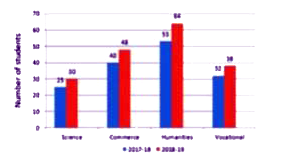
What percentage is the total number of students who appeared in 2017-18 is less than the total number of students who appeared in 2018-19?
View Solution
Knowledge Check
The line graph shows the number of students who passed with distinction in the given years from a certain university. Study the diagram and answer the following questions.
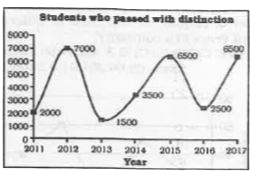
What was the difference between the number of students who passed with distinction between the years 2017 and 2014?A6000B5000C4000D3000Study the following graph carefully and answer the questions that follow
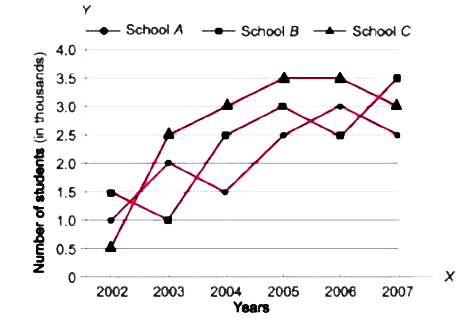
What was the average number of students in all schools together in the year 2006 ?A30000B9000C3000D6000The given bar graph represents the number of boys and girls in five different schools. Study the graph and answer the question that follows
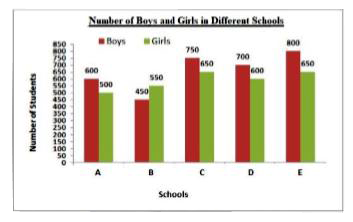
In which school is the percentage of girls the lowest ?AABBCEDC
The given bar graph represents the number of students who appeared in the board examination in session 2017-18 and 2018-19. Study the graph and answer the question that follows. What percentage is the total number of students who appeared in 2017-18 is less than the total number of students who appeared in 2018-19?(correct to one decimal place)
दिया गया दंड आरेख सत्र 2017-18 और 2018-19 सत्र में बोर्ड परीक्षा में उपस्थित होने वाले छात्रों की संख्या को दर्शाता है। आरेख का अध्ययन करें और प्रश्न का उत्तर दें।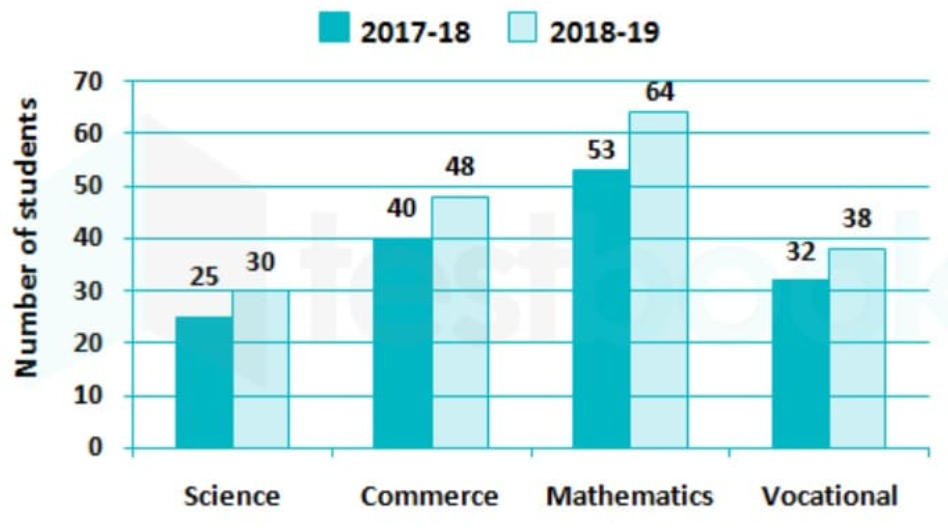
2017-18 में उपस्थित होने वाले छात्रों की कुल संख्या 2018-19 में उपस्थित होने वाले कुल छात्रों (एक दशमलव हा तक) से कितने प्रतिशत कम है?
View SolutionThe given bar graph represents the number of students who appeared in the board examination in session 2017-18 and 2018-19. Study the graph and answer the question that follows. What is the ratio of the total number of students appeared in examinations in 2017-18 and 2018-19?
दिया गया दंड आरेख सत्र 2017-18 और 2018-19 सत्र में बोर्ड परीक्षा में उपस्थित होने वाले छात्रों की संख्या को दर्शाता है। आरेख का अध्ययन करें और प्रश्न का उत्तर दें।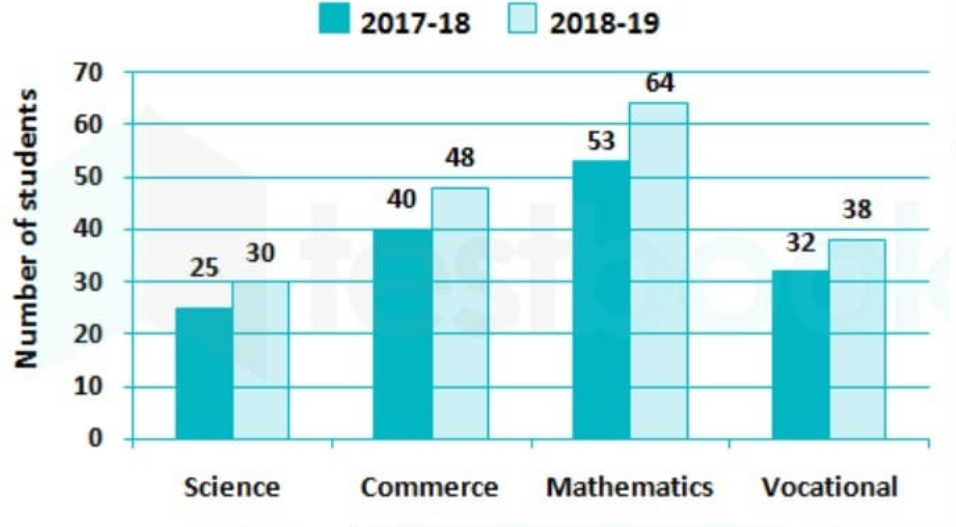
2017-18 और 2018-19 में परीक्षा में उपस्थित हुए छात्रों की कुल संख्या का अनुपात कया है ?
View SolutionStudy the bar graph and answer the following questions.
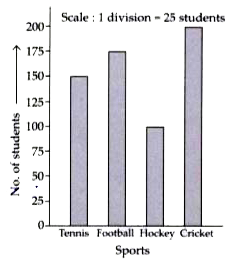
What is the difference between number of students playing football and hockey ?
View SolutionThe given bar graph represents the number of bodys and girls in five different schools. Study the graph and answer the question that follows
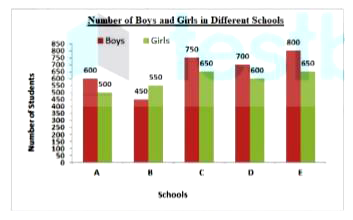
What is the average number of boys in schools A, B, C, D and E?
View SolutionStudy the given graph and answer the question that follows.
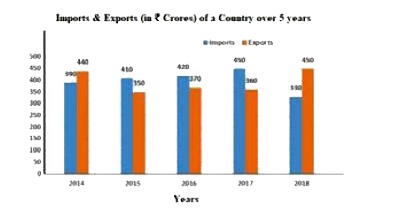
In which year are the exports of the country 87.5% of the average imports during 2016, 2017 and 2018 ?
View Solution
