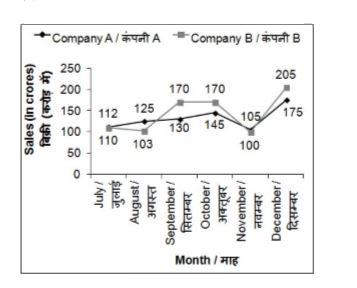
The line chart given below shows the sales (in crores) of company A and B from July to December.
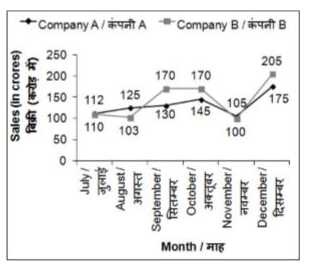
For how many months the sales of company B is more than the sales of company A?
a)2
b)3
c)1
d)4
The correct Answer is:B
Step by step video, text & image solution for The line chart given below shows the sales (in crores) of company A and B from July to December. For how many months the sales of company B is more than the sales of company A? by Maths experts to help you in doubts & scoring excellent marks in Class 14 exams.
Similar Questions
The bar chart given below shows the sales (in crores) of 2 companies A and B from years 2010 to 2015.
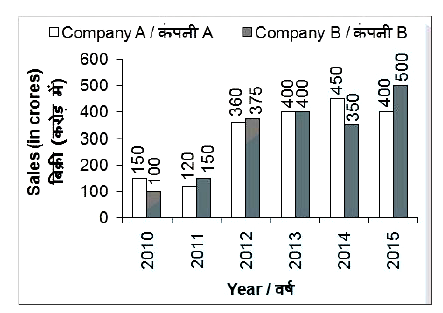
For how many years was the sale of company A greater than that of company B?View SolutionThe line chart given below shows the sales (in crores) of a complany for the years 2009 to 2016
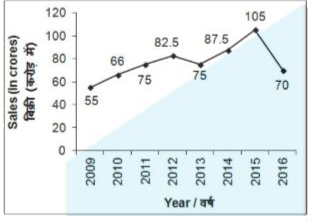
In how many years was the sale of the company more than the sale in 2011?View Solution
Knowledge Check
- Question 1 - Select One
The line chart given below shows the sales (in crores) of company A and B from July to December.
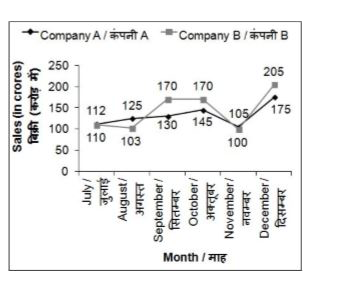
The sales of company B is same in which two months?ASeptember and OctoberBOctober and NovemberCAugust and NovemberDJuly and August - Question 2 - Select One
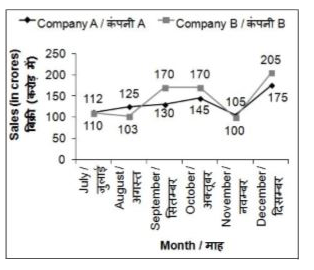
The line chart given below shows the sales (in crores) of company A and B from July to December.
The sales of company A in November is how much percent more than the sales of company B in November?A5B10C8D15 - Question 3 - Select One
The line chart given below shows the sales (in crores) of company A and B from July to December.
What is the average sale (in crore Rs) of company B in the given six months?A143B140C154D135
The bar chart given below shows the sales (in lacs) of 2 companies X and Y from year 2011 to 2016
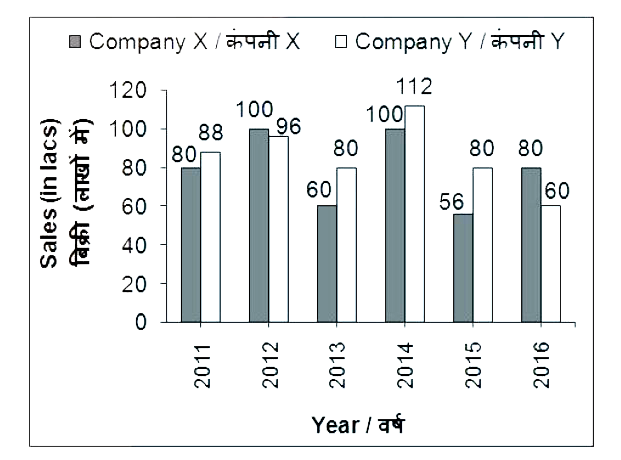
n how many years was the sale of company X more than that of company Y?View Solution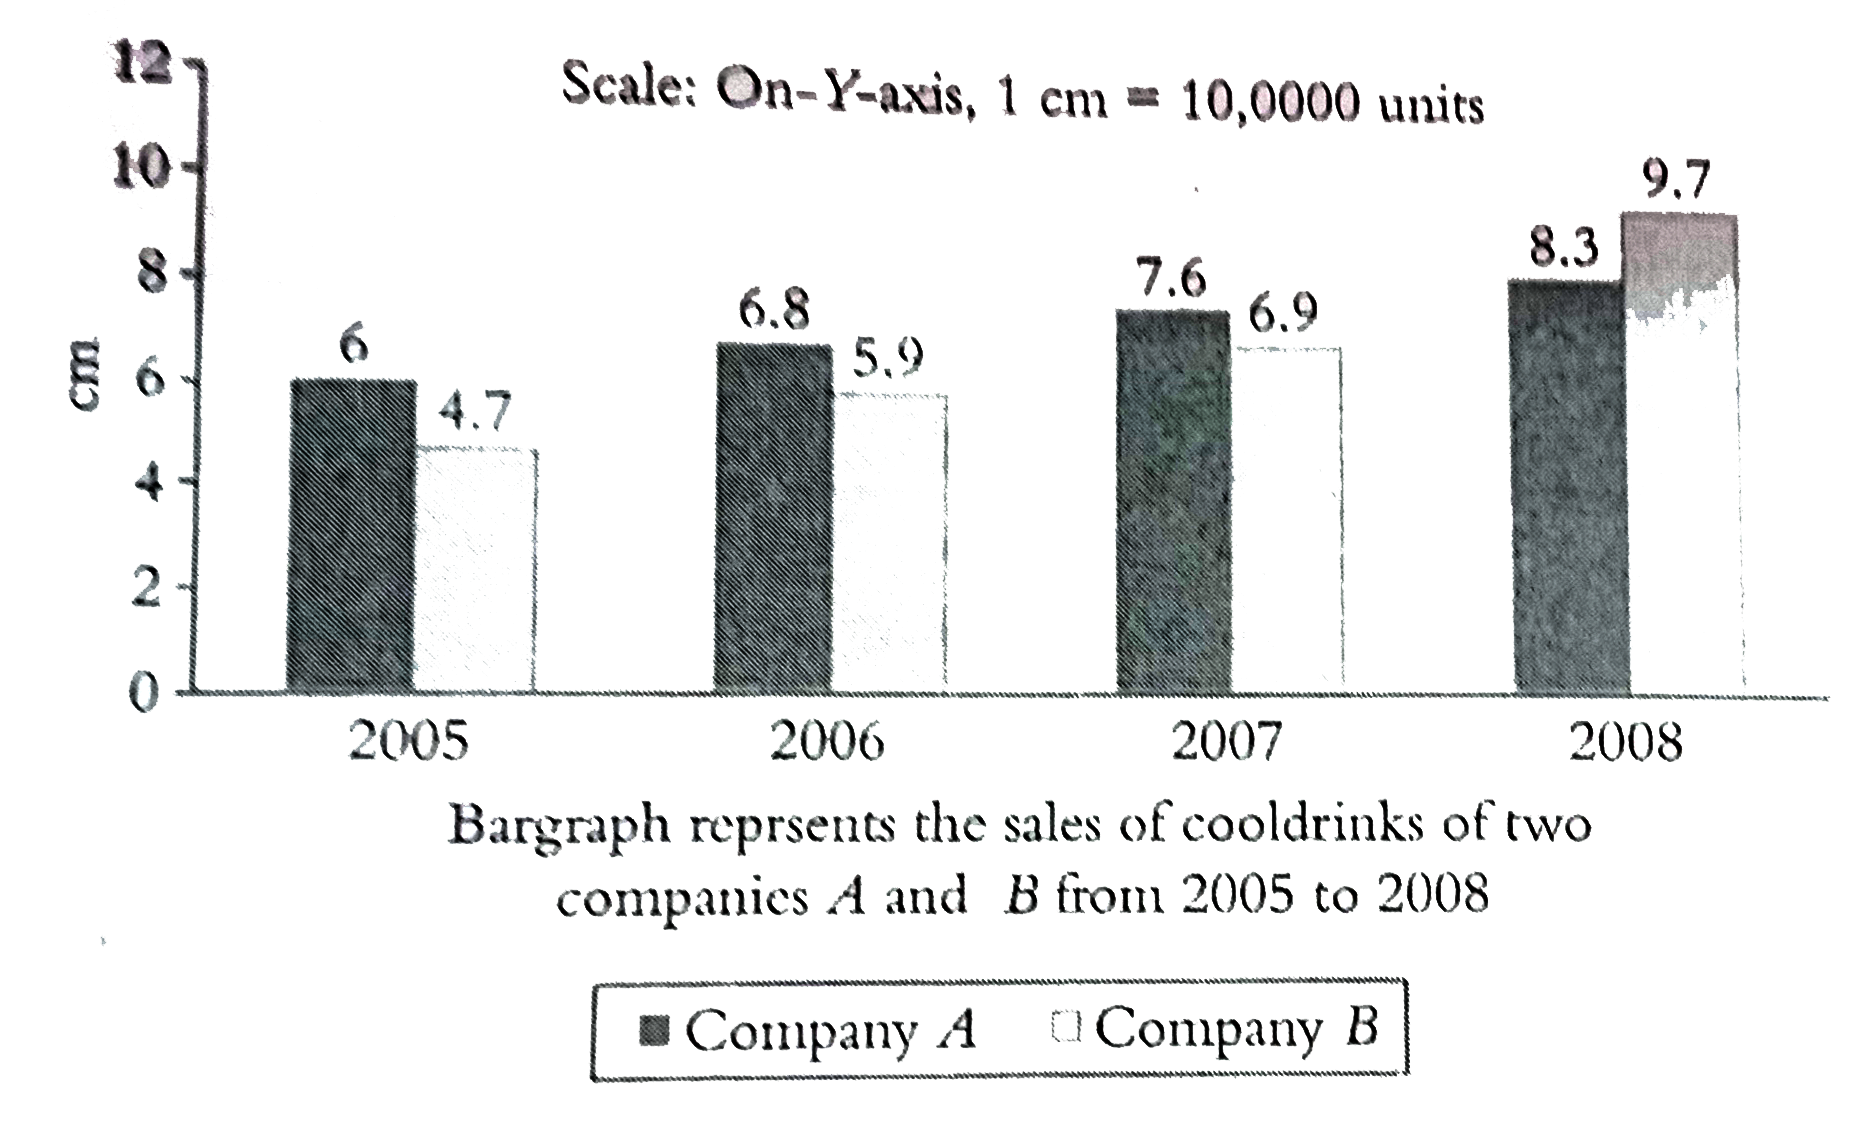
In which year is the sales of B more than the sales of A ?View SolutionThe line chart given below shows the sales (in crores) of a company for the years 2009 to 2016
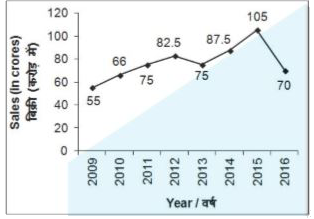
In how many years was the sale of the company a multiple of 10 crores?View SolutionThe bar chart given below shows the sales (in crores) of 2 companies A and B from years 2010 to 2015.
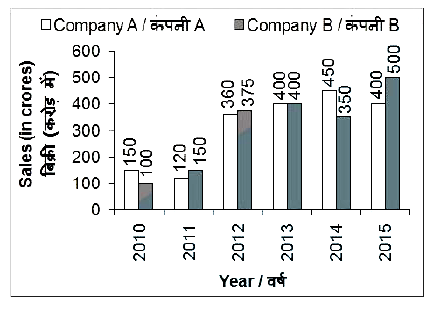
What is the difference (in crores) between the sales of company A in 2012 and company B in 2015?View SolutionThe bar chart given below shows the sales (in lacs) of 2 companies X and Y and Y from year 2011 to 2016
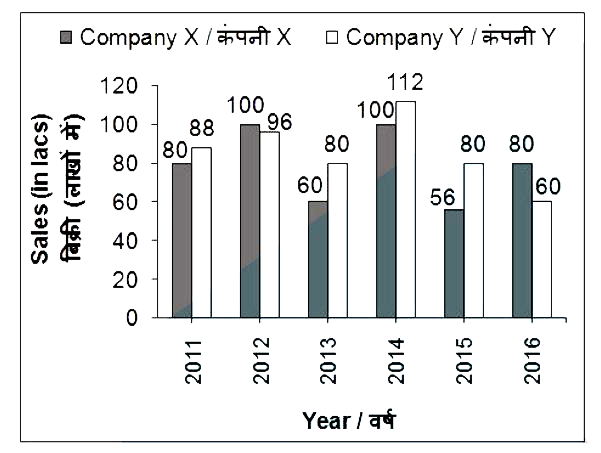
The sale of company Y in 2015 is what percent of the sale of company X in 2011?View Solution

