using the following data, draw time-displacement graph for a moving object.
 Use this graph to find average velocity for first 4s, for next 4s and for last 6s .Solution in Punjabi
Step by step video & image solution for using the following data, draw time-displacement graph for a moving object. Use this graph to find average velocity for first 4s, for next 4s and for last 6s . by Physics experts to help you in doubts & scoring excellent marks in Class 9 exams.
Updated on:21/07/2023Topper's Solved these Questions
Similar Questions
Let a car stawrt from I (initial position) and move in a semi-circular path in clockwise direction and reach f (Final position) which is diametrically opposite to i. Distance = πr Displacement = 2r
View SolutionA particle is thrown up vertically with a velocity of 50 m/s. What will be its velocity at the highest point of its journey?
View SolutionIn which of the three media, air, water or iron sound travel the fastest at a particular temperature ?
View SolutionDraw displacement time and acceleration -time graph for the given velocity-time graph

View SolutionUsing follwing data, draw time-displacement graph for a moving object. {:("Time (s)",0,2,4,6,8,10,12,14,16),("Displacement (m)",0,2,4,4,4,6,4,2,0):} Use this graph to find average velocity for first 4s, for next 4 s and for last 6 s.
View SolutionA body cover 20 m in 2 s and another 20 m in next 4s. Arrange the following steps in sequential order to find th average velocity of the body .
(A) Find the displacements of the body in first 2s and next 4 s from the given data.
(B) find the displacements of the body .
(C) find the total time taken by the body to complete the total displacement .
(D) Use the formula, average velocity = total displacement Total time taken
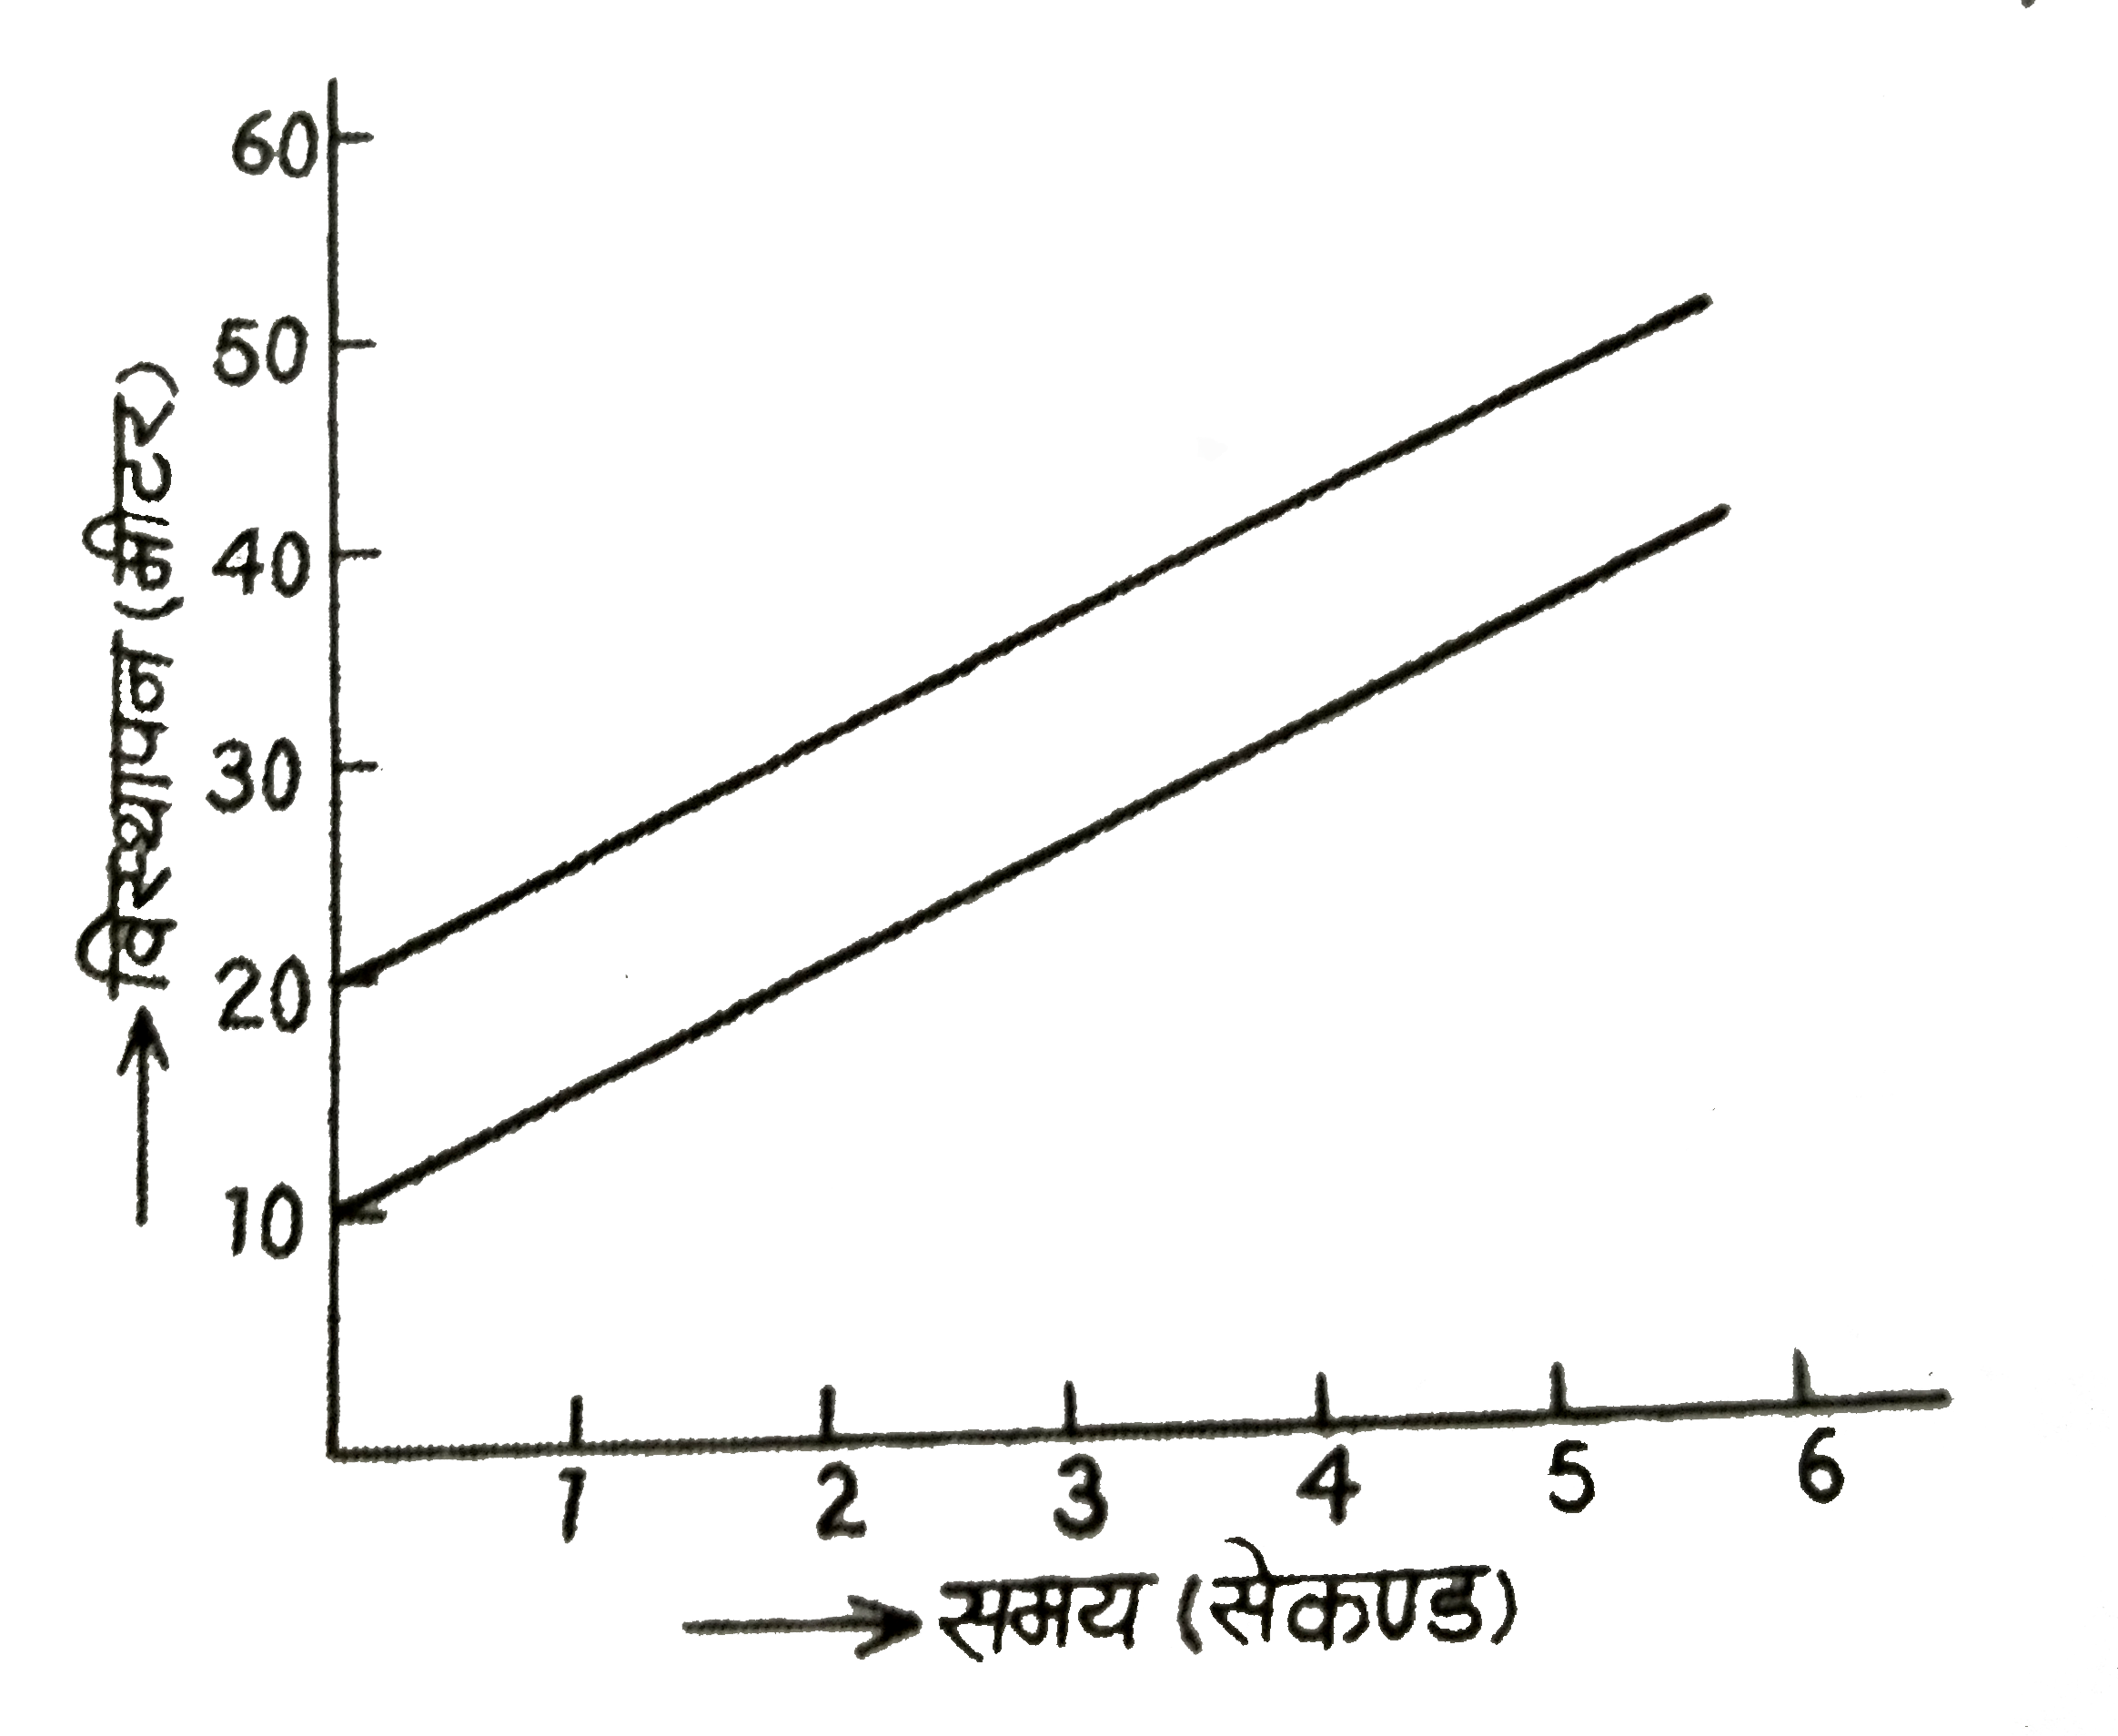
View Solutionनिम्नांकित ग्राफ में दो वस्तुओं A तथा B का विस्थापन - समय ग्राफ प्रदर्शित है । वस्तु A का B का सापेक्ष वेग ज्ञात कीजिए ।

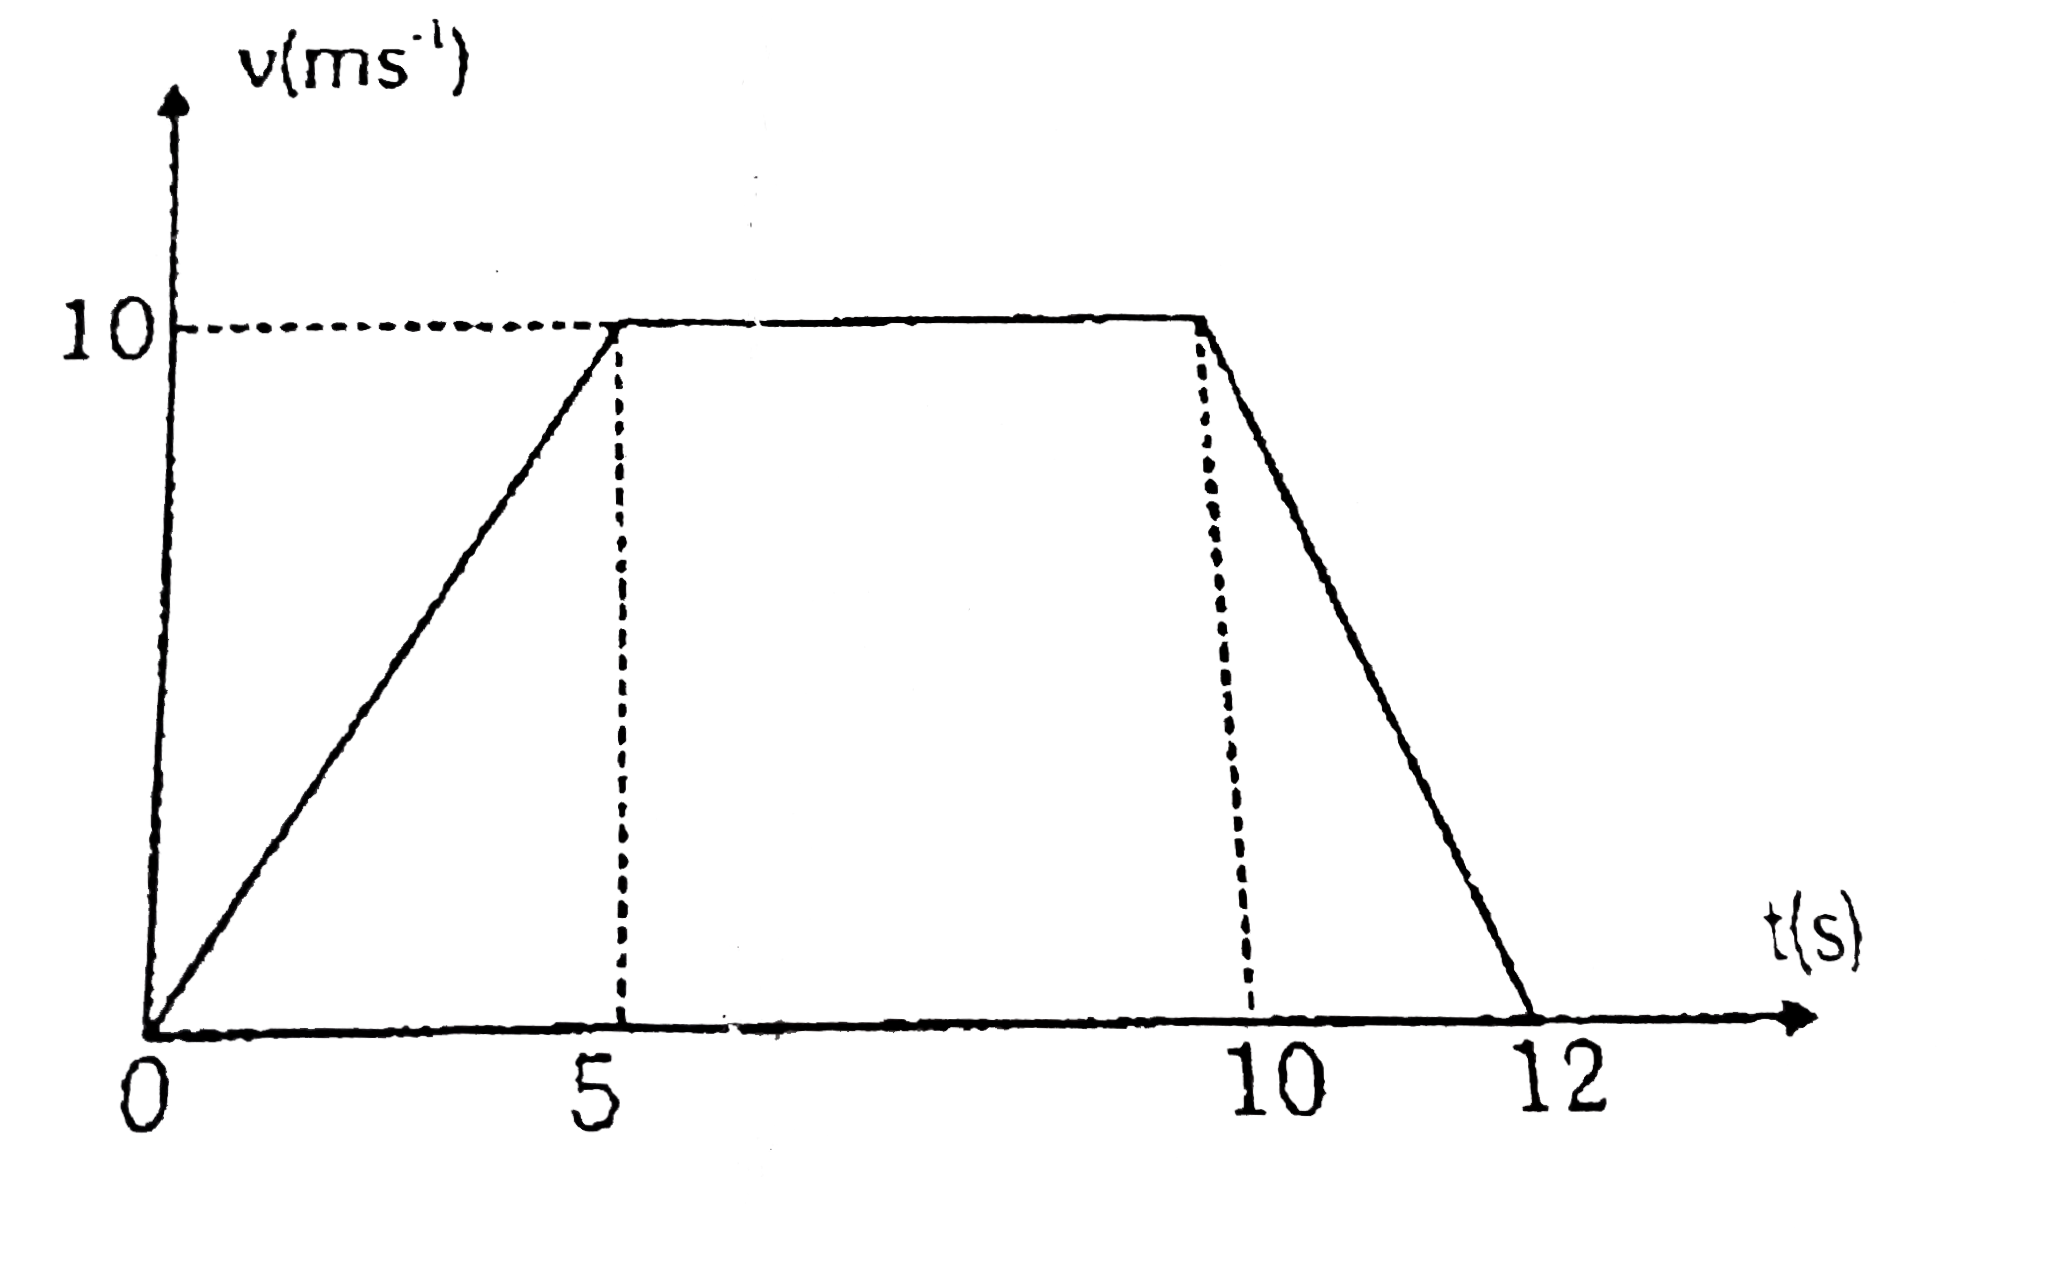
View SolutionVelocity - time graph of a moving object is shown below. What is the acceleration of the object? Also draw displacement - time graph for the motion of the object?
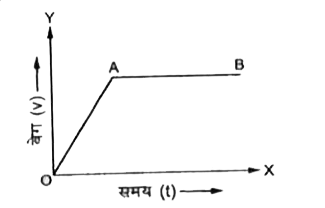
View Solutionबगल के चित्र में वेग - समय ग्राफ दर्शाया गया है। इस ग्राफ का संगत विस्थापन - समय ग्राफ खींचे।

View Solutionप्रक्कथन : उच्च वेग से गति करती हुई वस्तु के विस्थापन समय ग्राफ का ढाल कम वेग से गति करती हुई वस्तु के विस्थापन-समय ग्राफ के ढाल से तीव्र (अधिक) होता है।
कारण : विस्थापन-समय ग्राफ का ढाल = वस्तु का वेग।
View SolutionUsing follwing data, draw time-displacement graph for a moving object. {:("Time (s)",0,2,4,6,8,10,12,14,16),("Displacement (m)",0,2,4,4,4,6,4,2,0):} Use this graph to find average velocity for first 4s, for next 4 s and for last 6 s.
View SolutionDraw the velocity-time graph for an object in uniform motion. Show that the area under the velocity-time graph gives the displacement of the object in the given time interval.
View SolutionAcceleration-time graph of a moving object is shown in figure. Draw the velocity- time graph and displacement-time graph corresponding to this type of motion. .
View Solutionनीचे दिए गए आंकड़ों की सहायता से किसी गतिमान पिंड के लिए विस्थापन-समय ग्राफ खींचिए|
समय (s)0246810121416विस्थापन (m)024446320
इस ग्राफ का उपयोग करके पहले 4 s के लिए अगले 4 s के लिए तथा अंतिम 6s के लिए पिंड का औसत वेग ज्ञात कीजिए|
View Solutionসমমন্দনে গতিশীল বস্তুকণার বেগ-সময় লেখচিত্র অঙ্কন করে।
View SolutionDraw velocity-time graph from the following data: -
View Solution
