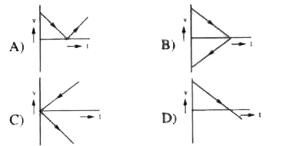
Four speed-time graph are shown below:
 Which graph represents the following case:
(a) A ball thrown vertically upwards and returning to the hand of the thrower?
(b) A body decelerating to a constant speed and then accelerating?Solution in Punjabi
Step by step video & image solution for Four speed-time graph are shown below: Which graph represents the following case: (a) A ball thrown vertically upwards and returning to the hand of the thrower? (b) A body decelerating to a constant speed and then accelerating? by Physics experts to help you in doubts & scoring excellent marks in Class 9 exams.
Updated on:21/07/2023Topper's Solved these Questions
Similar Questions
Let a car stawrt from I (initial position) and move in a semi-circular path in clockwise direction and reach f (Final position) which is diametrically opposite to i. Distance = πr Displacement = 2r
View SolutionA particle is thrown up vertically with a velocity of 50 m/s. What will be its velocity at the highest point of its journey?
View SolutionIn which of the three media, air, water or iron sound travel the fastest at a particular temperature ?
View SolutionA ball is thrown vertically upwards. Which of the following graph/graphs represent velocity time graph of the ball during its flight ( air resistance is neglected).
View SolutionA ball is thrown vertically upwards. Which of the following plots represents the speed-time graph of the ball during its height if the air resistance is not ingnored ?
View SolutionA ball is thrown vertically upwards. Which of the following plots represent the speed graph of the ball during its flight if the air resistence is not ignored?
View SolutionThree speed-time graphs are shown below.
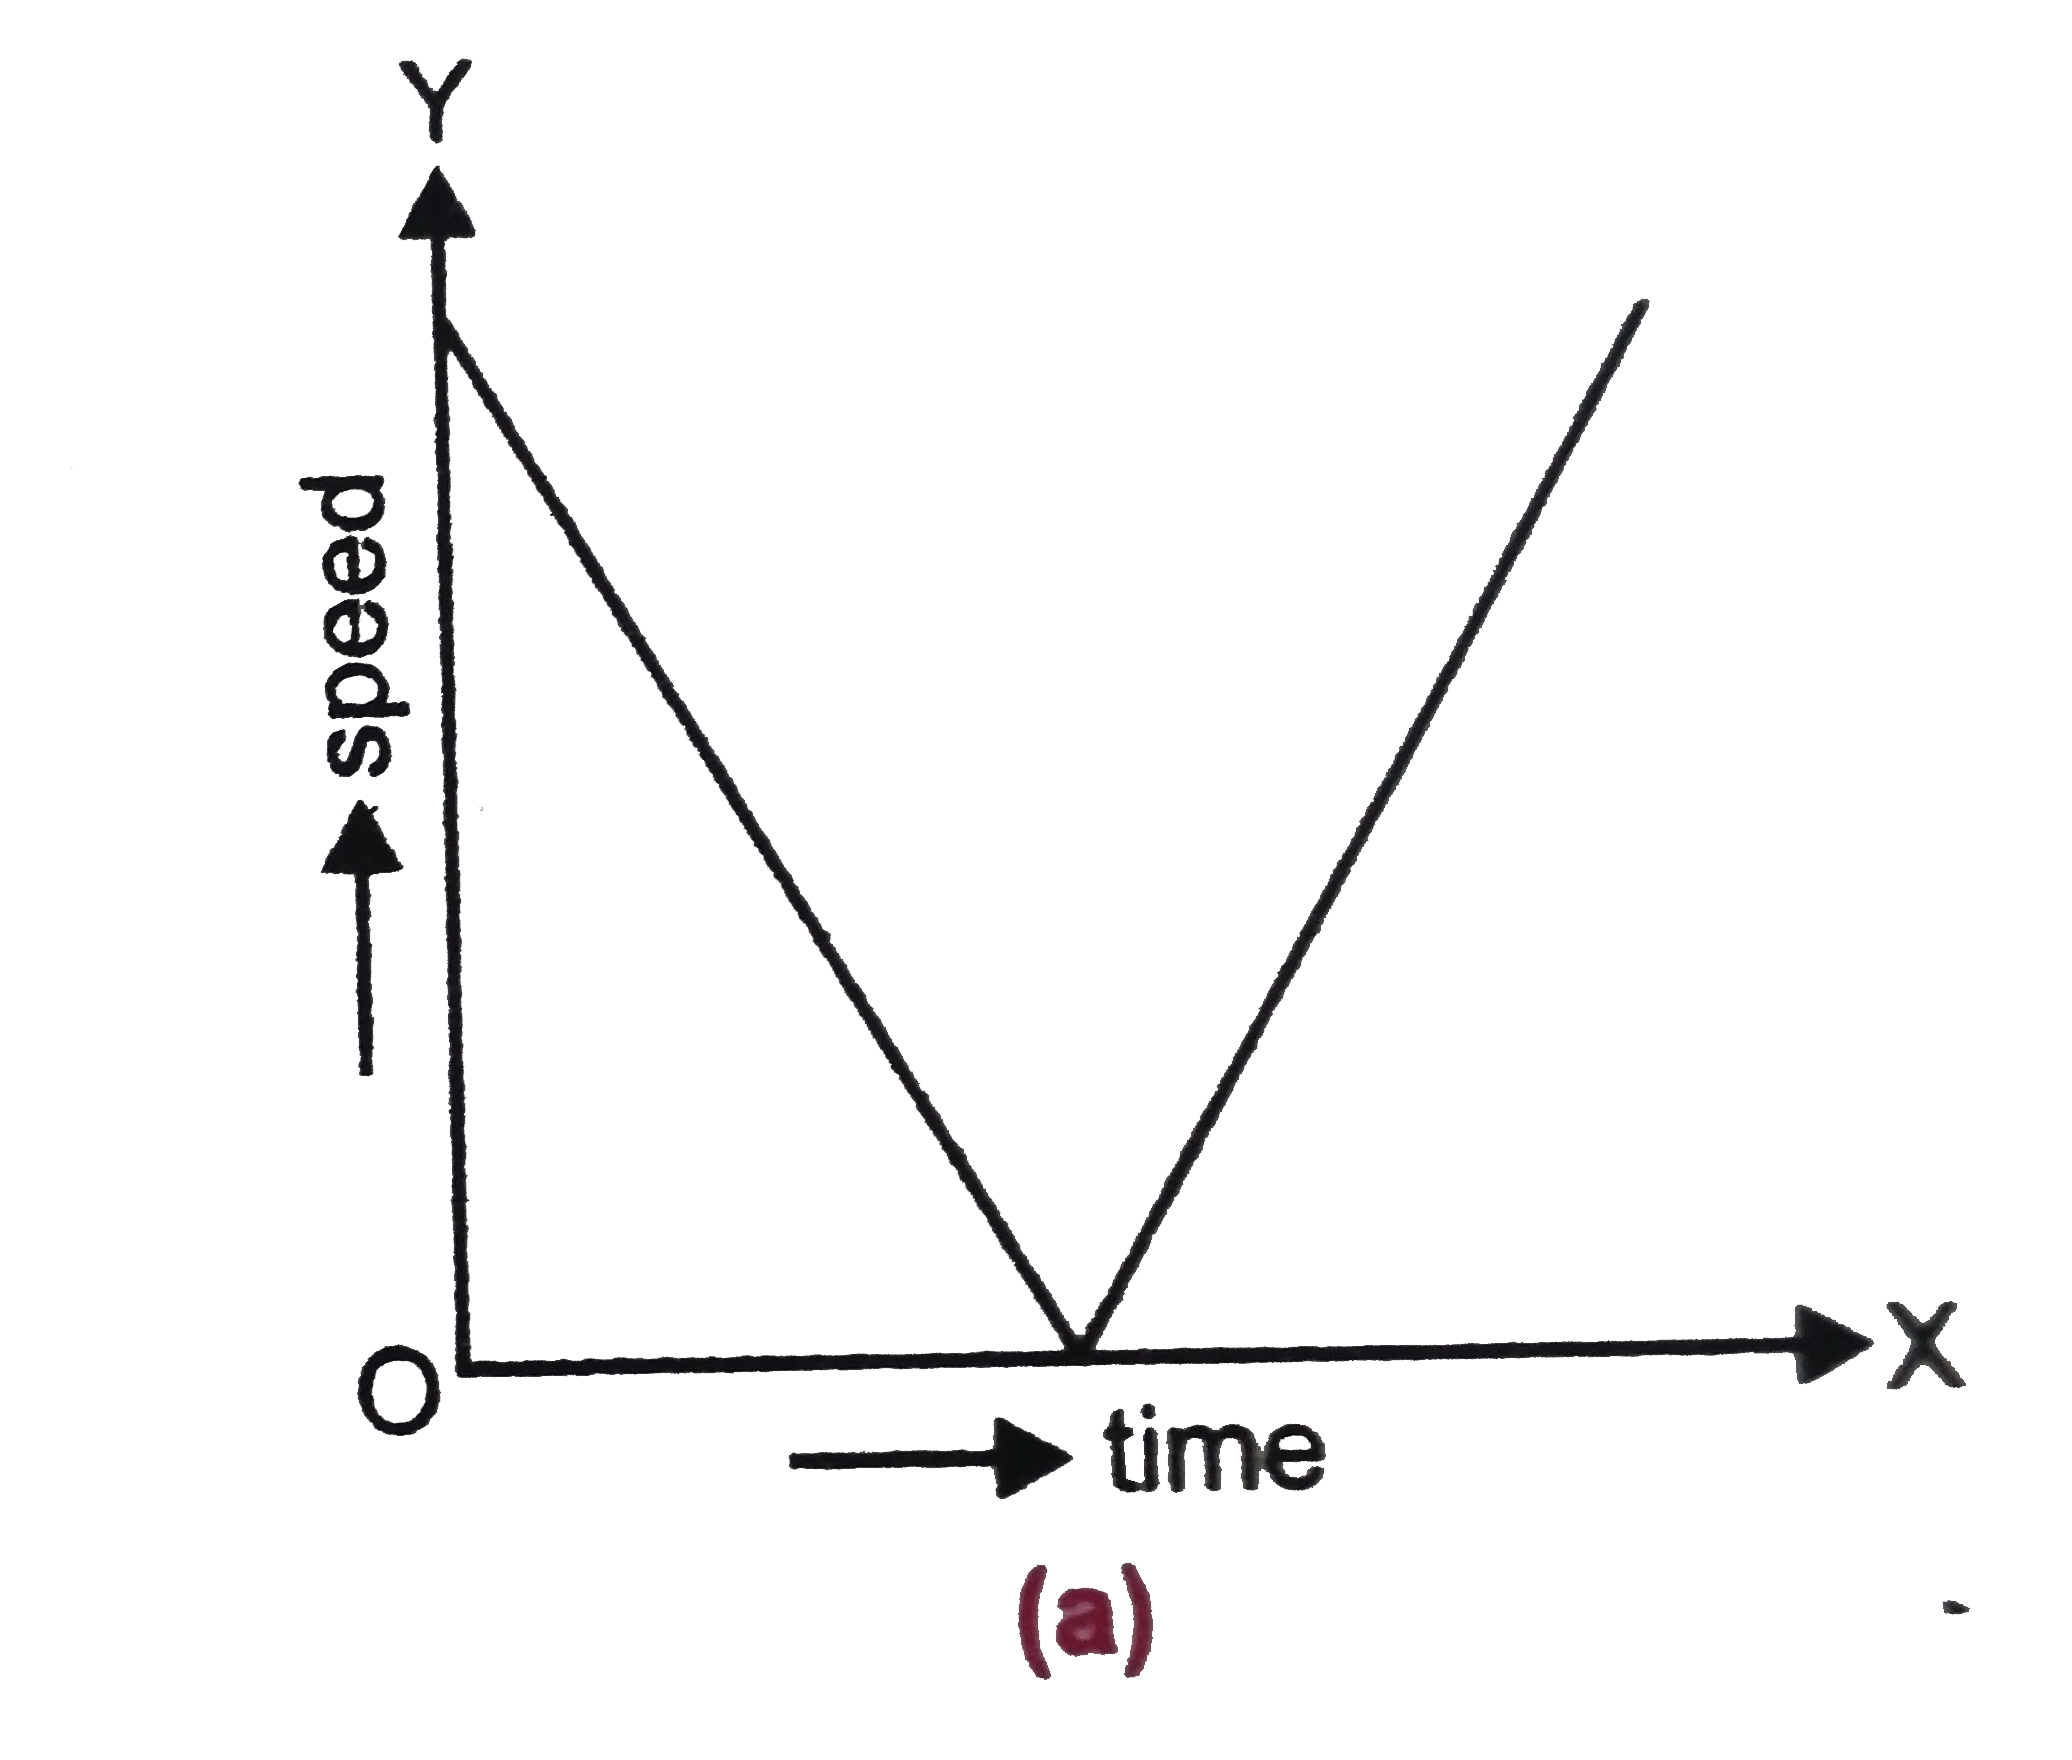
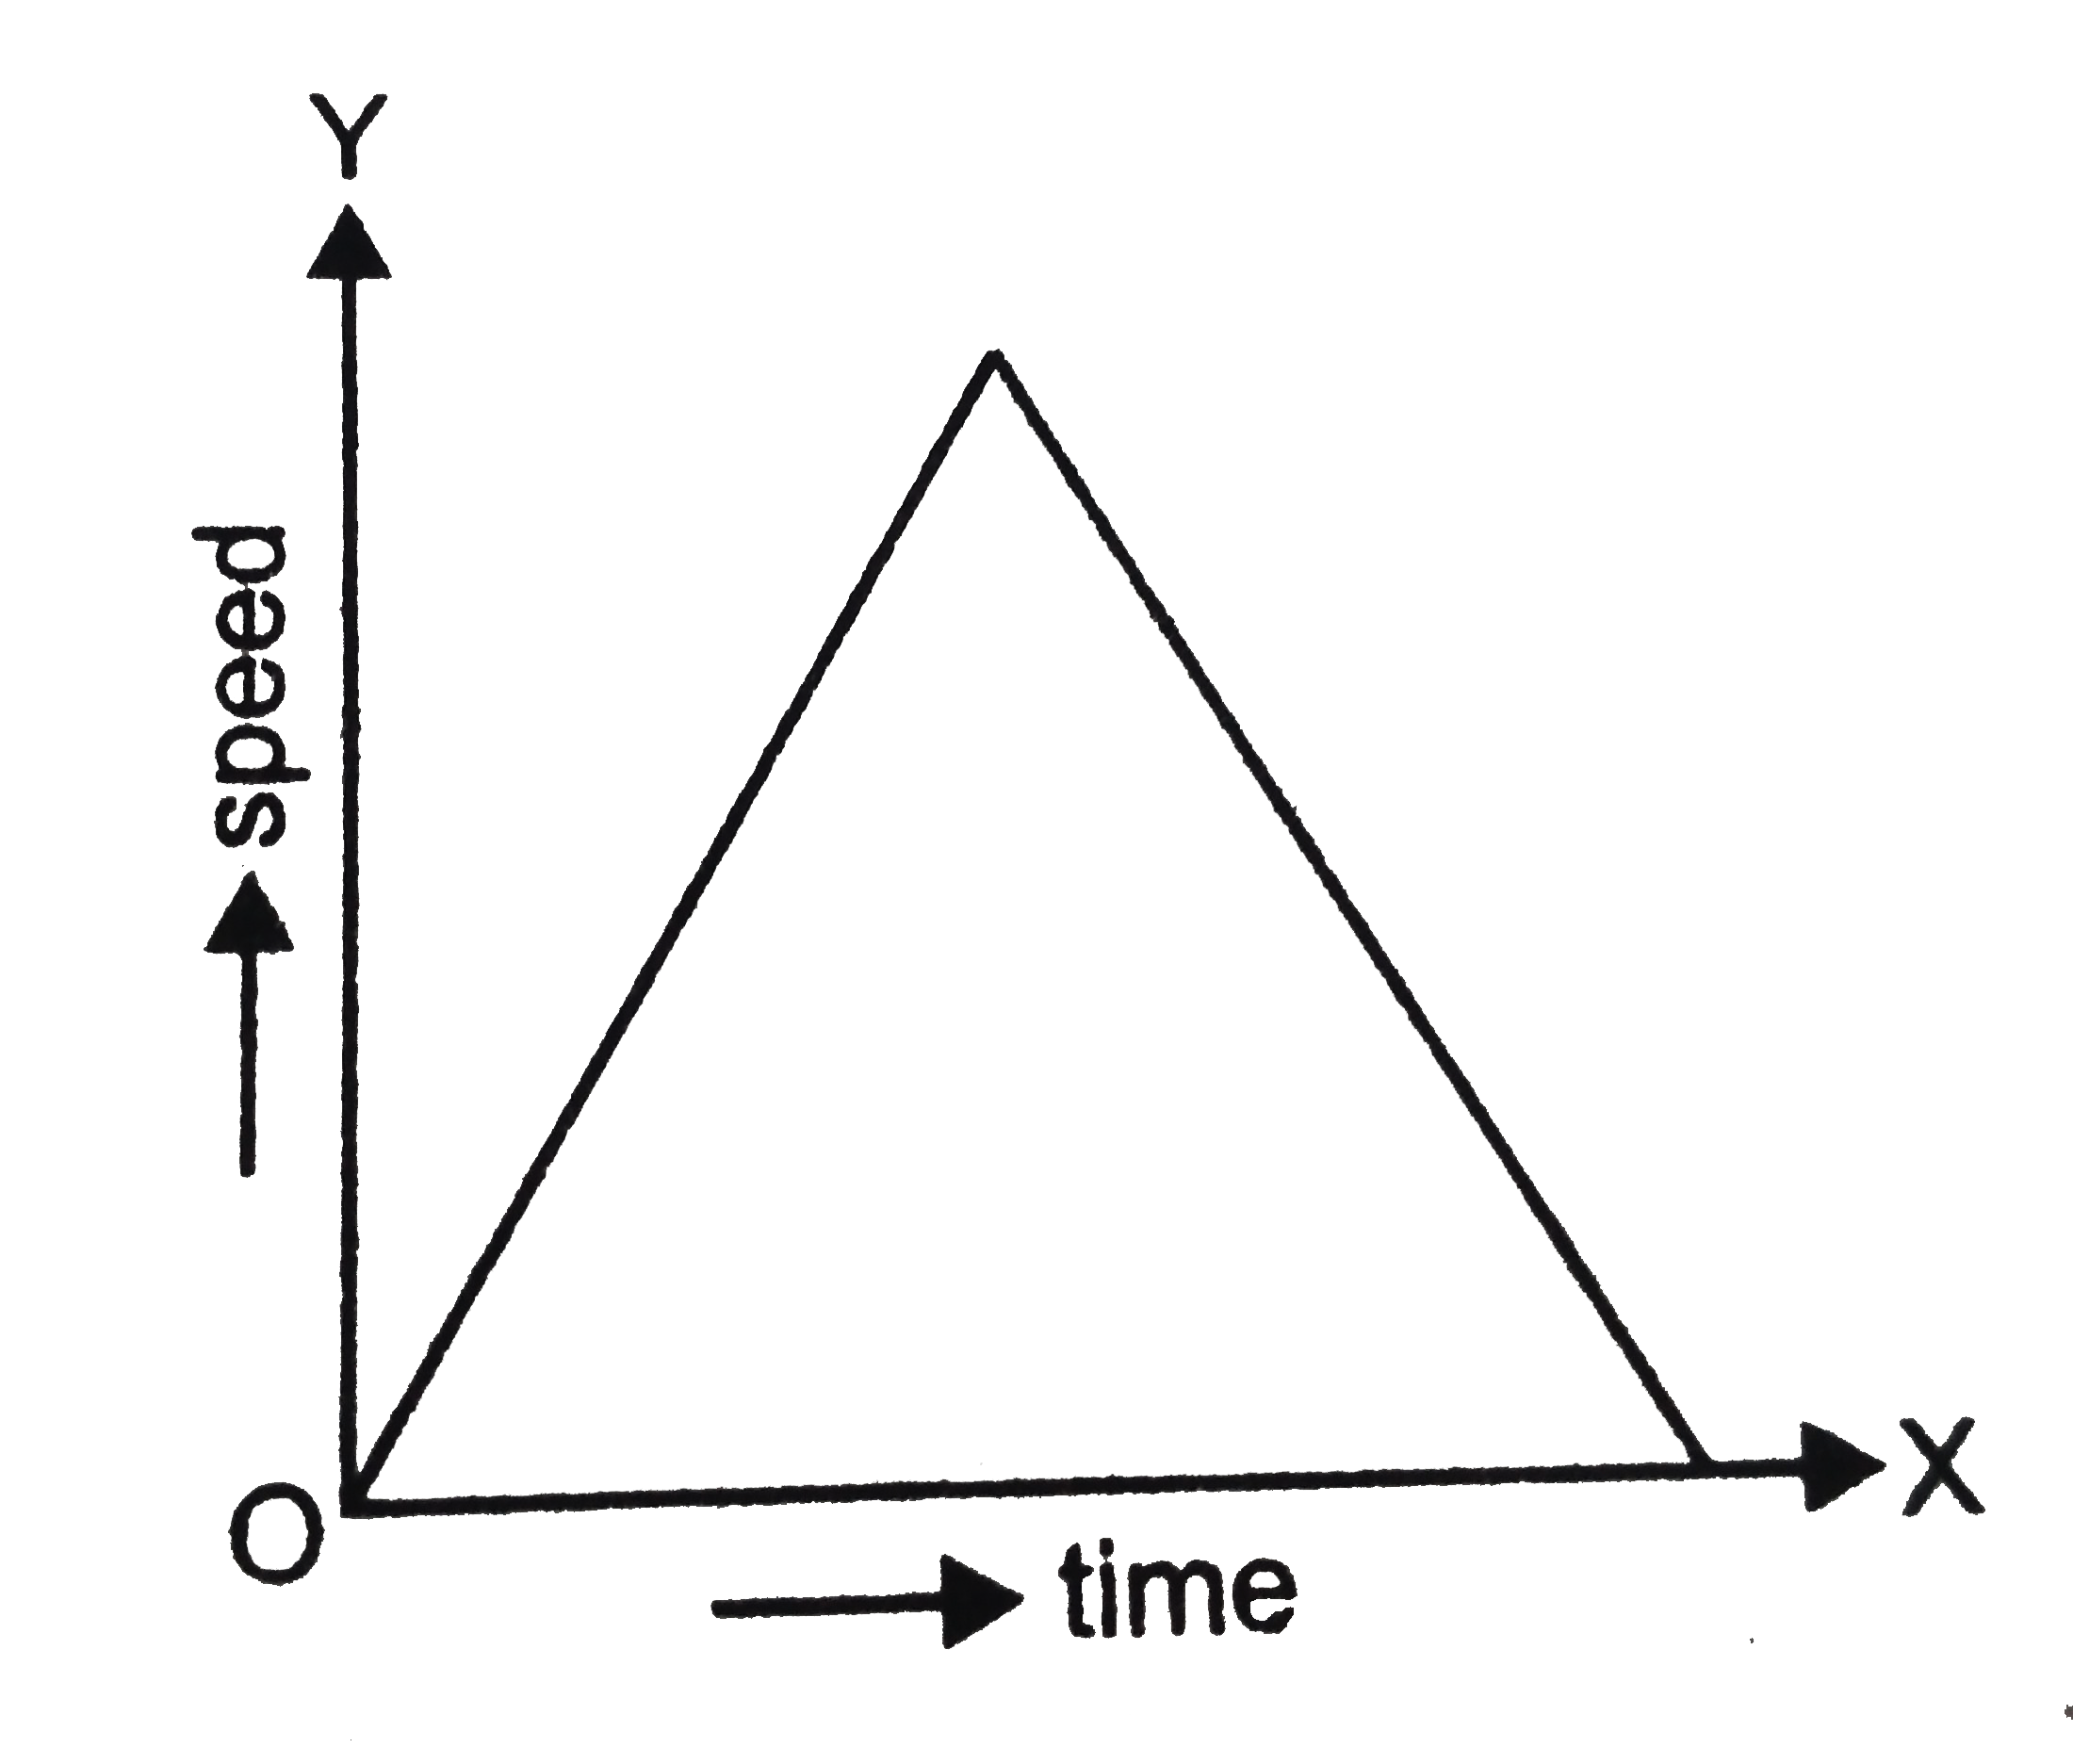
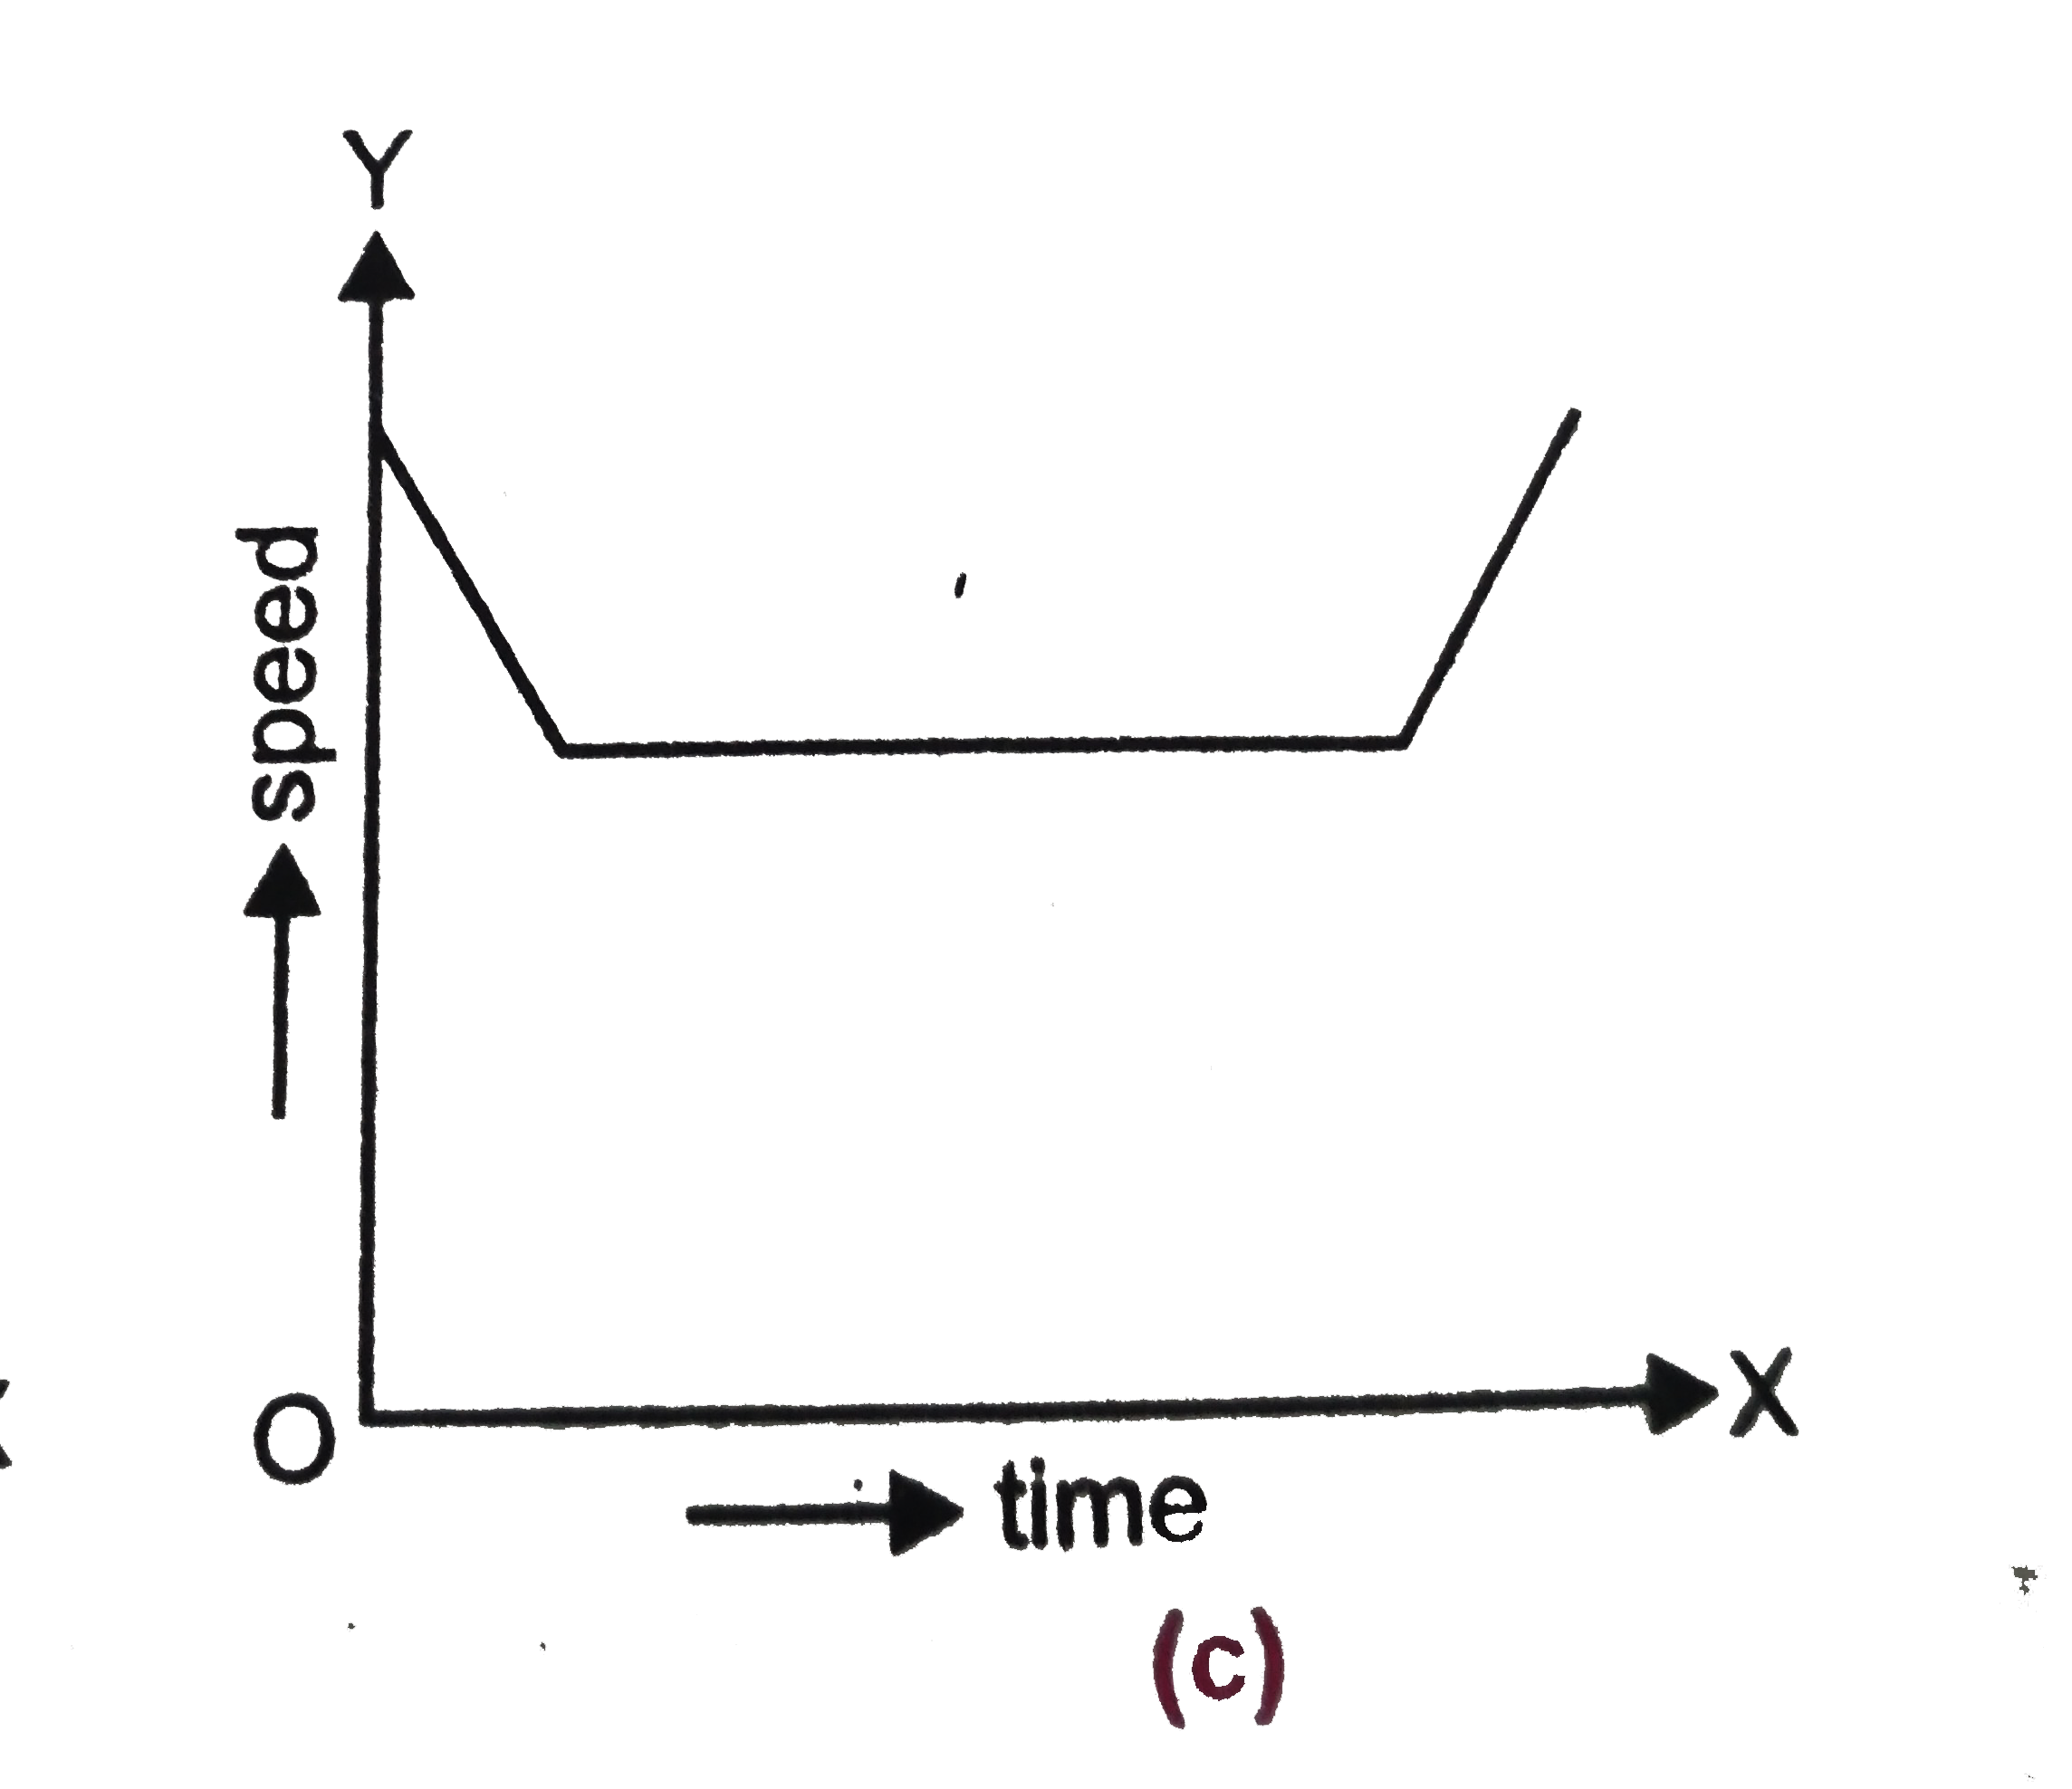
(i) A ball thrown vertically upwards and returning to the hand of the thrower ?
(ii) A body decelerating to a constant speed and accelerating.
View SolutionThree speed-time graphs are given below : Which graph represents the case of : (i) A cricket ball thrown vertically upwards and returning to the hands of the thrower ? (ii) A trolley decelarating to a constant speed and then accelerating uniformly ?
View Solutionएक गेंद को ऊर्ध्वाधर ऊपर की ओर प्रक्षेपित किया गया है | निम्न ग्राफ में से कौन-सा ग्राफ गेंद की हवा में गति के लिए वेग समय ग्राफ को दर्शाता है | ( हवा का प्रतिरोध नगण्य है ) -
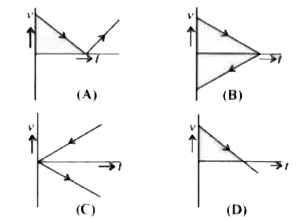
View SolutionA ball is thrown vertically upward. Draw its (i) velocity -time graph (ii) acceleration -time graph.
View SolutionA ball is thrown vertically upwards. Which of the following plots represents the speed-time graph of the ball during its flight in the air (resistance of air is not ignored)?
View SolutionA ball is thrown vertically upwards. Which of the following graph/graphs represent velocity-time graph of the ball during its flight (air resistance is neglected)
View SolutionA ball is thrown vertically upwards .Which of the following graph/graphs represent velocity-time graph of the ball during its flight (air resistance is neglected )
View SolutionA ball is thrown vertically upwards. Which of the following graph/graphs represent velocity-time graph of the ball during its flight (air resistance is neglected)

View SolutionA ball is thrown vertically upwards. Which of the following graph/graphs represent velocity-time graph of the ball during its flight (air resistance is neglected)

View SolutionA ball is thrown vertically upwards and comes back.Which of the following graph represents the velocity-time graph of the ball during its flight?
View Solution
