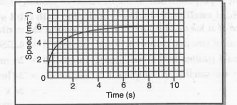
The graph below shows how the speed car changes with time:
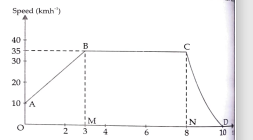 What is the maximum speed attained by the speed?Solution in Punjabi
Step by step video & image solution for The graph below shows how the speed car changes with time: What is the maximum speed attained by the speed? by Physics experts to help you in doubts & scoring excellent marks in Class 9 exams.
Updated on:21/07/2023Topper's Solved these Questions
Similar Questions
Let a car stawrt from I (initial position) and move in a semi-circular path in clockwise direction and reach f (Final position) which is diametrically opposite to i. Distance = πr Displacement = 2r
View SolutionA particle is thrown up vertically with a velocity of 50 m/s. What will be its velocity at the highest point of its journey?
View SolutionIn which of the three media, air, water or iron sound travel the fastest at a particular temperature ?
View SolutionA car is accelerated on a lavelled road and attains a speed of 4 times its initial speed. In this process, the kinetic energy of the car :
View SolutionThe graph given alongside shows how the speed of a car changes with time :
(i) What is the initial speed of the car ? ltBrgt (ii) What is the maximum speed attained by the car ? ltBrgt (iii) Which part of the graph shows zero acceleration ? ltBrgt (iv) Which part of the graph shows varying retardation ?
(v) Find the distance travelled in first 8 hours.
View Solutionनिम्नलिखित स्थितियों में गति के दूरी –समय ग्राफ की आकृति दर्शाइए-
क. नियत चाल से गति करती कार
ख. सड़क के किनारे खड़ी कोई कार
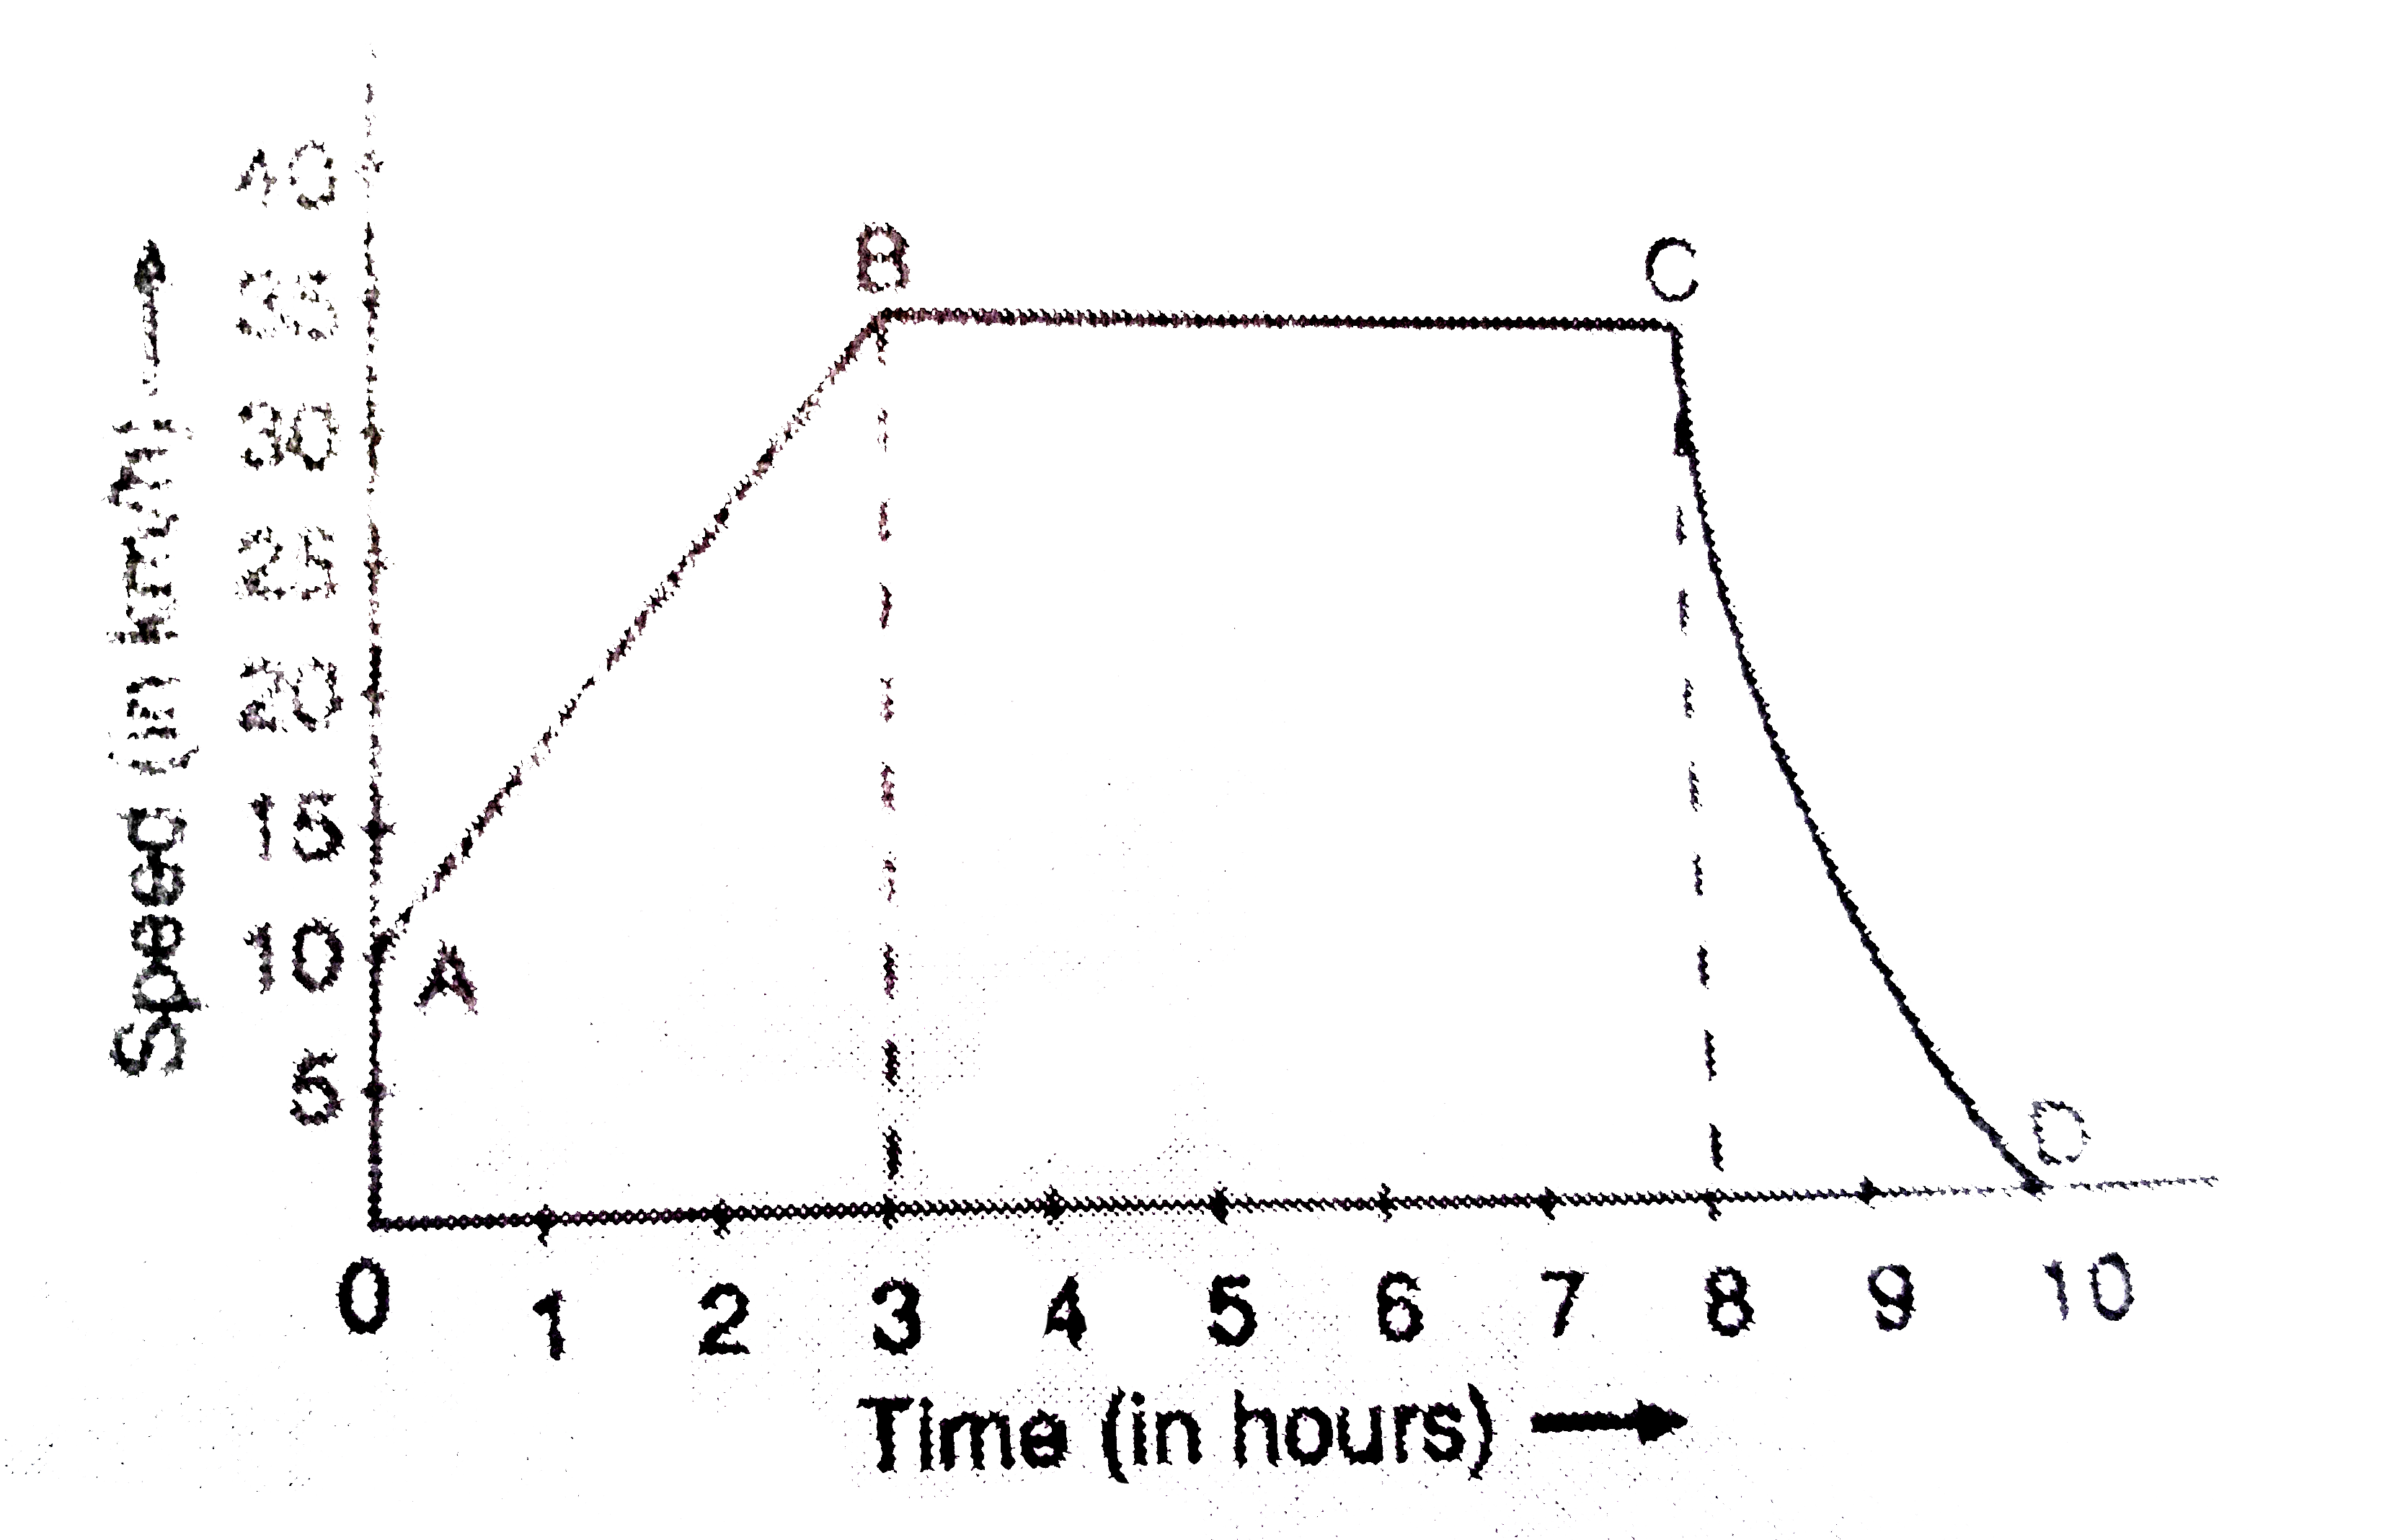
View Solutionचित्र 3.40 में सीधी रेखा में गतिशील कार स्थिति - समय ग्राफ प्रदर्शित है । ग्राफ की सहायता से ज्ञात कीजिए :
कार की अधिकतम चाल ।
View SolutionIn previous question, if the total distance covered by the car is s, the maximum speed attained by it will be :
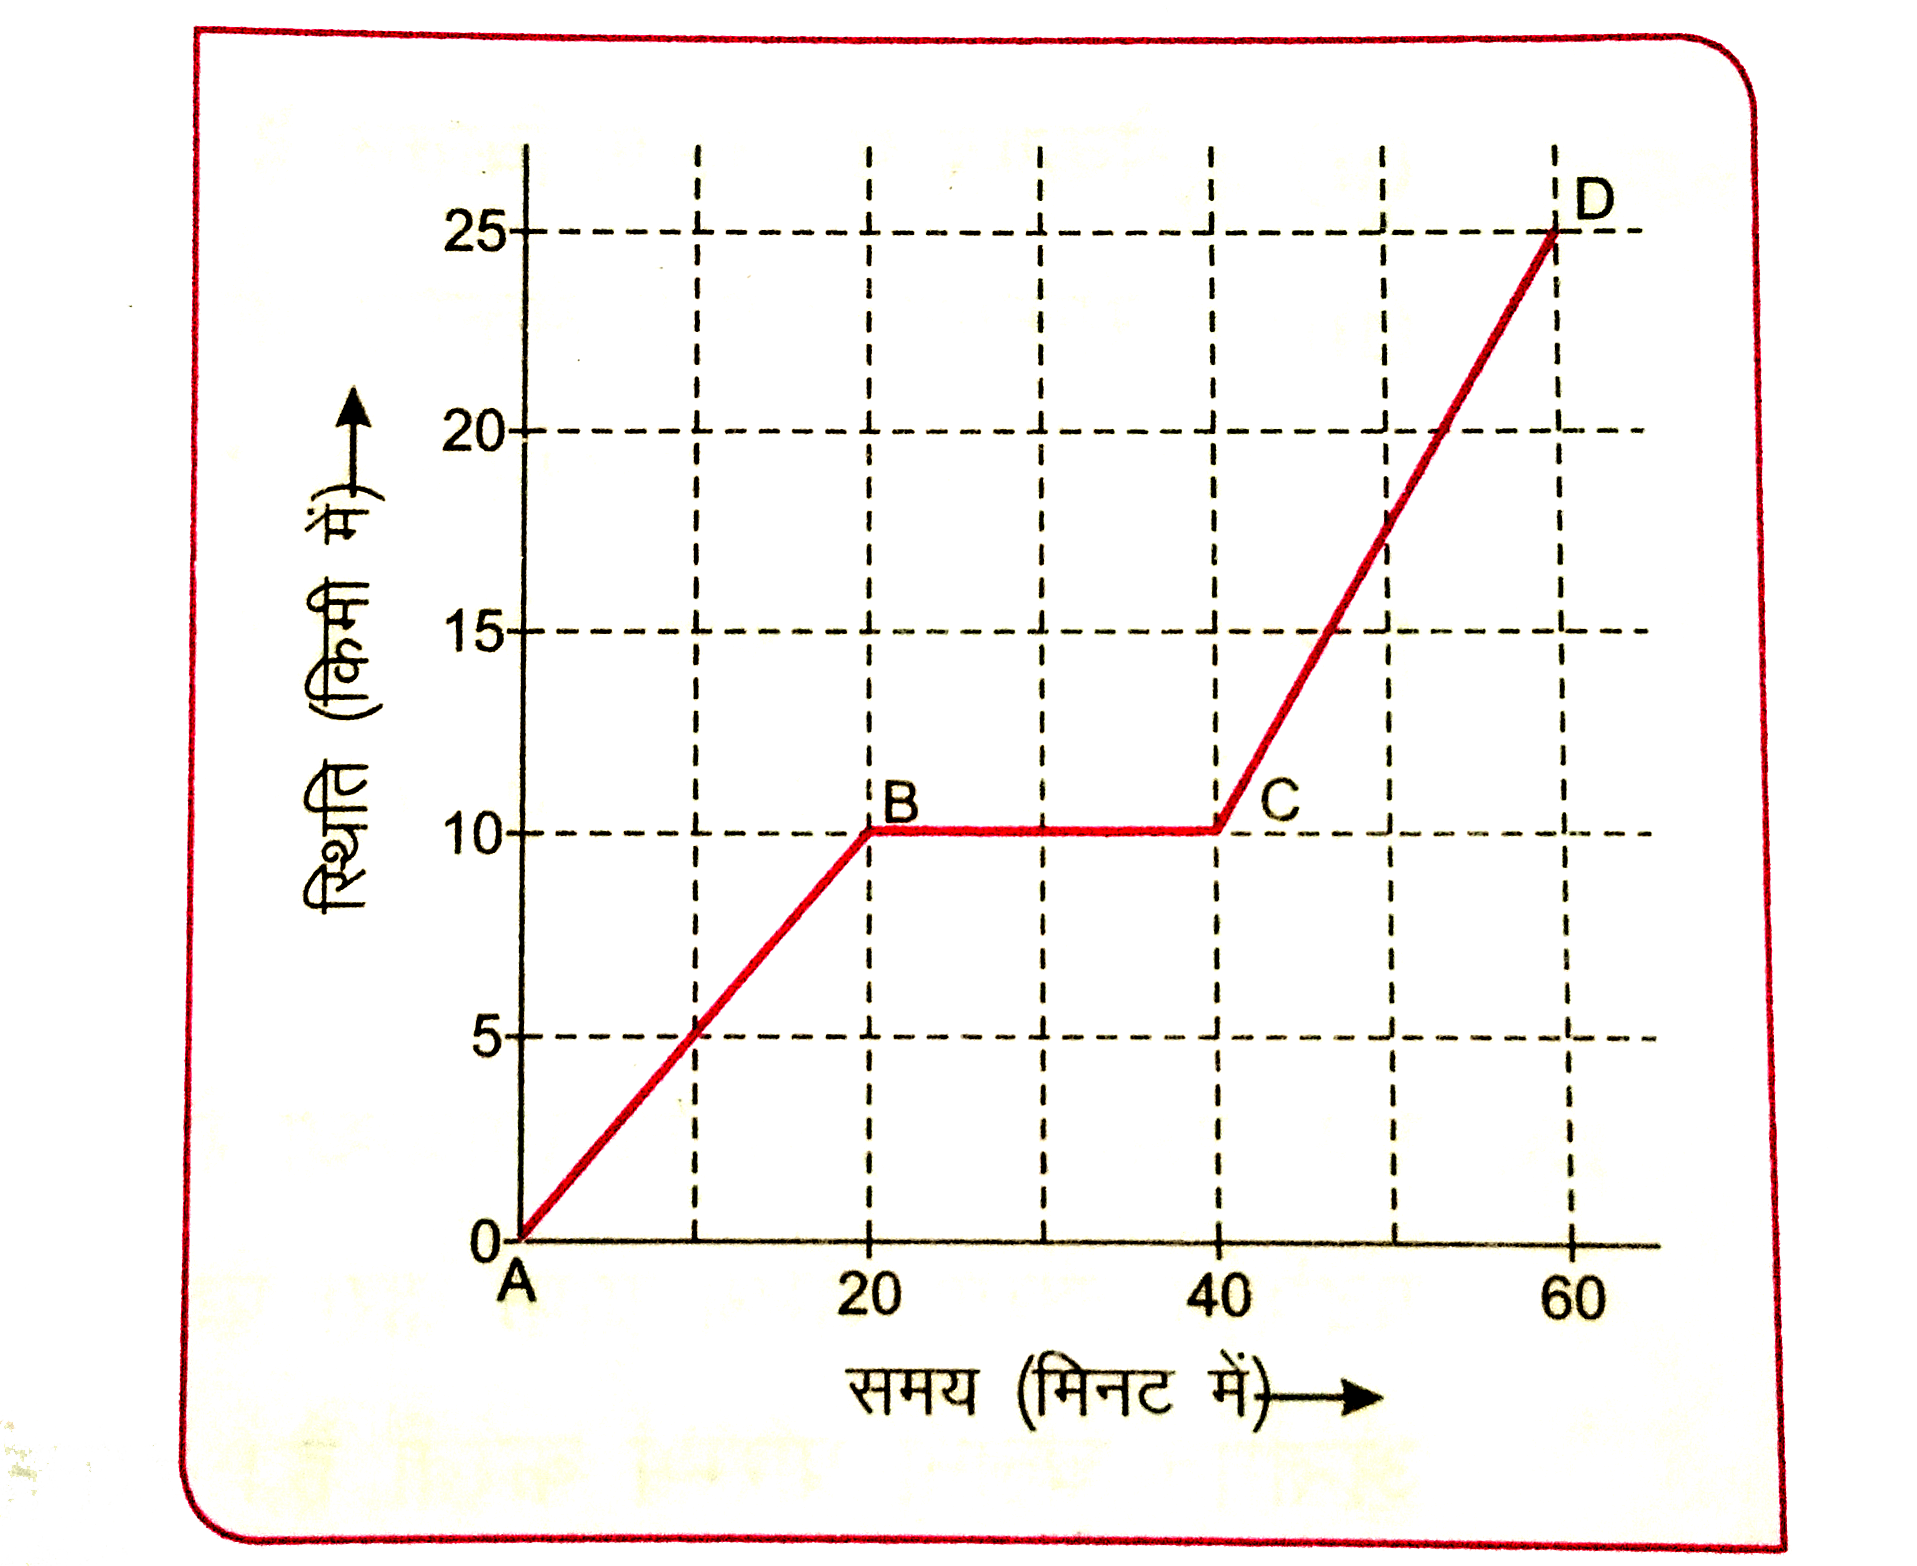
View Solutionकिसी कार् का चाल - समय ग्राफ नीचे दिया गया है।
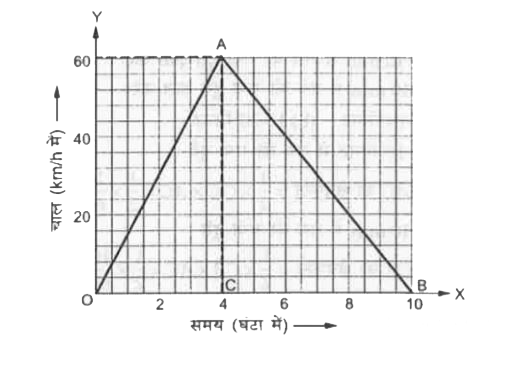
(a) कार का पहले 4h में और अंत के 6 h में त्वरण कितना है ?
(b) कार ने कुल कितनी दूरी तय की।
(c) कार की औसत चाल क्या है ?
View SolutionSpeed - time graph for a car is show in the fig 1.13:Which part of the graph represents uniform motion of the car ?
View SolutionThe speed-time graph of a car is shown in figure given below Speed-time graph] (a) Find how far does the car travel in the first 4 second. Shade the area on the graph that represents the distance travelled by the car during the period. (b) Which part of the graph represents uniform motion of the car ?
View Solutionनिम्नलिखित स्थितियों में गति के दूरी-समय ग्राफ की आकृति दर्शाइए-
नियत चाल से गति करती कार
View SolutionDraw a distance-time graph to show the motion of a car moving with a speed which is not constant (non-uniform speed).
View SolutionThe speed-time graph of a car is shown in figure given below Speed-time graph] (a) Find how far does the car travel in the first 4 second. Shade the area on the graph that represents the distance travelled by the car during the period. (b) Which part of the graph represents uniform motion of the car ?
View SolutionSpeed - time graph for a car is show in the fig 1.13:Which part of the graph represents uniform motion of the car ?
View Solutionકાર તેનો વેગ અચળ પ્રવેગથી 10m/s બદલી 20m/s ધારણ કરે છે. કારના વેગને સમયના વિધેય તરીકે દર્શાવતો આલેખ દોરો.
View Solution
