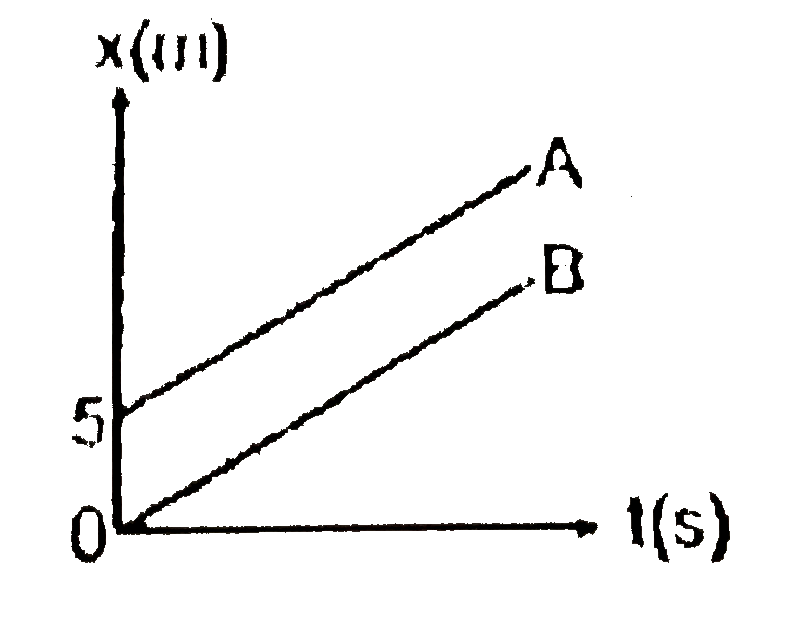
Interpret the following figure which shows position of bodies A and B at different isntants of time. Graph of position versus time and give answers of the following questions:
 Draw a velocity-time graph for A and B.Solution in Punjabi
Step by step video & image solution for Interpret the following figure which shows position of bodies A and B at different isntants of time. Graph of position versus time and give answers of the following questions: Draw a velocity-time graph for A and B. by Physics experts to help you in doubts & scoring excellent marks in Class 9 exams.
Updated on:21/07/2023Topper's Solved these Questions
Similar Questions
Let a car stawrt from I (initial position) and move in a semi-circular path in clockwise direction and reach f (Final position) which is diametrically opposite to i. Distance = πr Displacement = 2r
View SolutionA particle is thrown up vertically with a velocity of 50 m/s. What will be its velocity at the highest point of its journey?
View SolutionIn which of the three media, air, water or iron sound travel the fastest at a particular temperature ?
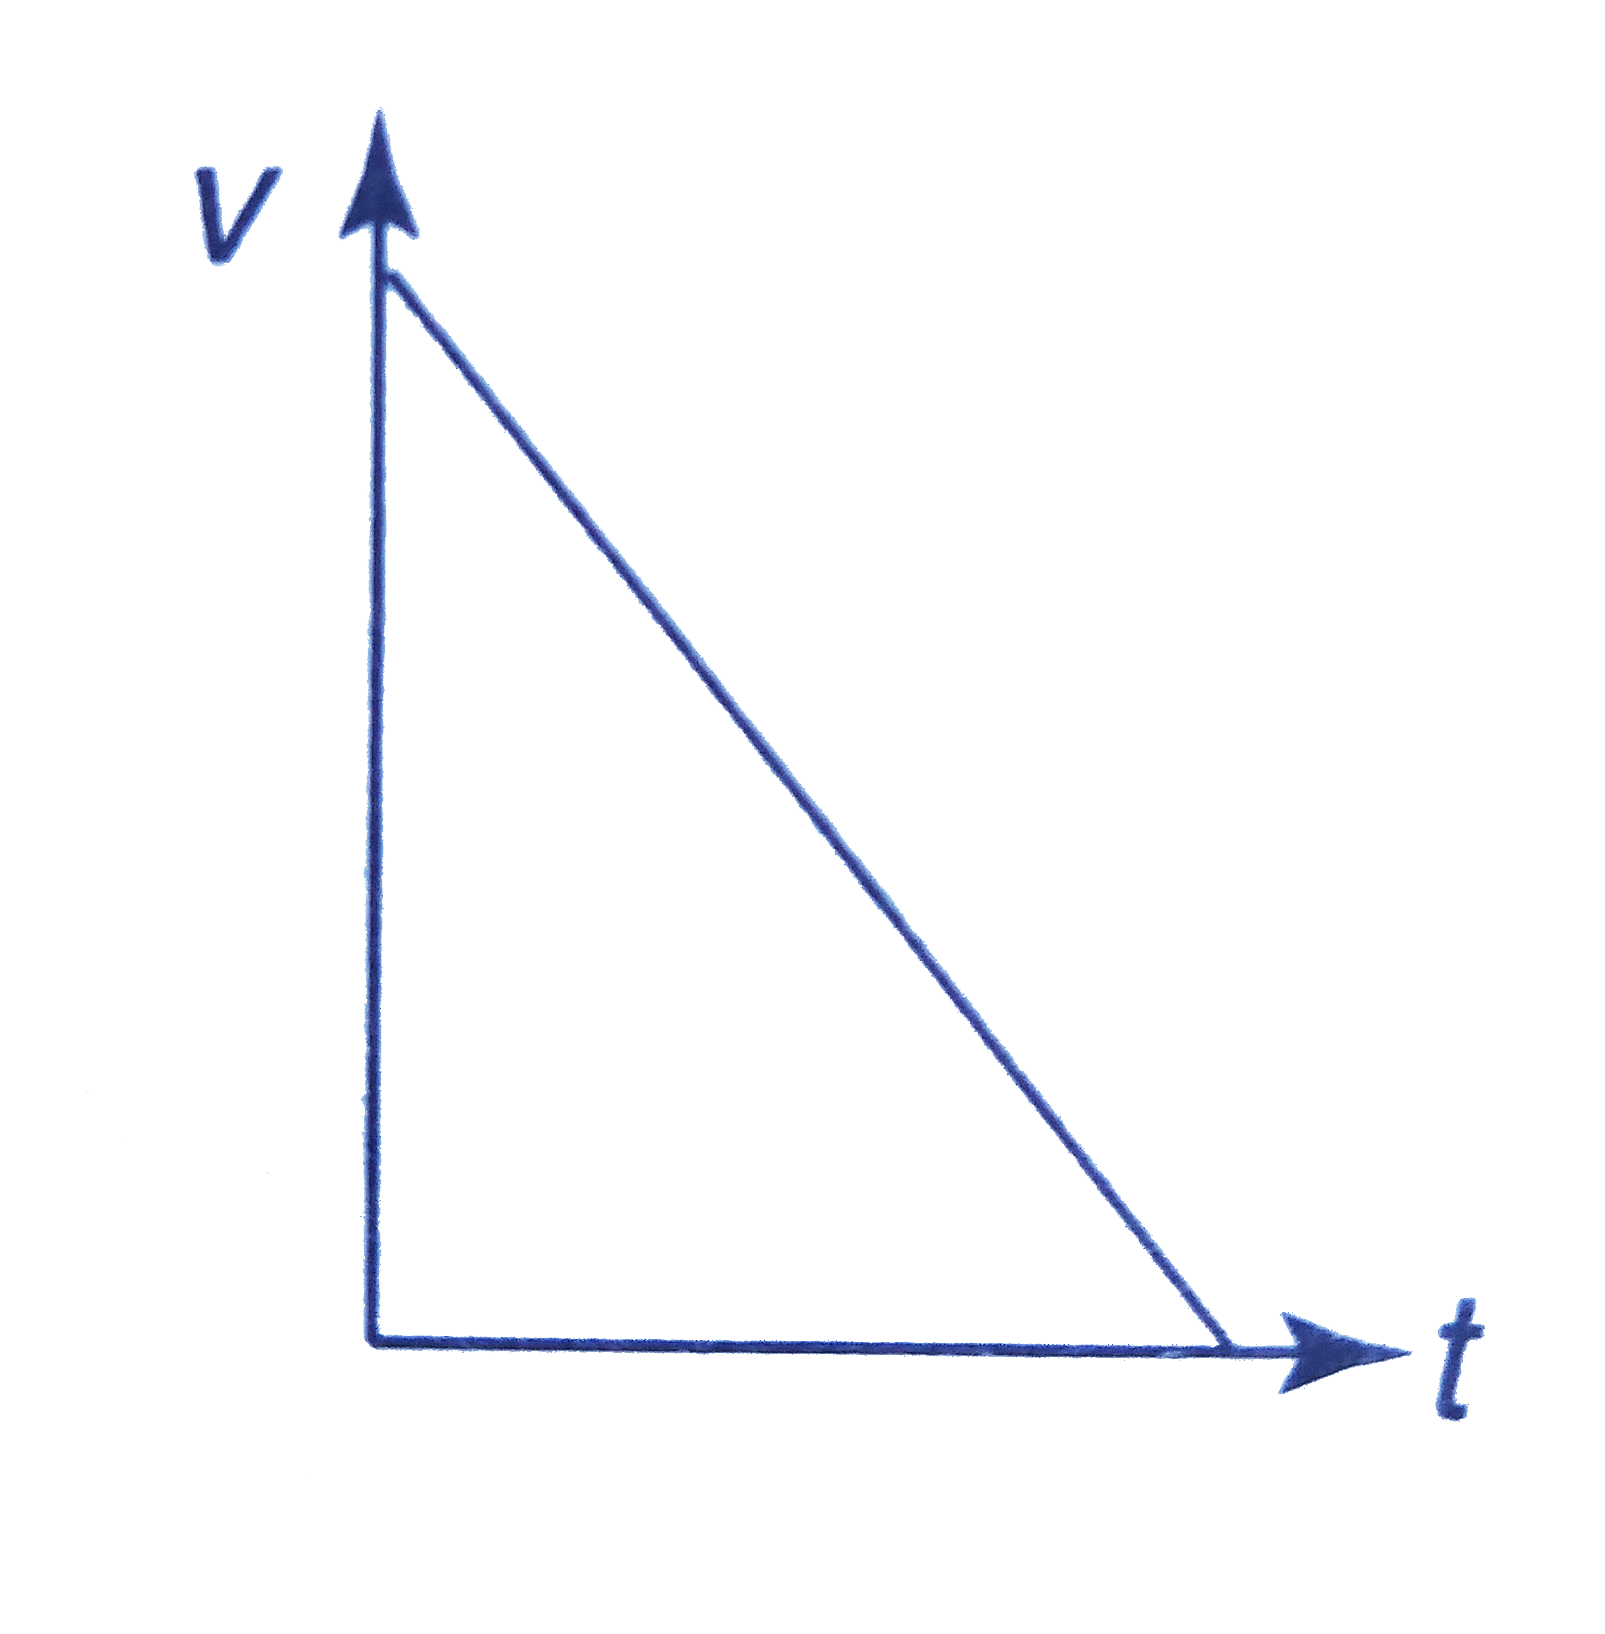
View SolutionFigure gives the velocity-time graph. This shows that the body is.
View Solution(a) The velocity time graph of two bodies are shown in Figure. Slope of the graph for body A is positive. What does it signify ?
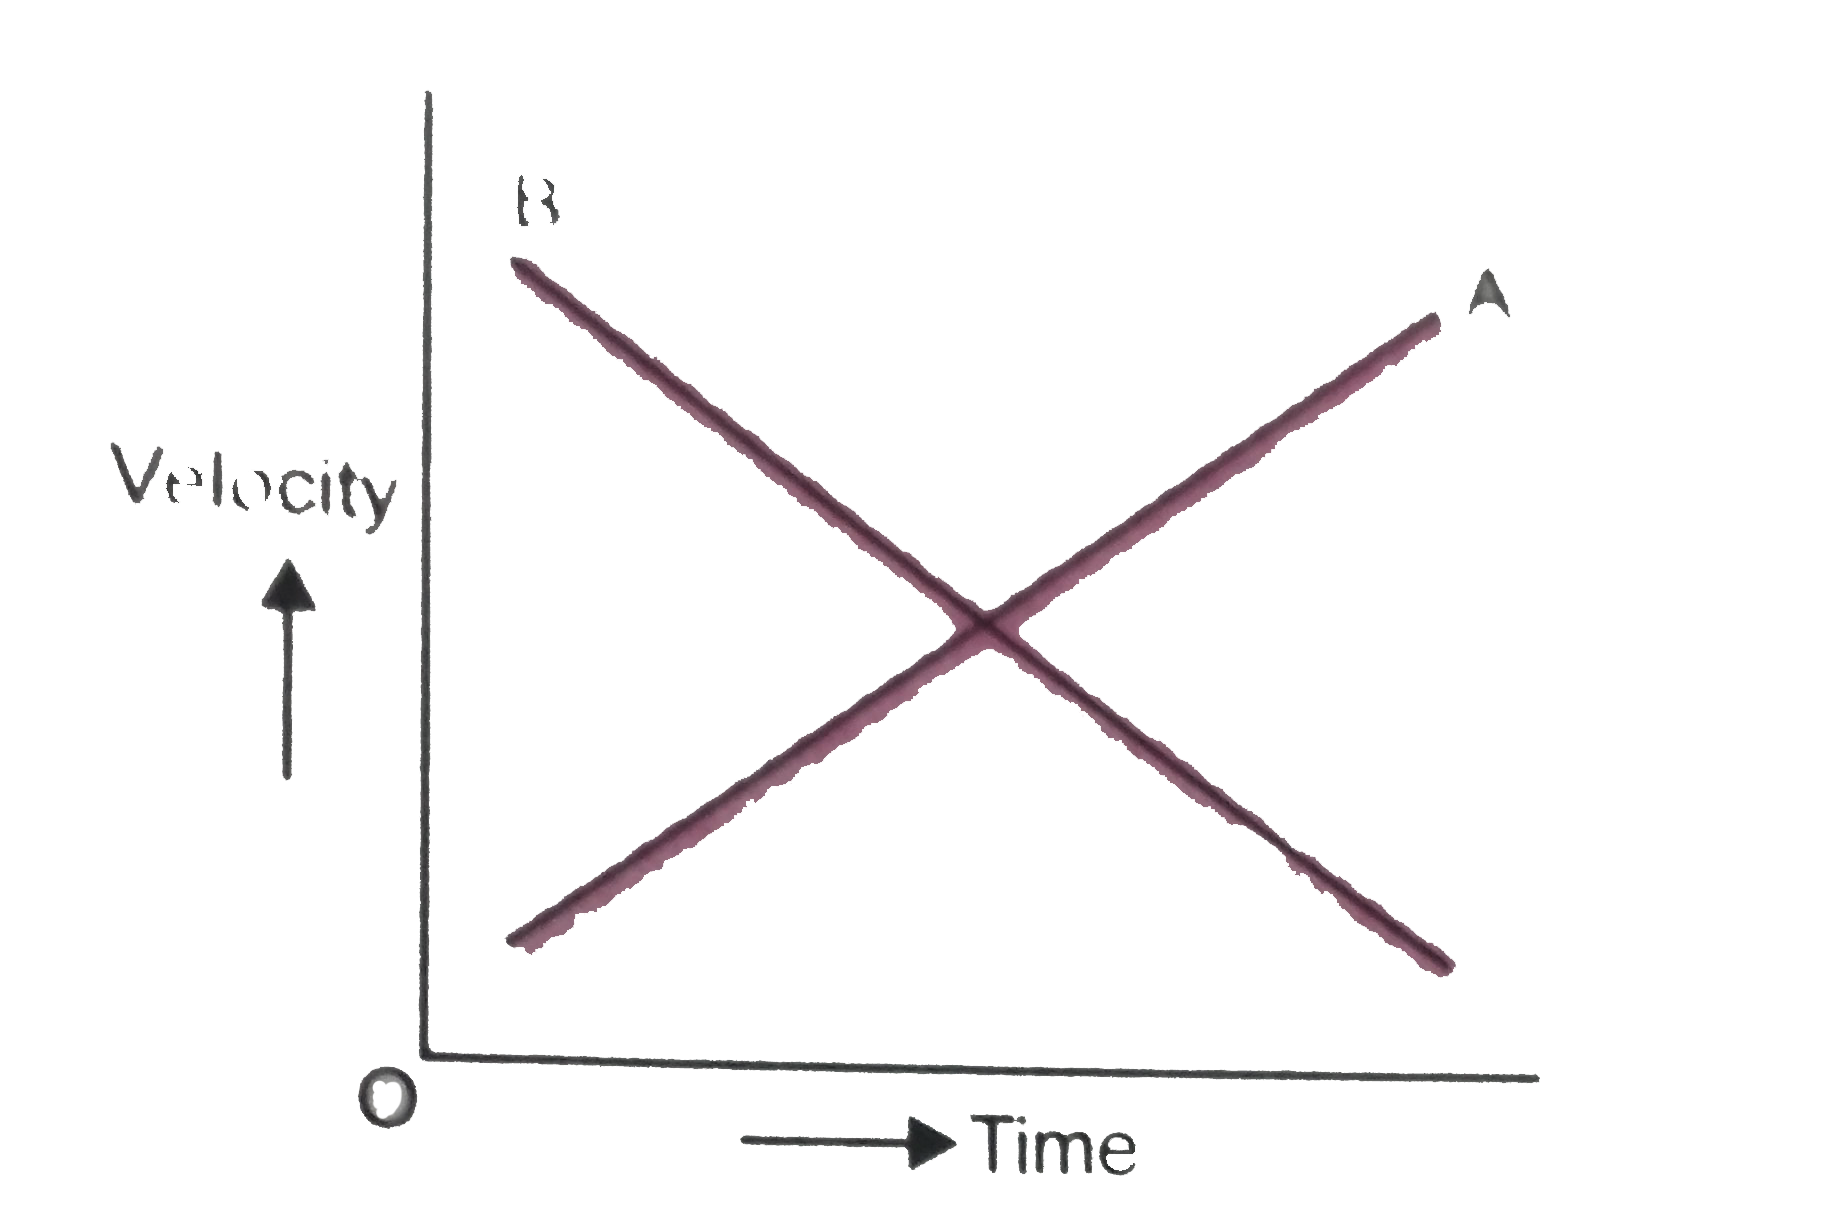
(b) The slope of velocity time graph of body B is negative. What does it represent ?
View SolutionThe graph below shws the velocity versus time graph for a body
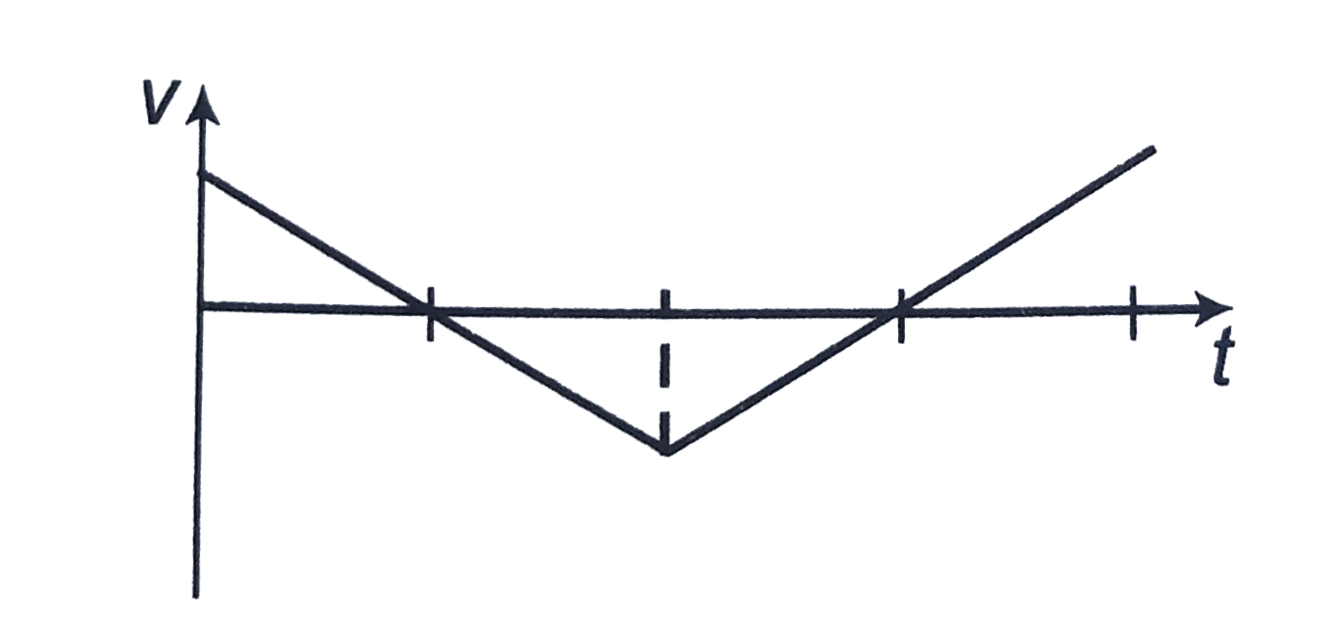
Which of the following graph represents the corresponding acceleration v//s time graph?
View SolutionFigure shows position-time graph of two cars A and B.
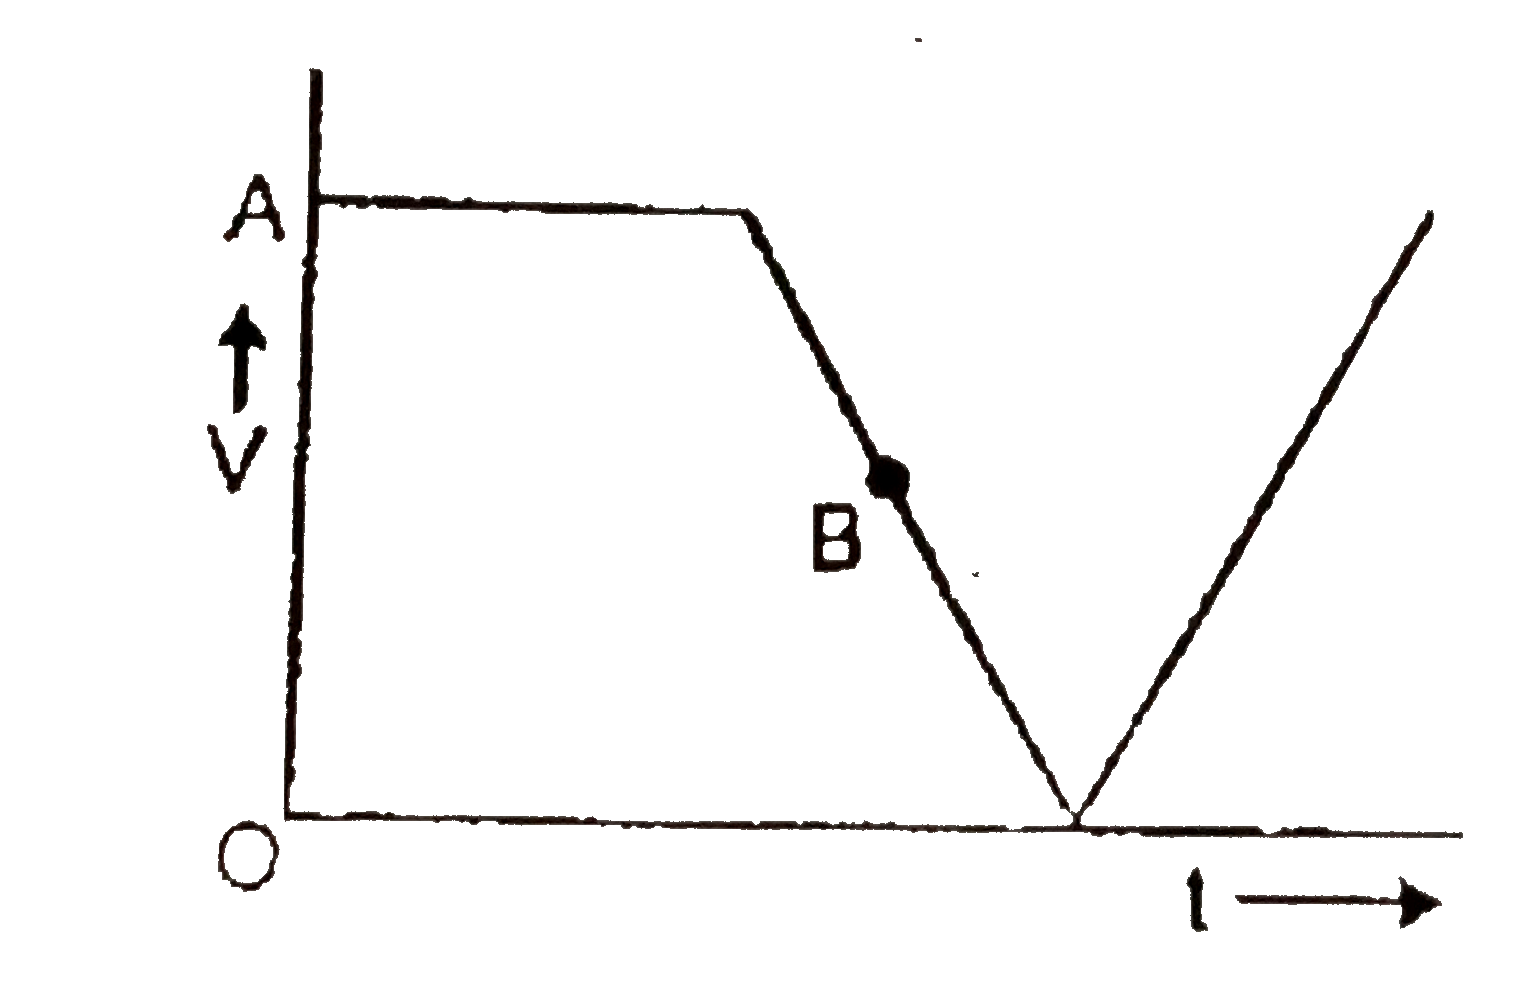
View SolutionThe following figure shows the velocity time graph of a body. According to this at the point B-
View SolutionDraw position vs time graph of uniform velocity.
View SolutionThe graph in figure shows the velocity v versus time t for a body. Which of the graphs shown in figure represents the correesponding acceleration versus time graphs ?
View SolutionDraw areal velocity versus time graph for mars.
View SolutionDraw the position-time graph for an object in uniform motion. Show that the slope of the position-time graph gives the velocity of the object.
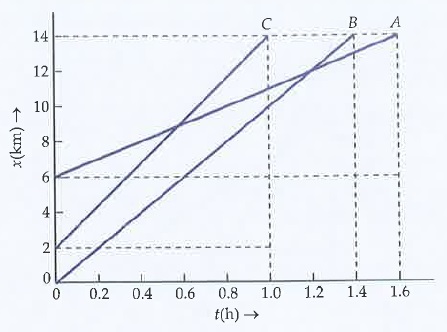
View SolutionFigure 3.64 shows the position-time graphs of three car A, B and C. On the basis of the graphs, answer the following questions : When A passes C, where is B ?
View SolutionFigure 3.64 shows the position-time graphs of three car A, B and C. On the basis of the graphs, answer the following questions : How far did car A travel between the time it passed cars B and C ?
View SolutionFigure shows the position-time graphs of three car A, B and C. On the basis of the graphs, answer the following questions : What is the relative velocity of car B with respect to car C ?
View SolutionCompletion type Question : The slope of position-time graph at any point gives ………. While the slope of velocity-time graph gives …………
View Solution
