Interpret the following figure which shows position of bodies A and B at different isntants of time. Graph of position versus time and give answers of the following questions:
 Who will cover a distance of 180 m first?Solution in Punjabi
Step by step video & image solution for Interpret the following figure which shows position of bodies A and B at different isntants of time. Graph of position versus time and give answers of the following questions: Who will cover a distance of 180 m first? by Physics experts to help you in doubts & scoring excellent marks in Class 9 exams.
Updated on:21/07/2023Topper's Solved these Questions
Similar Questions
Let a car stawrt from I (initial position) and move in a semi-circular path in clockwise direction and reach f (Final position) which is diametrically opposite to i. Distance = πr Displacement = 2r
View SolutionA particle is thrown up vertically with a velocity of 50 m/s. What will be its velocity at the highest point of its journey?
View SolutionIn which of the three media, air, water or iron sound travel the fastest at a particular temperature ?
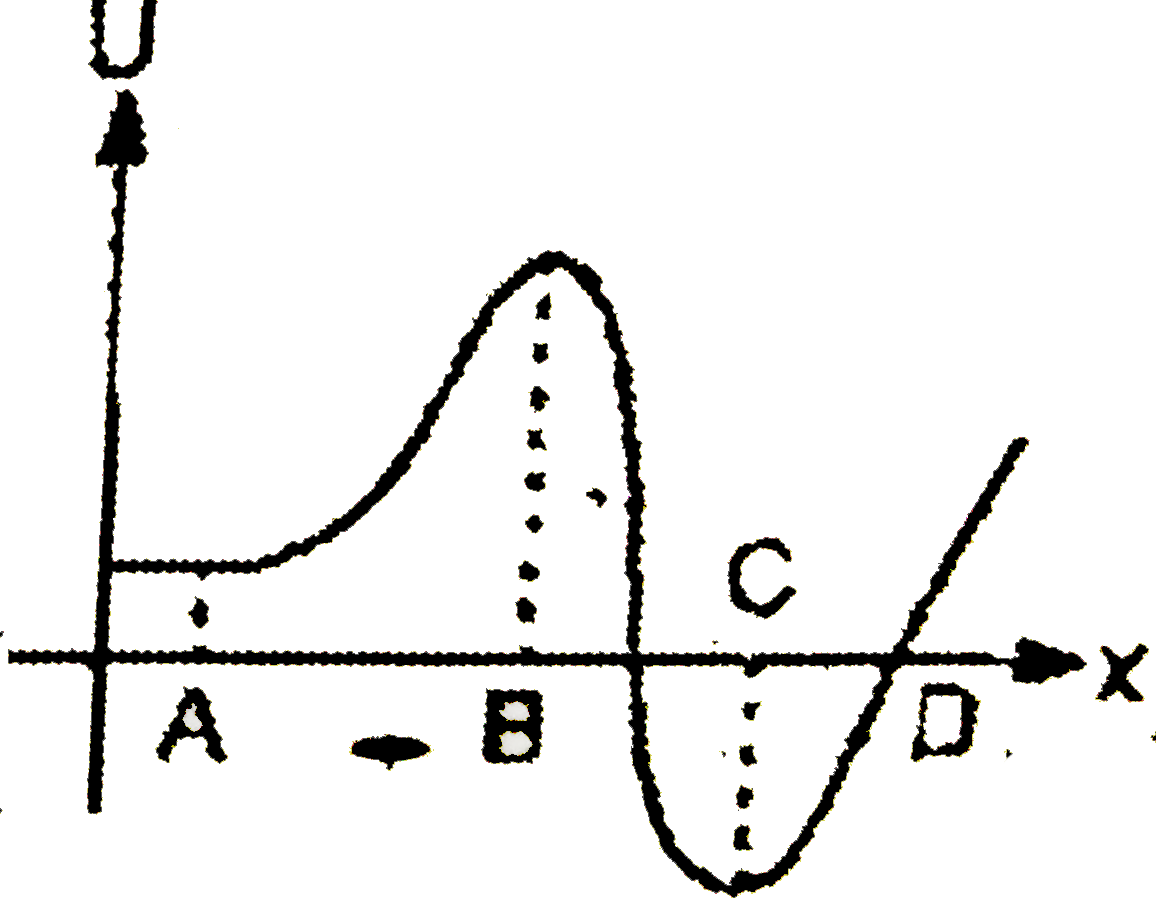
View SolutionThe following plot shows the variation of potential energy (U) of a system versus position (x). From the graph we can interpret that :
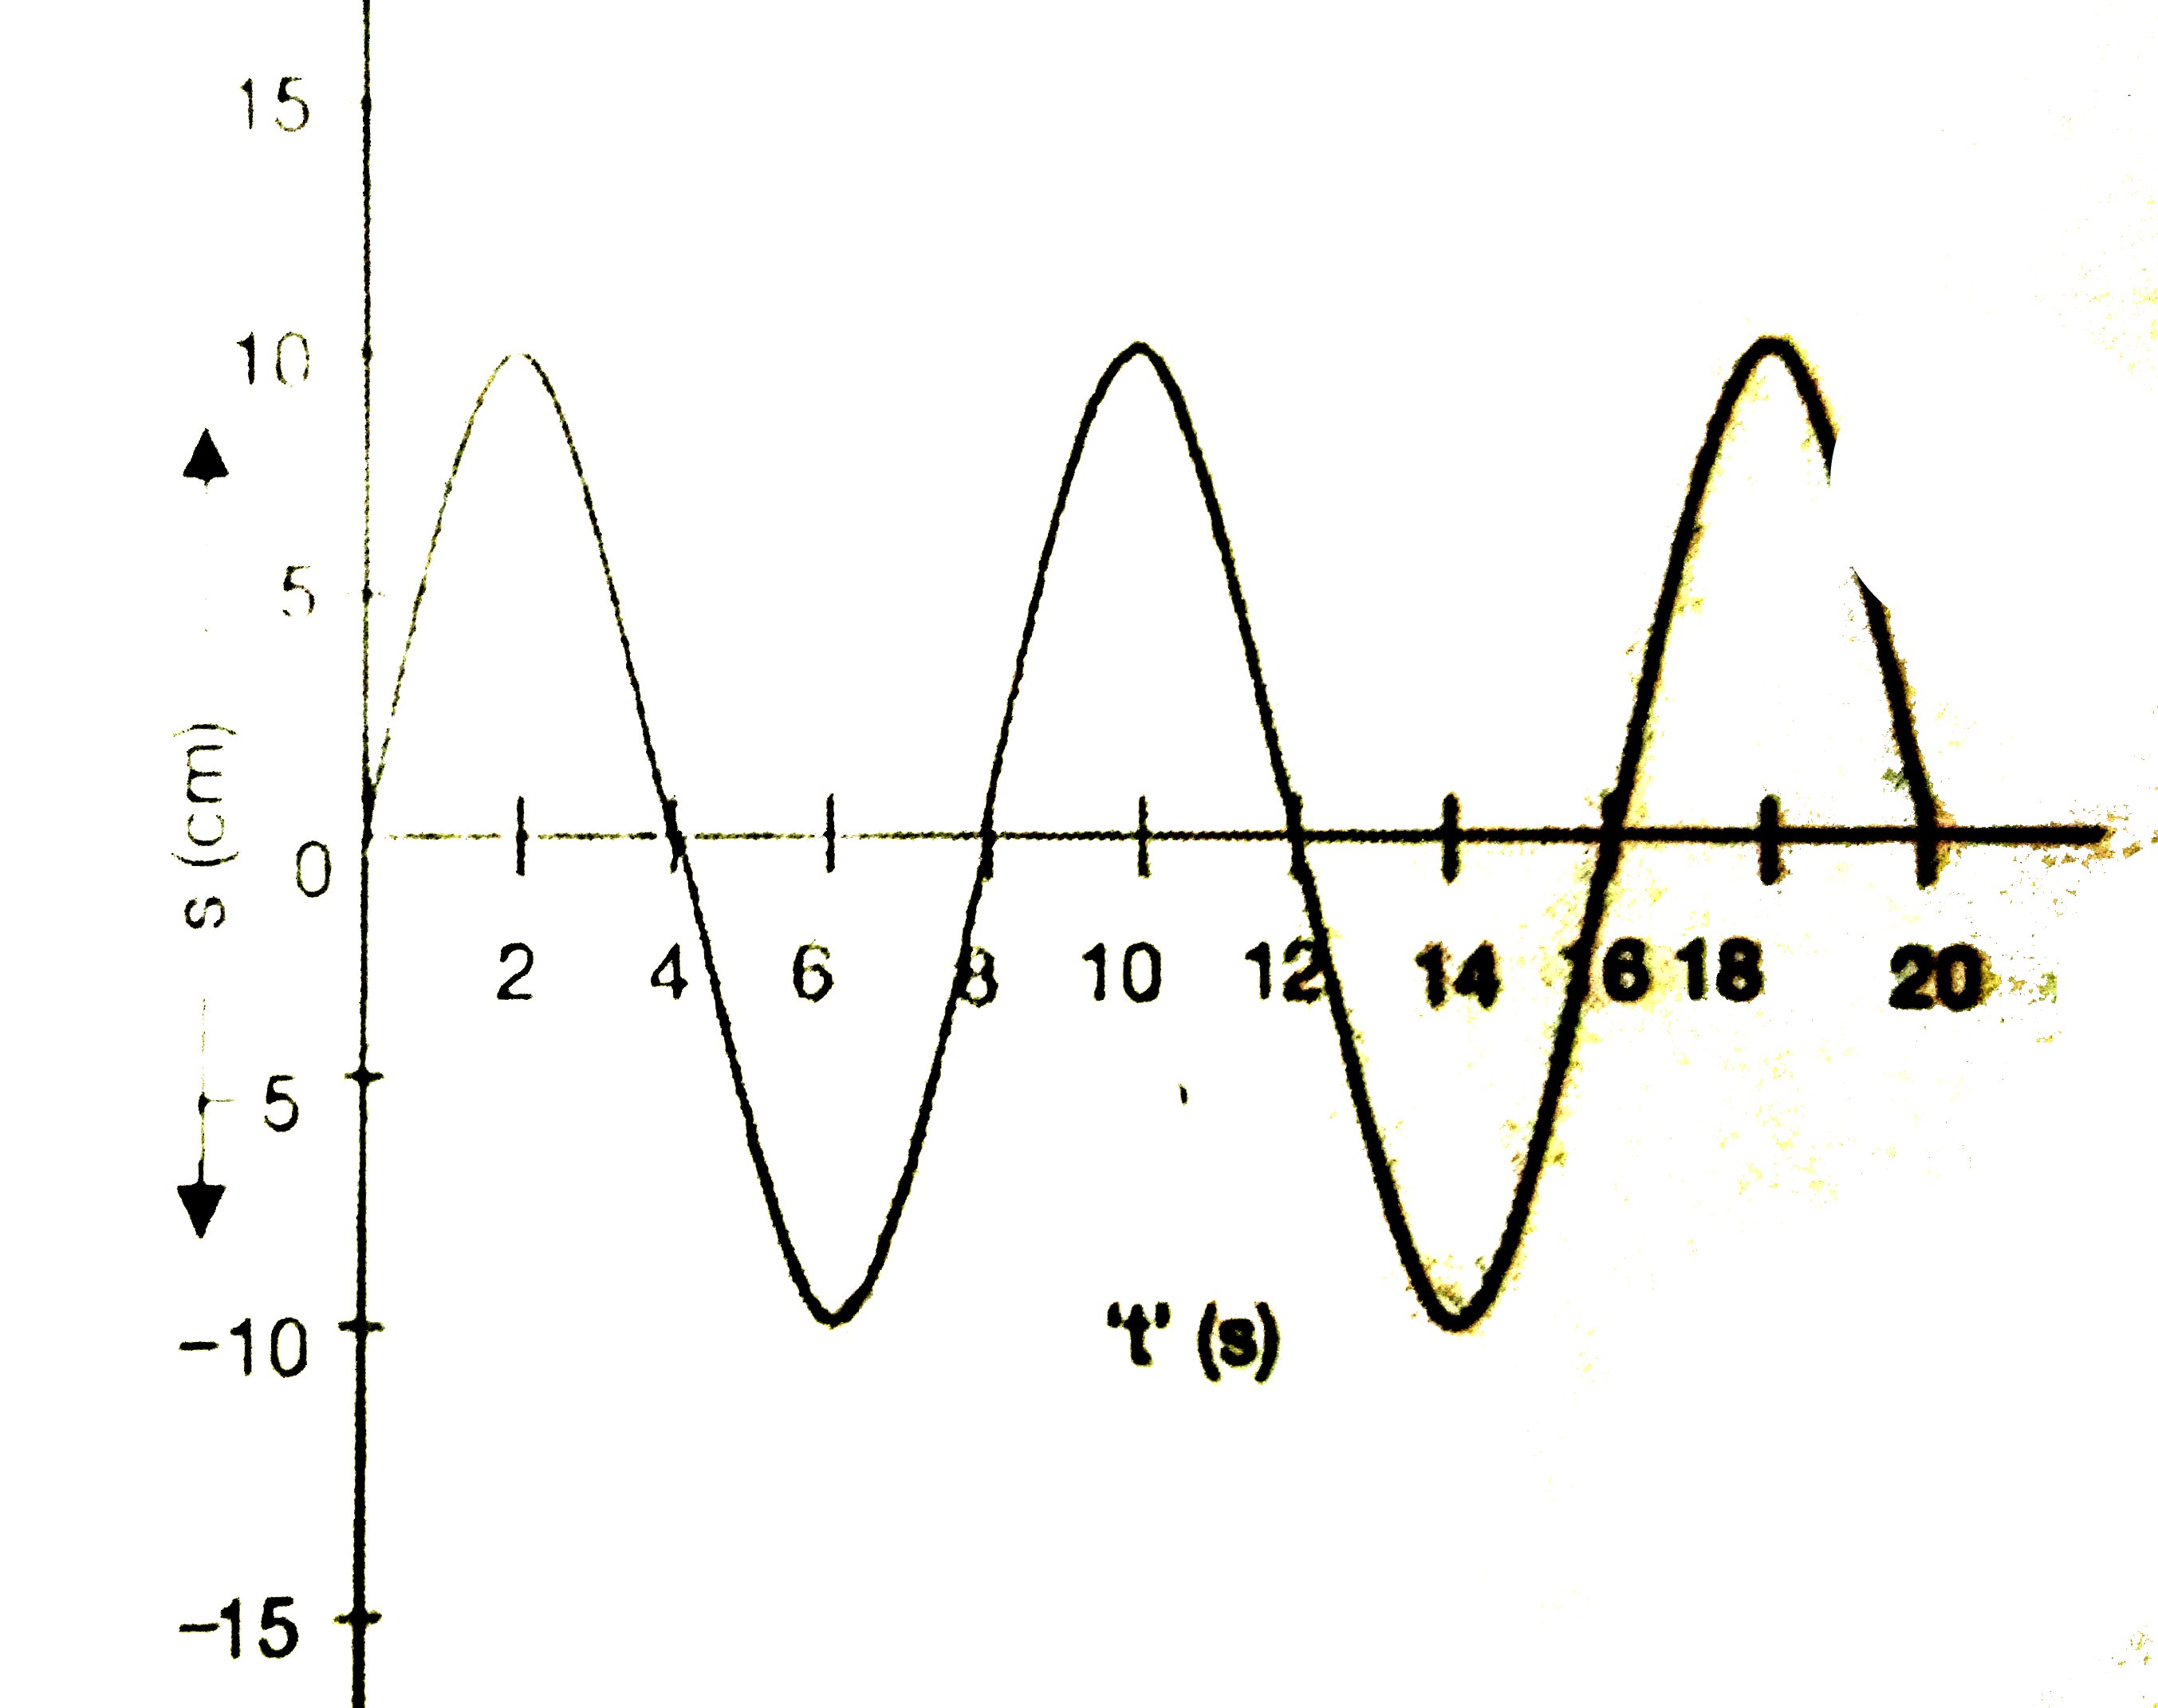
View SolutionThe following graph shows the displacement of the bob from its mean position versus time . The time period and the amplitude of the bob are :
View SolutionThe figure shows position time graph of two riders C and D. Based on the information represented by the graph, answer the following questions. At t = 0 s
View SolutionThe figure shows position time graph of two riders C and D. Based on the information represented by the graph, answer the following questions.
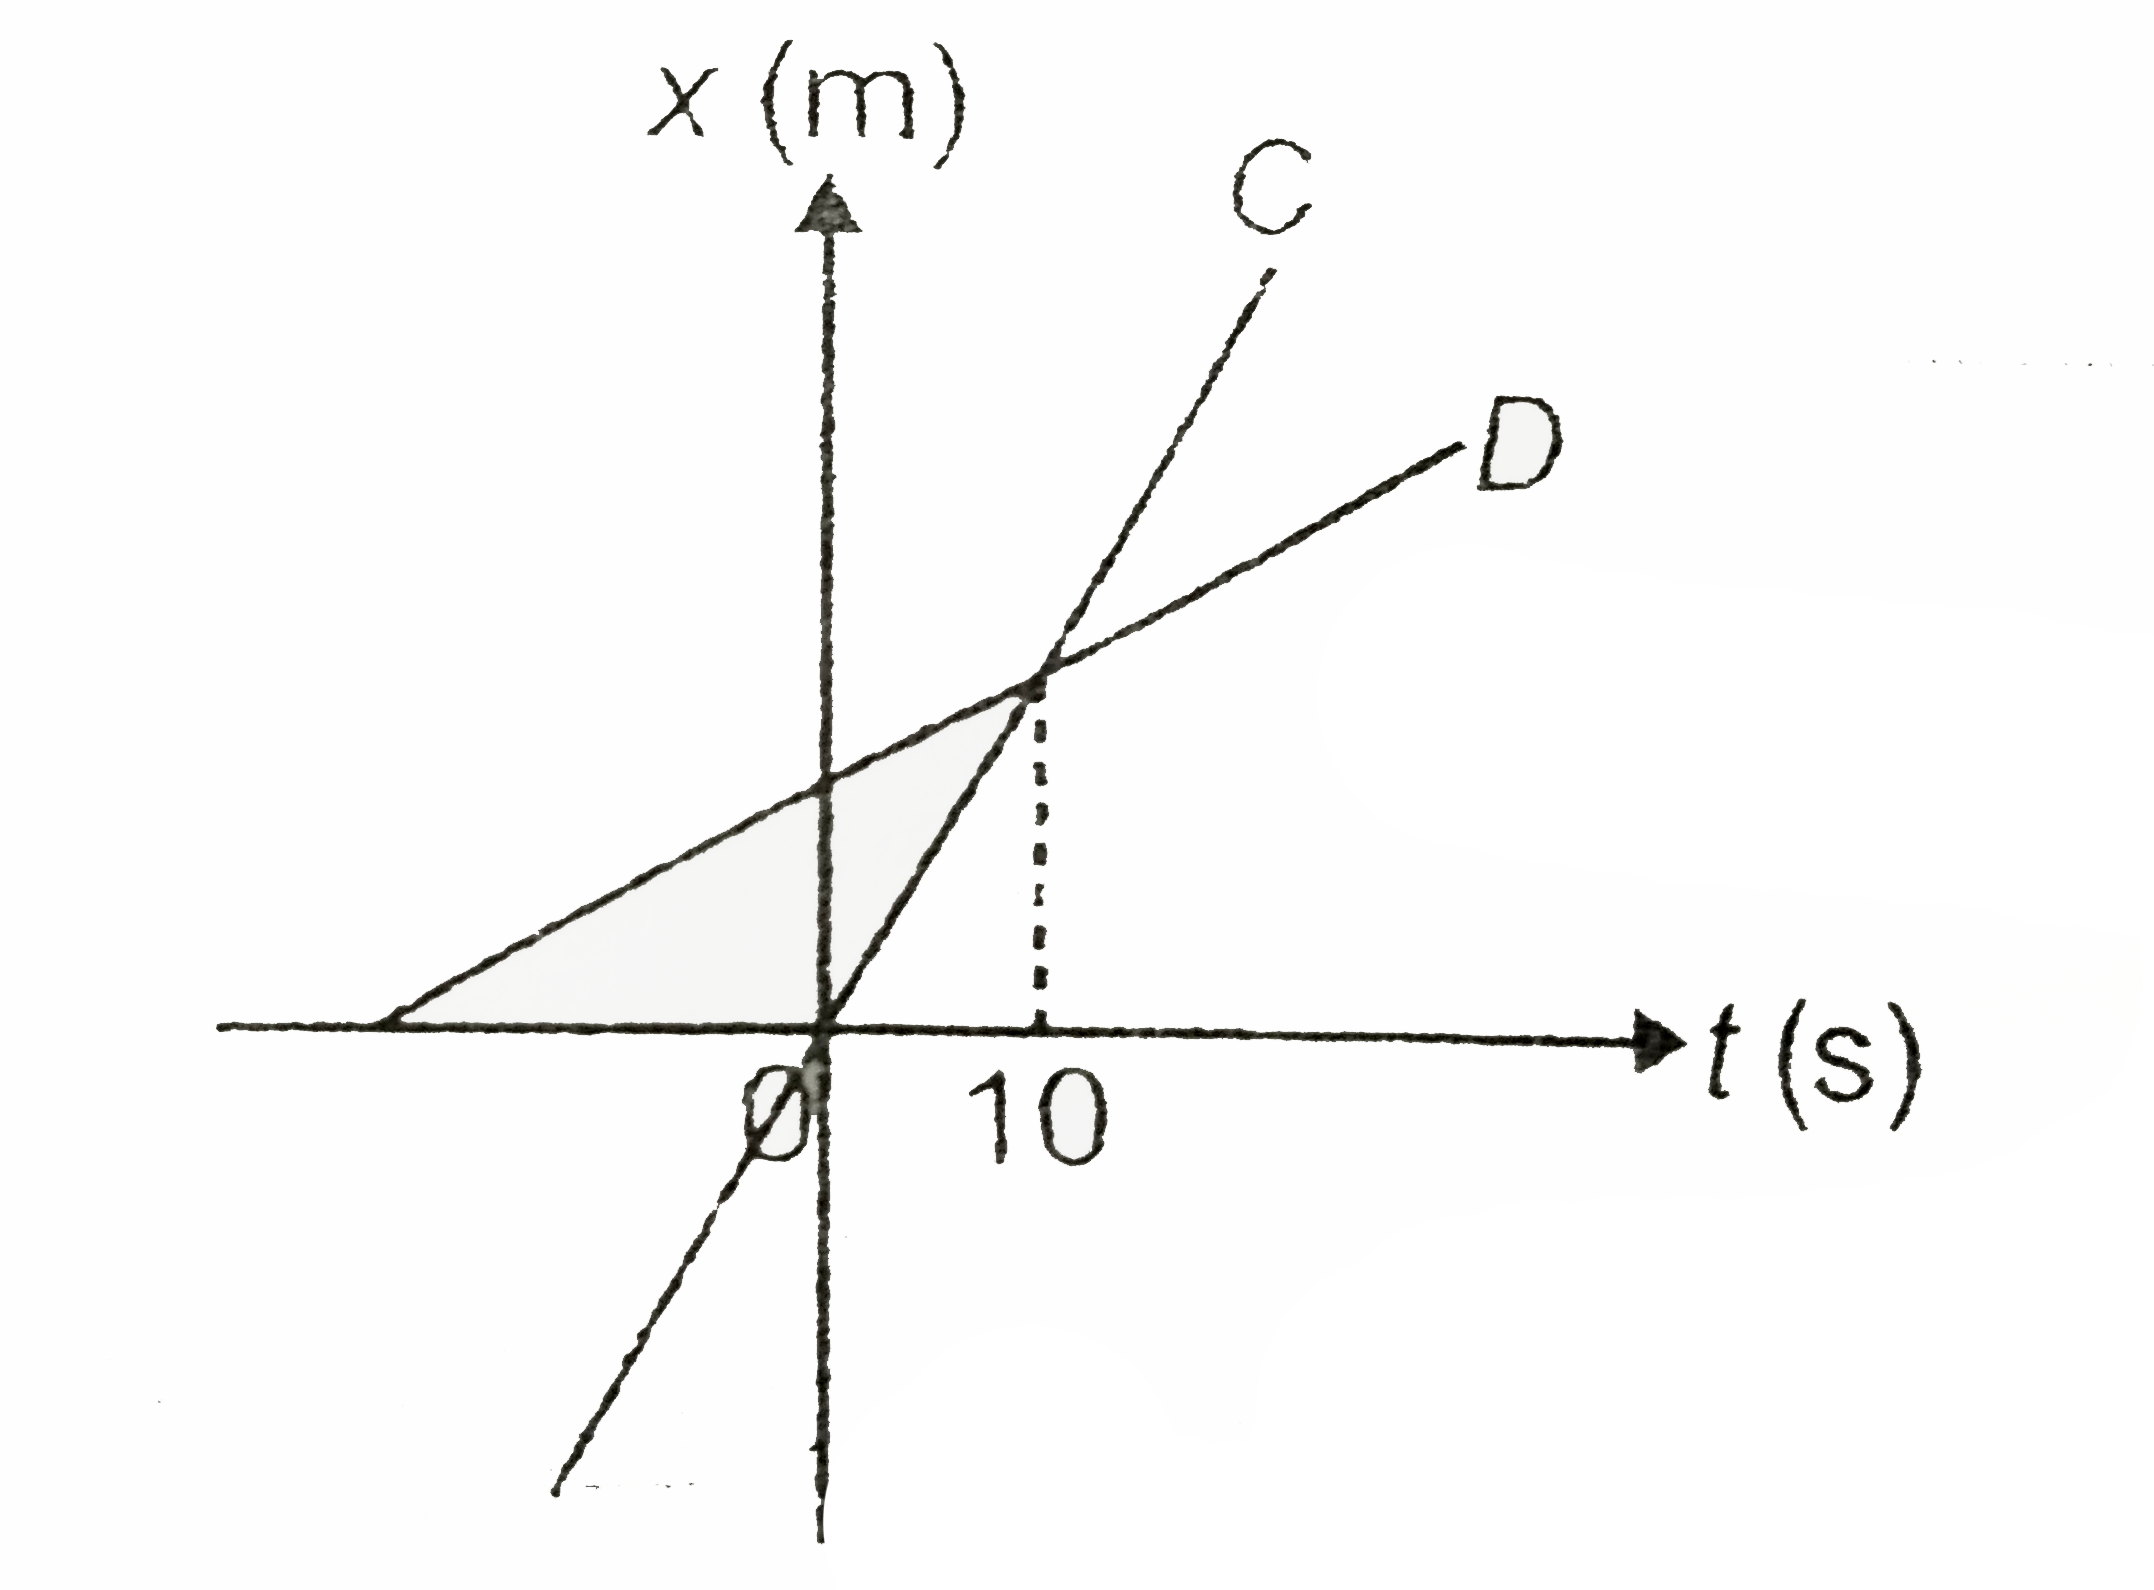
At t = 0 s
View SolutionThe figure shows position time graph of two riders C and D. Based on the information represented by the graph, answer the following questions.
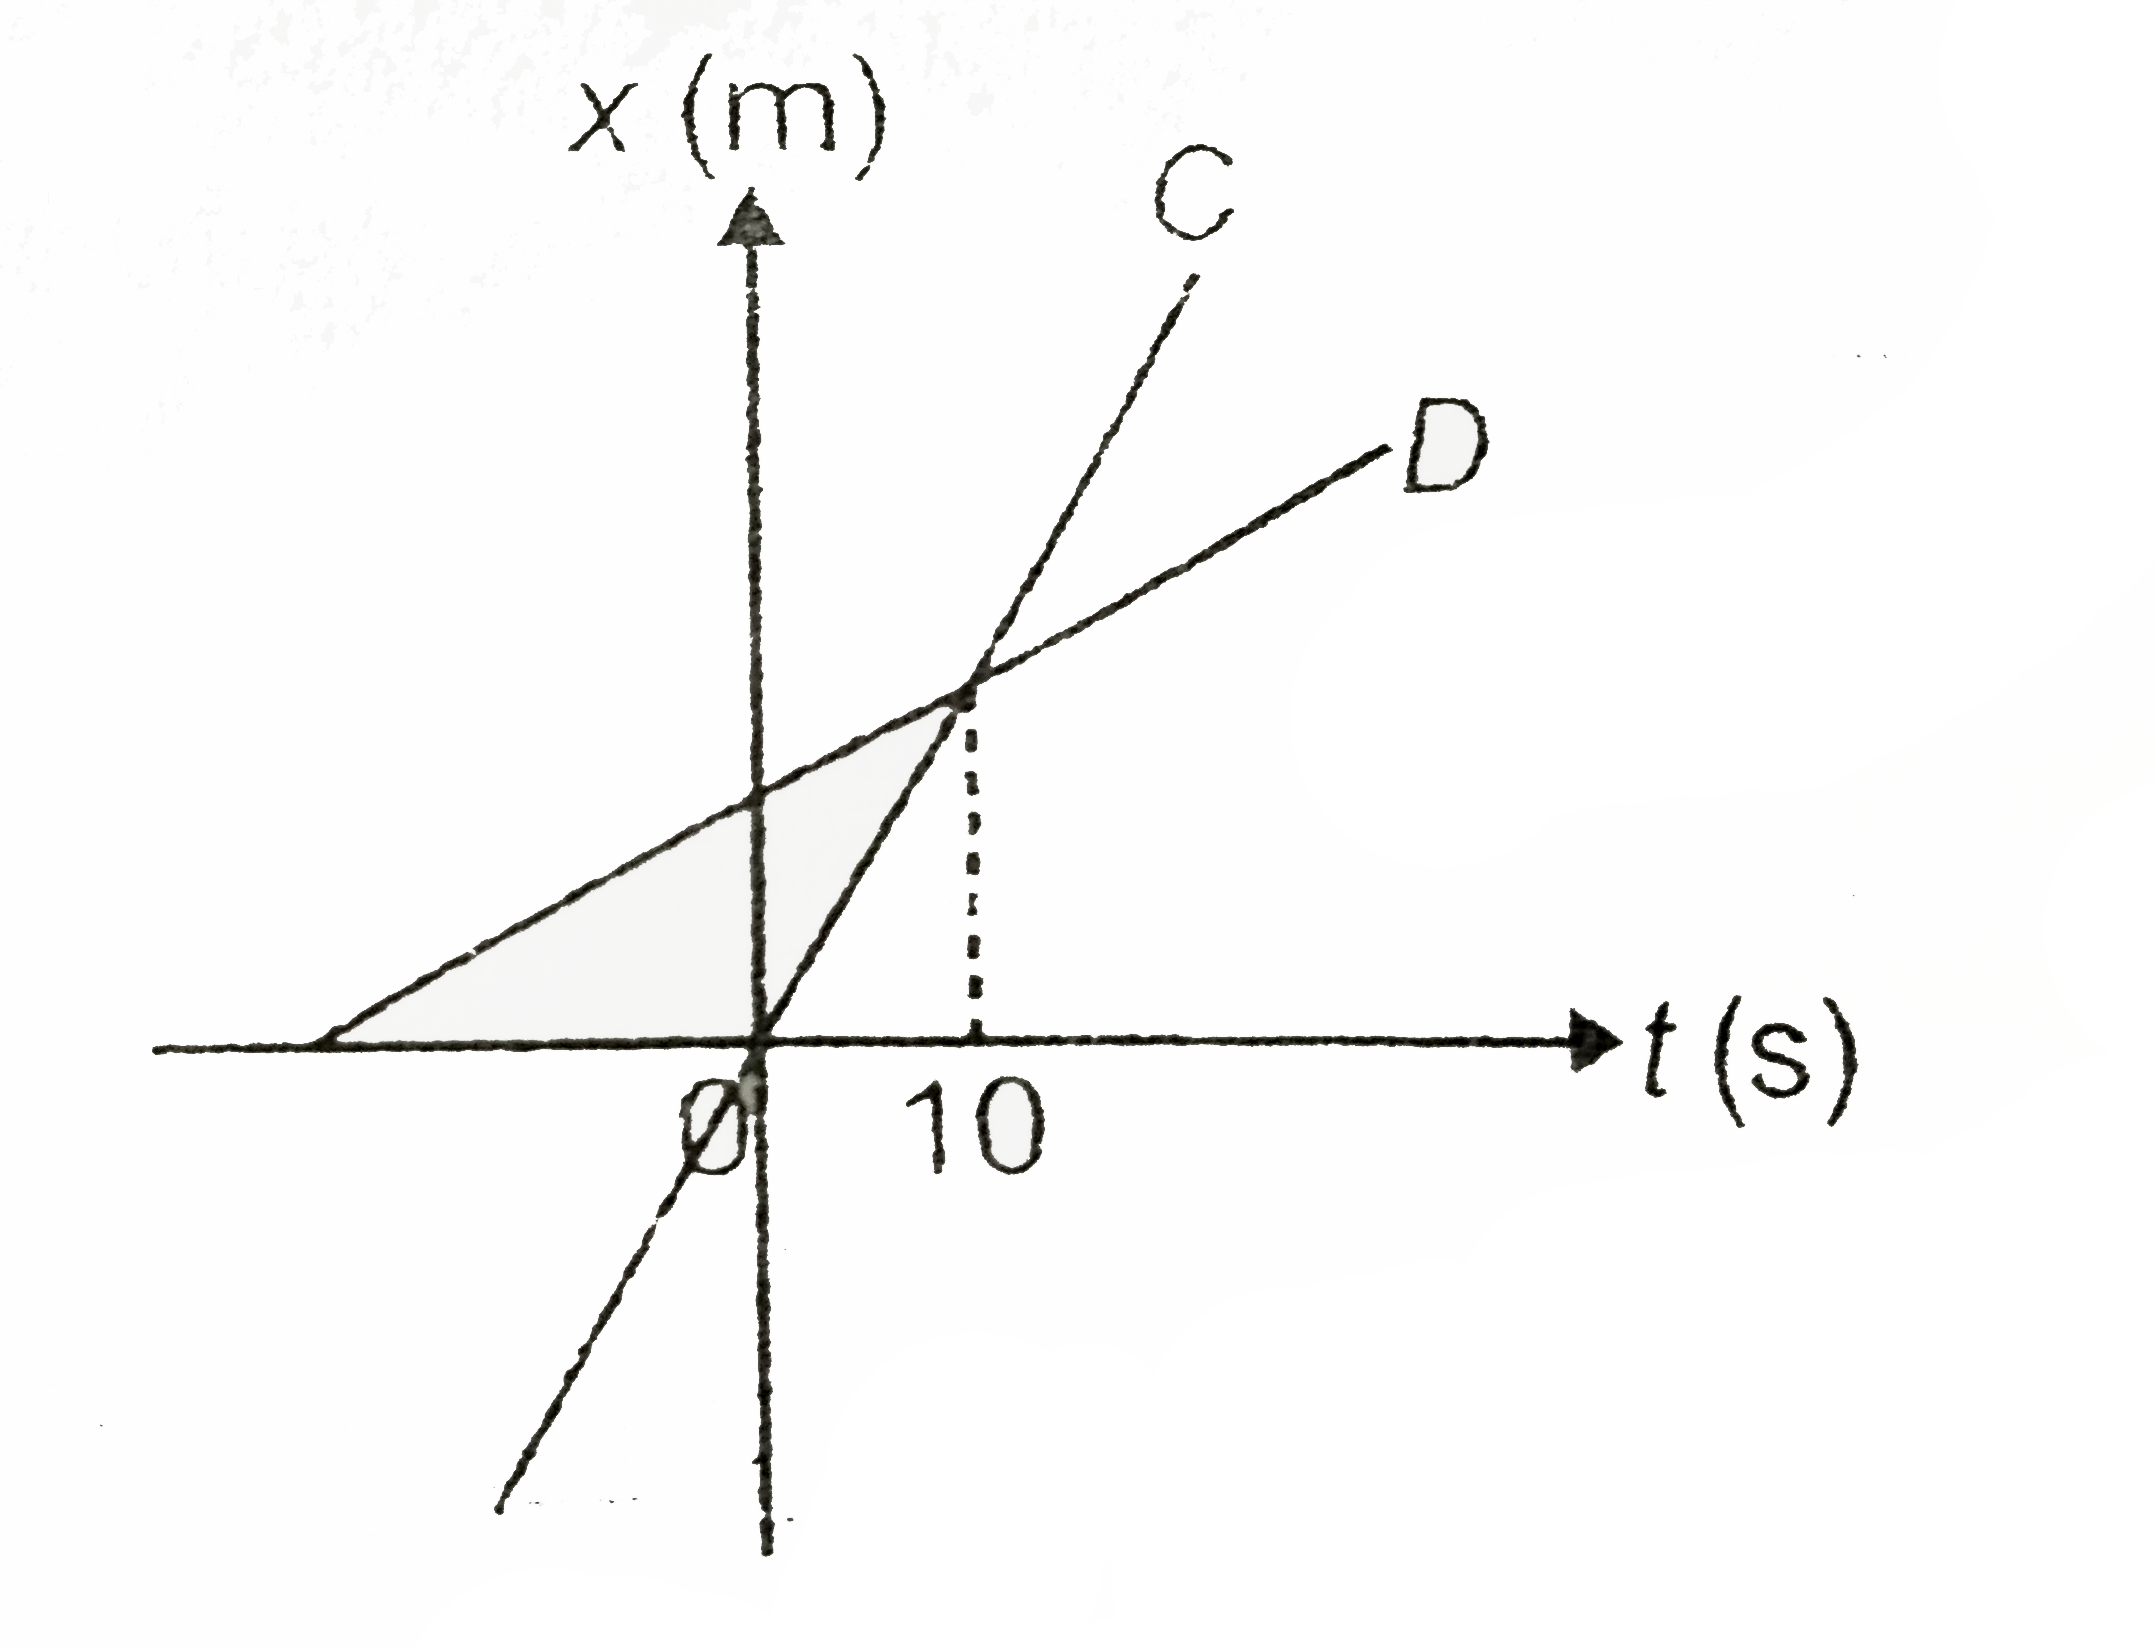
At t = 0 s
View SolutionThe figure shows position time graph of two riders C and D. Based on the information represented by the graph, answer the following questions. At t = 10 s
View SolutionThe graph in figure shows the velocity v versus time t for a body. Which of the graphs shown in figure represents the correesponding acceleration versus time graphs ?
View SolutionFigure 3.64 shows the position-time graphs of three car A, B and C. On the basis of the graphs, answer the following questions : When A passes C, where is B ?
View SolutionFigure 3.64 shows the position-time graphs of three car A, B and C. On the basis of the graphs, answer the following questions : How far did car A travel between the time it passed cars B and C ?
View Solution(a) The figure shows the position time graph of a body moving along a straight line.
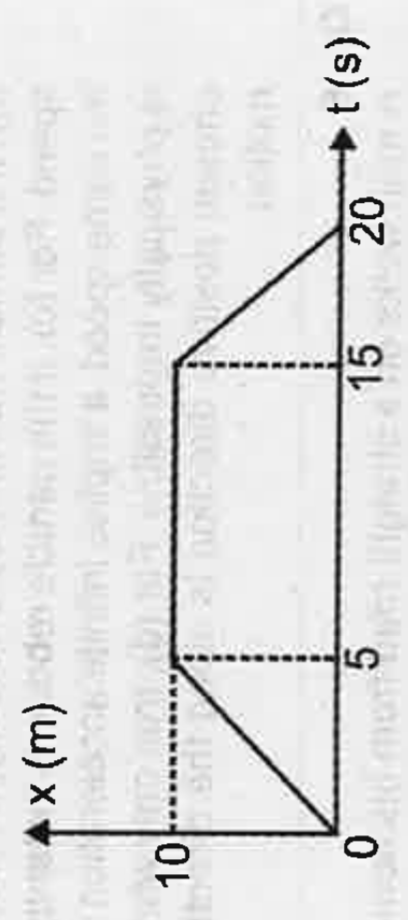
i) Draw the velocity - time graph of the body.
View SolutionThe figure shows position time graph of two riders C and D. Based on the information represented by the graph, answer the following questions.
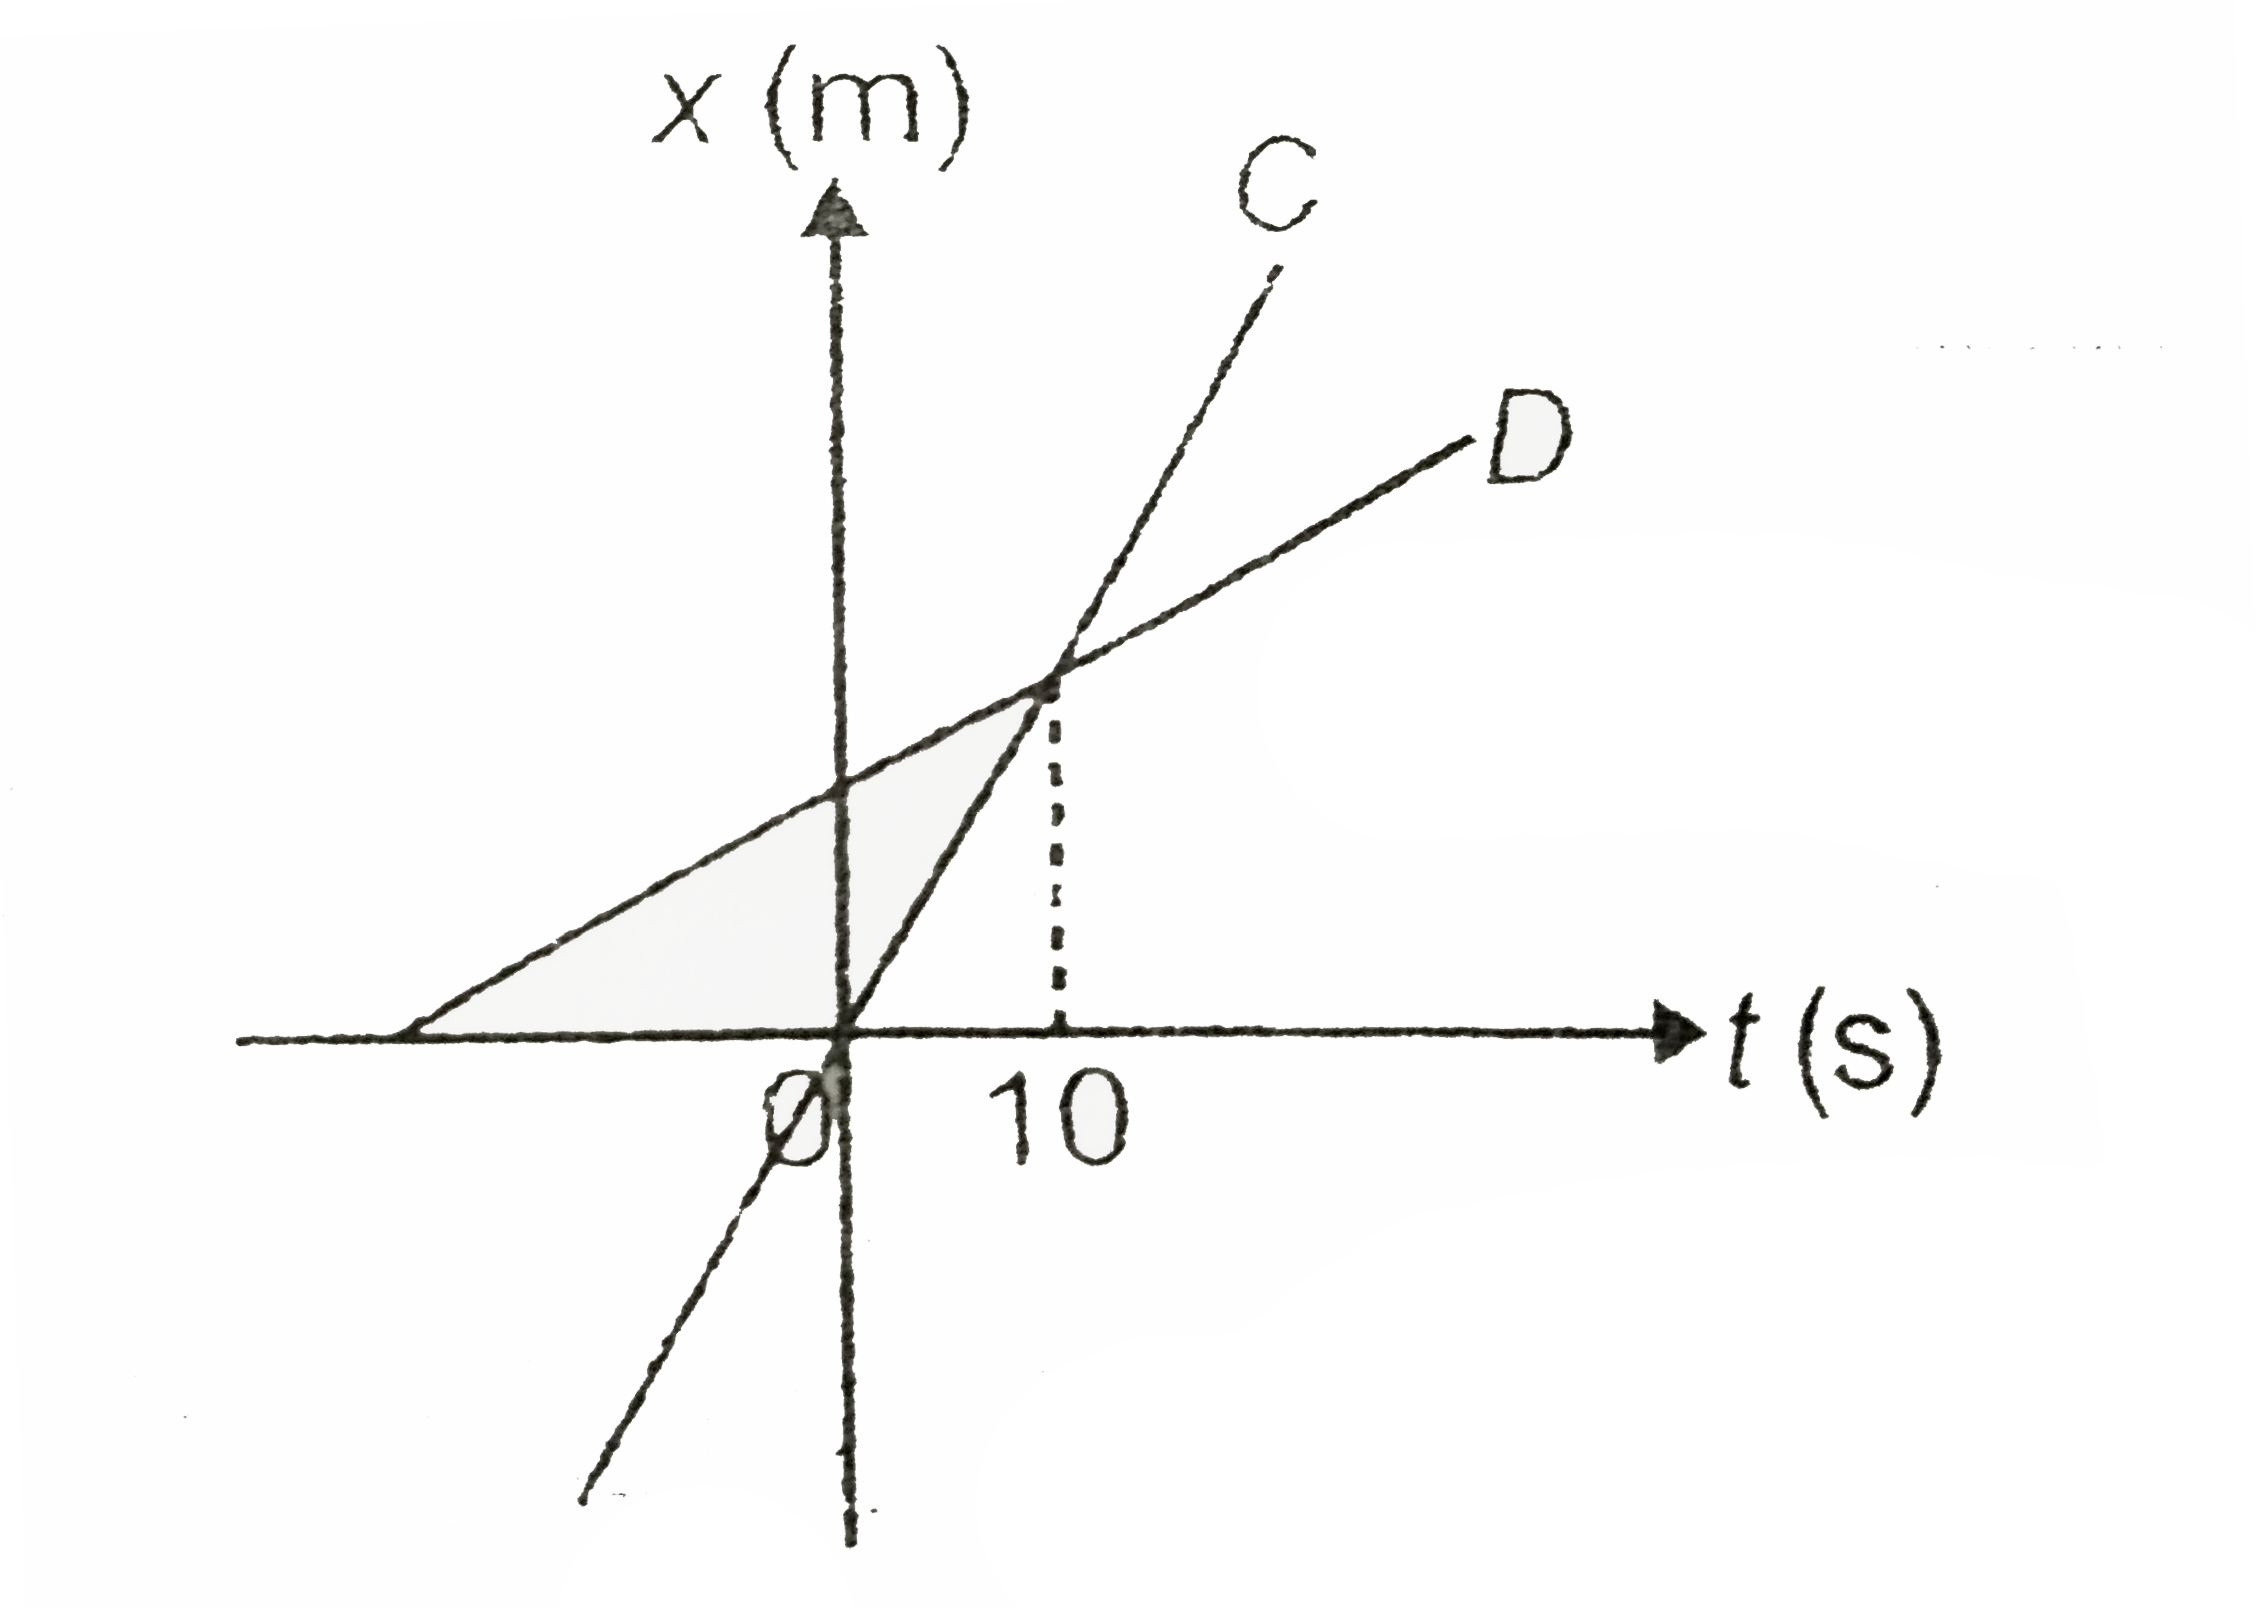
At t = 0 s
View SolutionThe figure shows position time graph of two riders C and D. Based on the information represented by the graph, answer the following questions.

At t = 0 s
View SolutionThe figure shows position time graph of two riders C and D. Based on the information represented by the graph, answer the following questions.

At t = 0 s
View Solution
