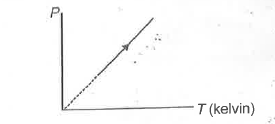
A graph is plotted by taking pressure along y-axis and centigrade temperature along X-axis for an ideal gas at constant volume. x intercept of the graph is
−273.15∘C
−273.15K
−273∘C
−273K
To find the x-intercept of the graph plotted with pressure (P) on the y-axis and centigrade temperature (T) on the x-axis for an ideal gas at constant volume, we can follow these steps:
1. Understand the Ideal Gas Law:
The ideal gas law is given by the equation:
PV=nRT
where P is the pressure, V is the volume, n is the number of moles, R is the ideal gas constant, and T is the absolute temperature in Kelvin.
2. Rearranging the Equation:
Since we are considering a constant volume process, we can express pressure P in terms of temperature T:
P=nRVT
Here, nRV is a constant because n, R, and V do not change.
3. Identify the X-Intercept:
The x-intercept of a graph occurs where the value of y (pressure P in this case) is equal to zero. Therefore, we set:
P=0
From the equation P=nRVT, if P=0, we have:
0=nRVT
This implies that T must also be zero.
4. Convert Temperature to Celsius:
The temperature T is in Kelvin. The relationship between Celsius and Kelvin is given by:
T(K)=T(°C)+273.15
Setting T(K)=0 gives:
0=T(°C)+273.15
Therefore, solving for T(°C):
T(°C)=−273.15
5. Conclusion:
The x-intercept of the graph, which corresponds to the temperature at which the pressure of the ideal gas is zero, is:
X-intercept=−273.15°C
Final Answer:
The x-intercept of the graph is −273.15°C.
The ideal gas law is given by the equation:
PV=nRT
where P is the pressure, V is the volume, n is the number of moles, R is the ideal gas constant, and T is the absolute temperature in Kelvin.
Since we are considering a constant volume process, we can express pressure P in terms of temperature T:
P=nRVT
Here, nRV is a constant because n, R, and V do not change.
The x-intercept of a graph occurs where the value of y (pressure P in this case) is equal to zero. Therefore, we set:
P=0
From the equation P=nRVT, if P=0, we have:
0=nRVT
This implies that T must also be zero.
The temperature T is in Kelvin. The relationship between Celsius and Kelvin is given by:
T(K)=T(°C)+273.15
Setting T(K)=0 gives:
0=T(°C)+273.15
Therefore, solving for T(°C):
T(°C)=−273.15
The x-intercept of the graph, which corresponds to the temperature at which the pressure of the ideal gas is zero, is:
X-intercept=−273.15°C
The x-intercept of the graph is −273.15°C.
Similar Questions
If a graph is plotted by taking spectral emissive power along y-axis and wavelength along X-axis then the area below the graph above wavelength axis is
View SolutionA graph is plotted with PV/T on y-axis and mass of the gas along x-axis for different gases. The graph is
View Solutiona graph between prssure P (along y-axis) and absolute temperature, T(along x-axis) for equal moles of two gases has been drawn . Given that volume of second gas is more than volume of first gas. Which of the following statement is correct?
View SolutionA graph is plotted between PVm along Y-axis and P along X-axis whre Vm is the molar volume of a real gas Find the intercept along Y-axis .
View SolutionA graph is plotted between PVm along y-axis and P along x-axis, where Vm is the molar volume of a real gas. Find the intercept .
View SolutionA graph is plotted between pressure and volume at different temperatures . On the basis of the graph what changes will you observe in the volume if
(i) the pressure is increased at constant temperature .
(ii) the temperature is decreased at constant pressure .

View SolutionThe graph of pressure and temperature for an ideal gas is as shown in figure. The given process is

View SolutionAt what centigrade temperature will the volume of a gas at 0∘C triple itself if the pressure remains constant ?
View SolutionAt what centigrade temperature will the volume of a gas at 0∘C triple itself if the pressure remains constant.
View SolutionPressure versus temperature graph of an ideal gas at constant volume V is shown by the straight line A. Now mass of the gas is doubled and the volume is halved, then the corresponding pressure versus temperature graph will be shown by the line

View Solution
