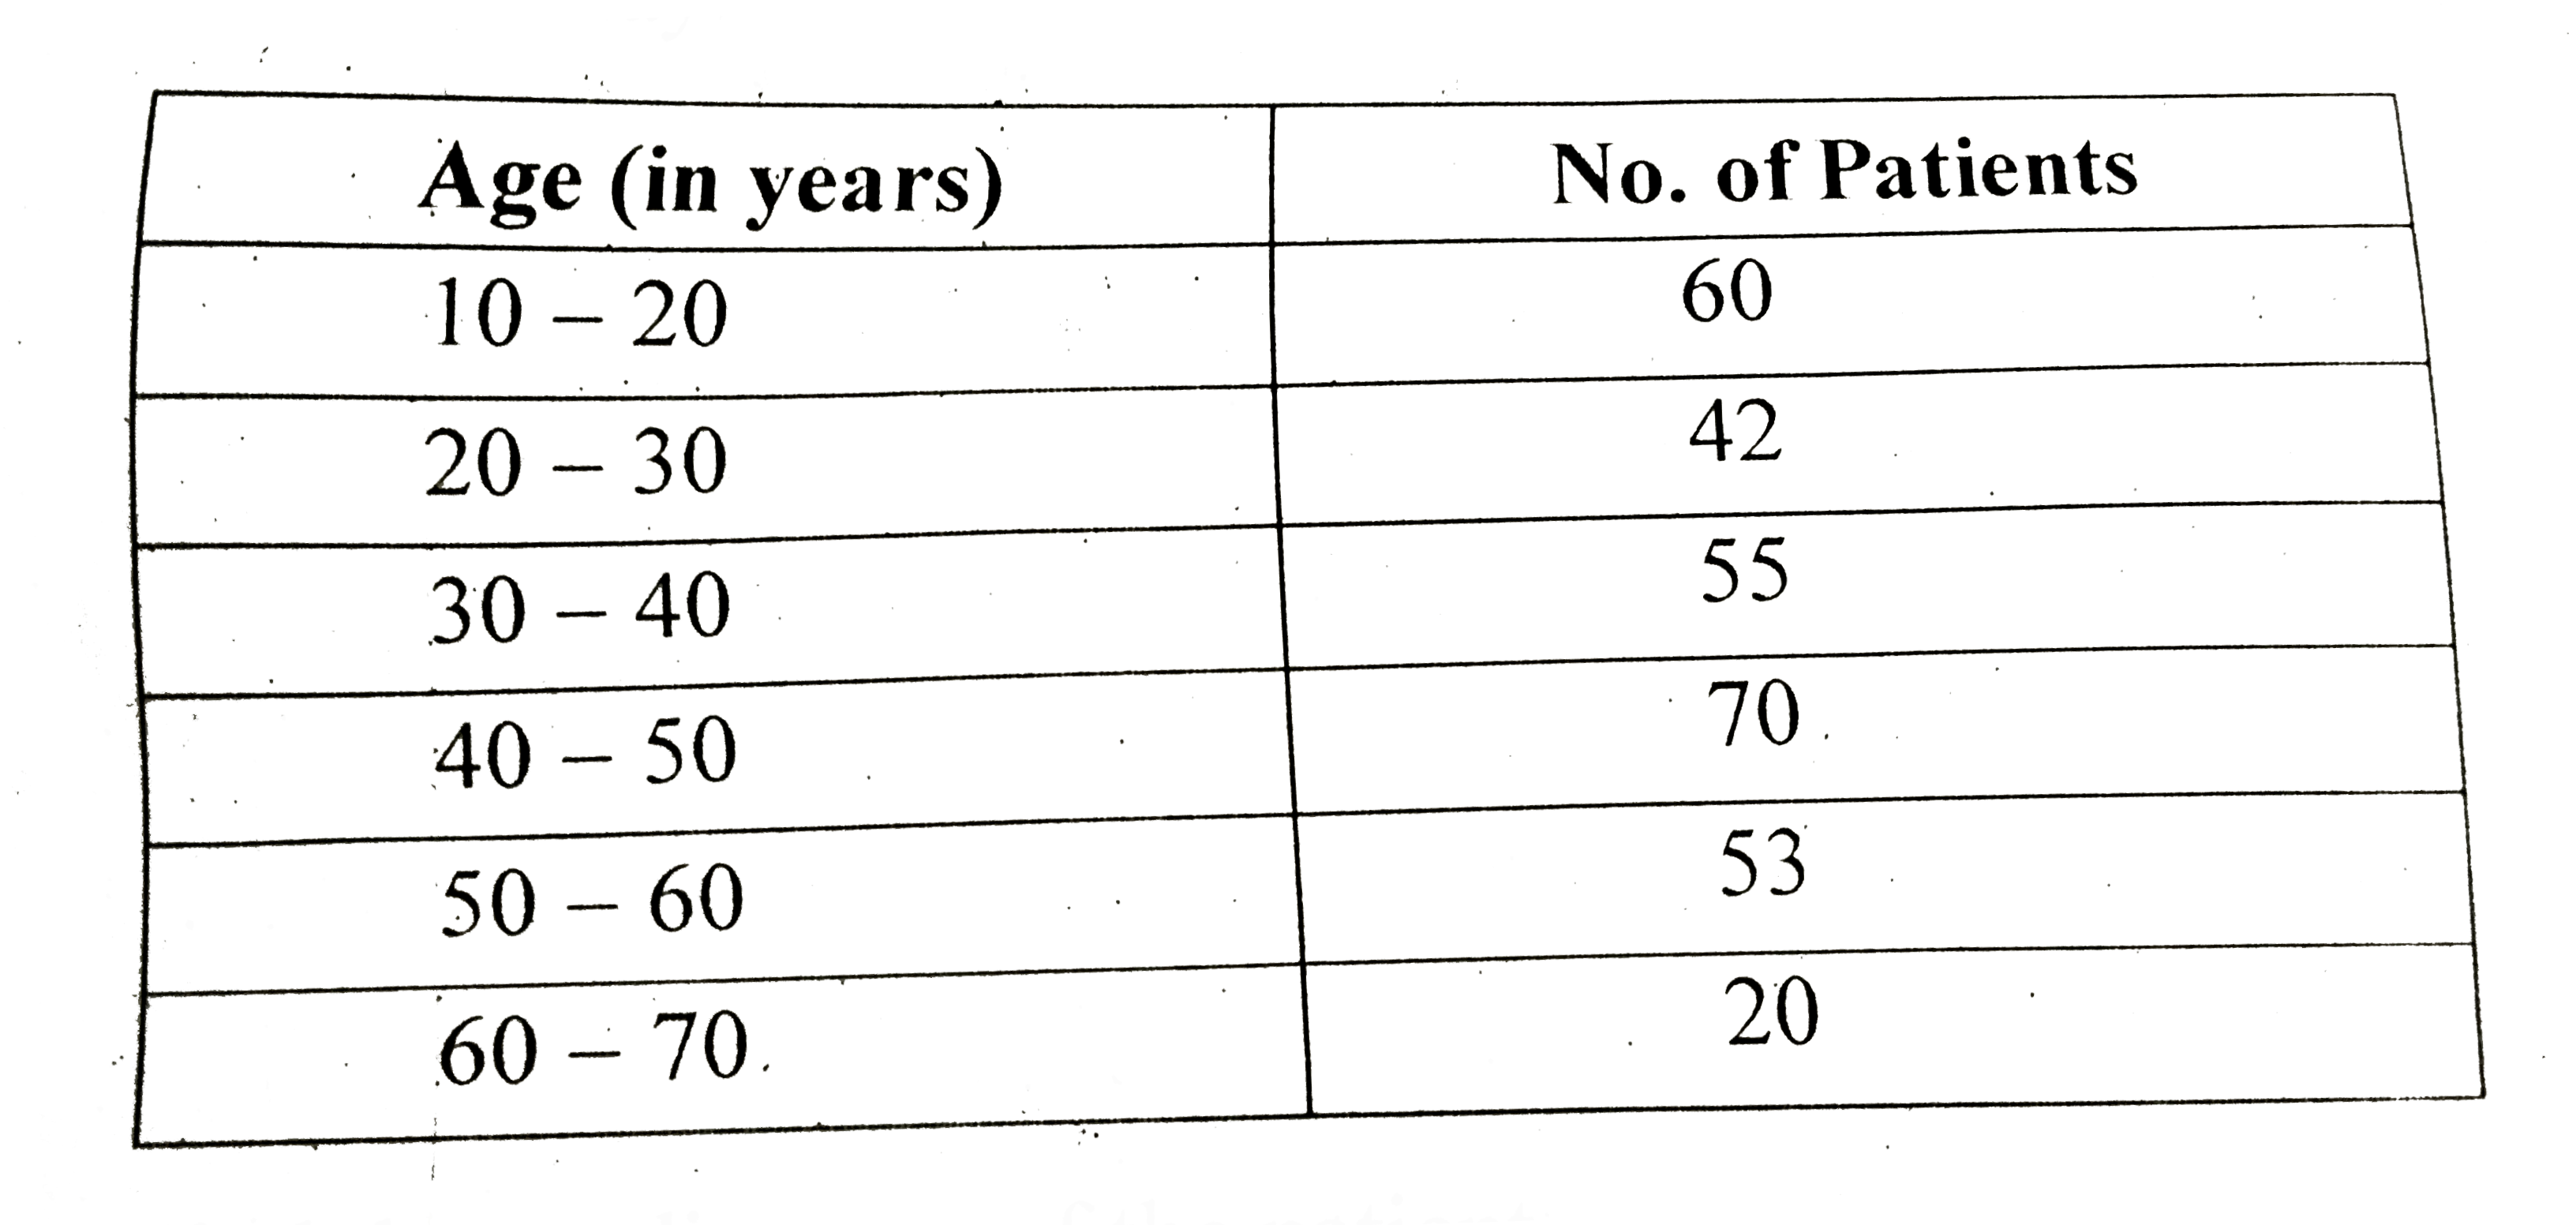
From the following table, how many patients were in the age group 40-60?

6
16
45
29
The correct Answer is:B
Step by step video, text & image solution for From the following table, how many patients were in the age group 40-60? by Maths experts to help you in doubts & scoring excellent marks in Class 14 exams.
Similar Questions
The following table shows the number of patients of differents age groups admitted to a hospital for treatement on a day. Find the median age of the patients.
 View Solution
The following table shows ages of 200 patients (in years) and the number of patients getting medical tretment on a particular day in a hospital in a day.

Find the median age of a patient.View Solution
Knowledge Check
- Question 1 - Select One
During a medical check-up, the heights of 40 students in a class were recorded as shown in the following table.

How many students have a height of 165 cm or more?A25B10C15D16 - Question 2 - Select One
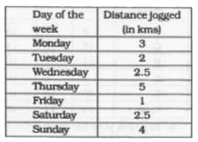
Refer the following data table and answer the following question.

If 400 calories are burnt by jogging 5 km, how many calories were burnt in the given week?AA)1650 caloriesBB)1550 caloriesCC)1500 caloriesDD)1600 calories - Question 3 - Select One
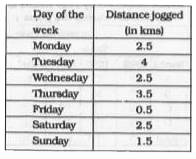
Refer the following data table and answer the following question.

If 400 calories are burnt by jogging 5 km, how many calories were burnt in the given week?A1410 caloriesB1360 caloriesC1310 caloriesD1260 calories
The following table shows the ages of the patients admitted in a hospital :
Age (in years)5−1515−2525−3535−4545−5555−65No. of case 6 11 21 23 14 5
Find the mode and the mean of the data given above. Compare and interpret the two measures of central tendency.View SolutionThe following table shows ages of 300 patients getting medical treatment in a hospital on a particular day:

Find the median age of the patient.View SolutionNumber of persons in various age groups in a town is given in the following tableDraw a bar graph to represent the above information and answer the following questions. (take 1 unit length = 20 thousands)(a) Which two age groups have same population?(b) All persons in the age group of 60 and above are called senior citizens. How many senior citizens are there in the town?
View SolutionA random sample of 20 people is classified in the following table according to their ages:

What is the mean age of this group of people?View SolutionA group of persons can do a work in 10 days. If 5 persons remains absent from first day, then the work is completed in 12 days by remaining persons. Tell how many persons were in the group initially?
View Solution
