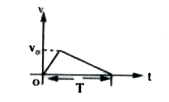
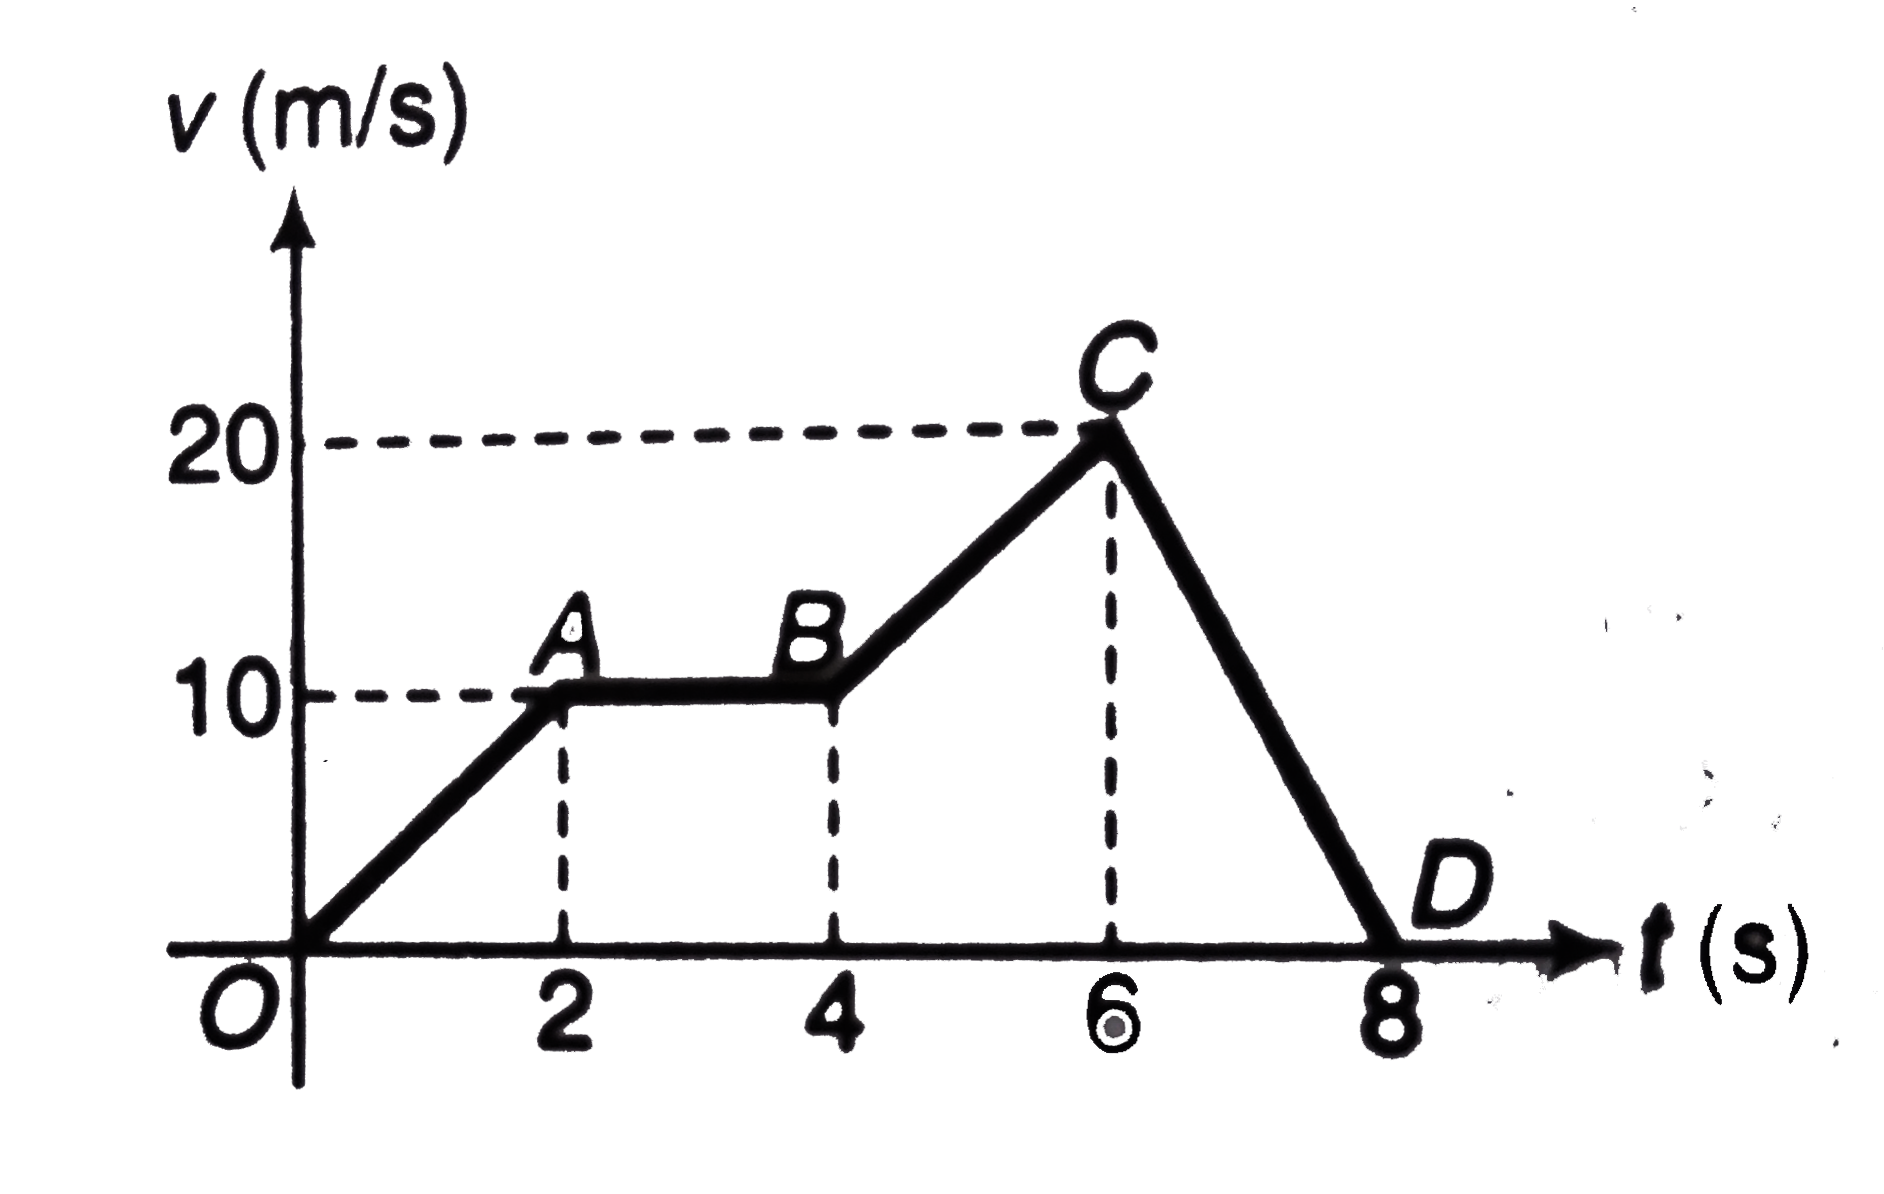
The velocity time plot for a particle moving on straight line is shown in the figure.
 Solution in Tamil
a) The particle has a constant acceleration
b) The particle has never turned around
c) The particle has zero displacement.
d) The average speed in the interval 0 to 10 s is the same as the average speed in the interval 10 s to 20s.
The correct Answer is:A, D
Step by step video & image solution for The velocity time plot for a particle moving on straight line is shown in the figure. by Physics experts to help you in doubts & scoring excellent marks in Class 11 exams.
Updated on:21/07/2023Topper's Solved these Questions
- REST AND MOTION : KINEMATICSBOOK - HC VERMACHAPTER - REST AND MOTION : KINEMATICSEXERCISE - Exercises
51 Videos
- REST AND MOTION : KINEMATICSBOOK - HC VERMACHAPTER - REST AND MOTION : KINEMATICSEXERCISE - Objective -1
13 Videos
- PHYSICS AND MATHEMATICSBOOK - HC VERMACHAPTER - PHYSICS AND MATHEMATICSEXERCISE - Exercises
34 Videos
- ROTATIONAL MECHANICSBOOK - HC VERMACHAPTER - ROTATIONAL MECHANICSEXERCISE - Exercises
86 Videos
Similar Questions
A man goes 10 m due east and then 24 m due north. Find the distance of his current position from the starting point ?
View SolutionA motor car is going due north at a speed of 50 km/h. It makes a 900 left turn without changing the speed. The change in the velocity of the car is about
View SolutionA vector →A makes an angle of 20∘and→B makes an angle of 110∘ with the X-axis. The magnitude of these vectors are 3 m and 4 m respectively.Find the resultant
View SolutionA wheel is making revolutions about its axis with uniform angular acceleration. Starting from rest, till it reaches 100 rev/sec in 4 seconds. Find the angular acceleration.
View SolutionA particle moves along a horizontal straight line with a velocity-time relationship as shown in the figure-1.129. The total distance moved by the particle is :
View SolutionVelocity displacement graph of a particle moving in a straight line is as shown in figure.

View SolutionDisplacement time graph of a particle moving in a straight line is a shown in figure.
View SolutionThe velocity -time (v - t) graph of a particle moving in a straight line is shown in figure. The acceleration of the particle at t = 9 is:
View SolutionThe velocity-time graph of a body moving in a straight line is shown in the figure.
View SolutionThe velocity-time graph of a particle moving along a straight line is shown in the figure-given below The displacement of the particle in 5 second is
View SolutionThe velocity-time plot for a particle moving on a straight line is shown in figure. Choose correct options . (##VMC_PHY_XI_WOR_BOK_01_C02_E03_026_Q01.png" width="80%">
View SolutionThe velocity - time graph of a particle moving along a straight line is shown in the figure given below The displacement of the particle in 5 second is
View SolutionThe velocity-time plot for a particle moving on a straight line is shown in figure.
View SolutionA particle moves in a straight line obeying the v-t graph as shown in the figure. The average velocity of the particle over the time T is :

View SolutionVelocity-time graph of a particle moving in a straight line is shown in figure. Plot the corresponding displacement-time graph of the particle if at time t=0, displacement s=0.

View SolutionVelocity displacement graph of a particle moving in a straight line is as shown in figure.
View Solution
