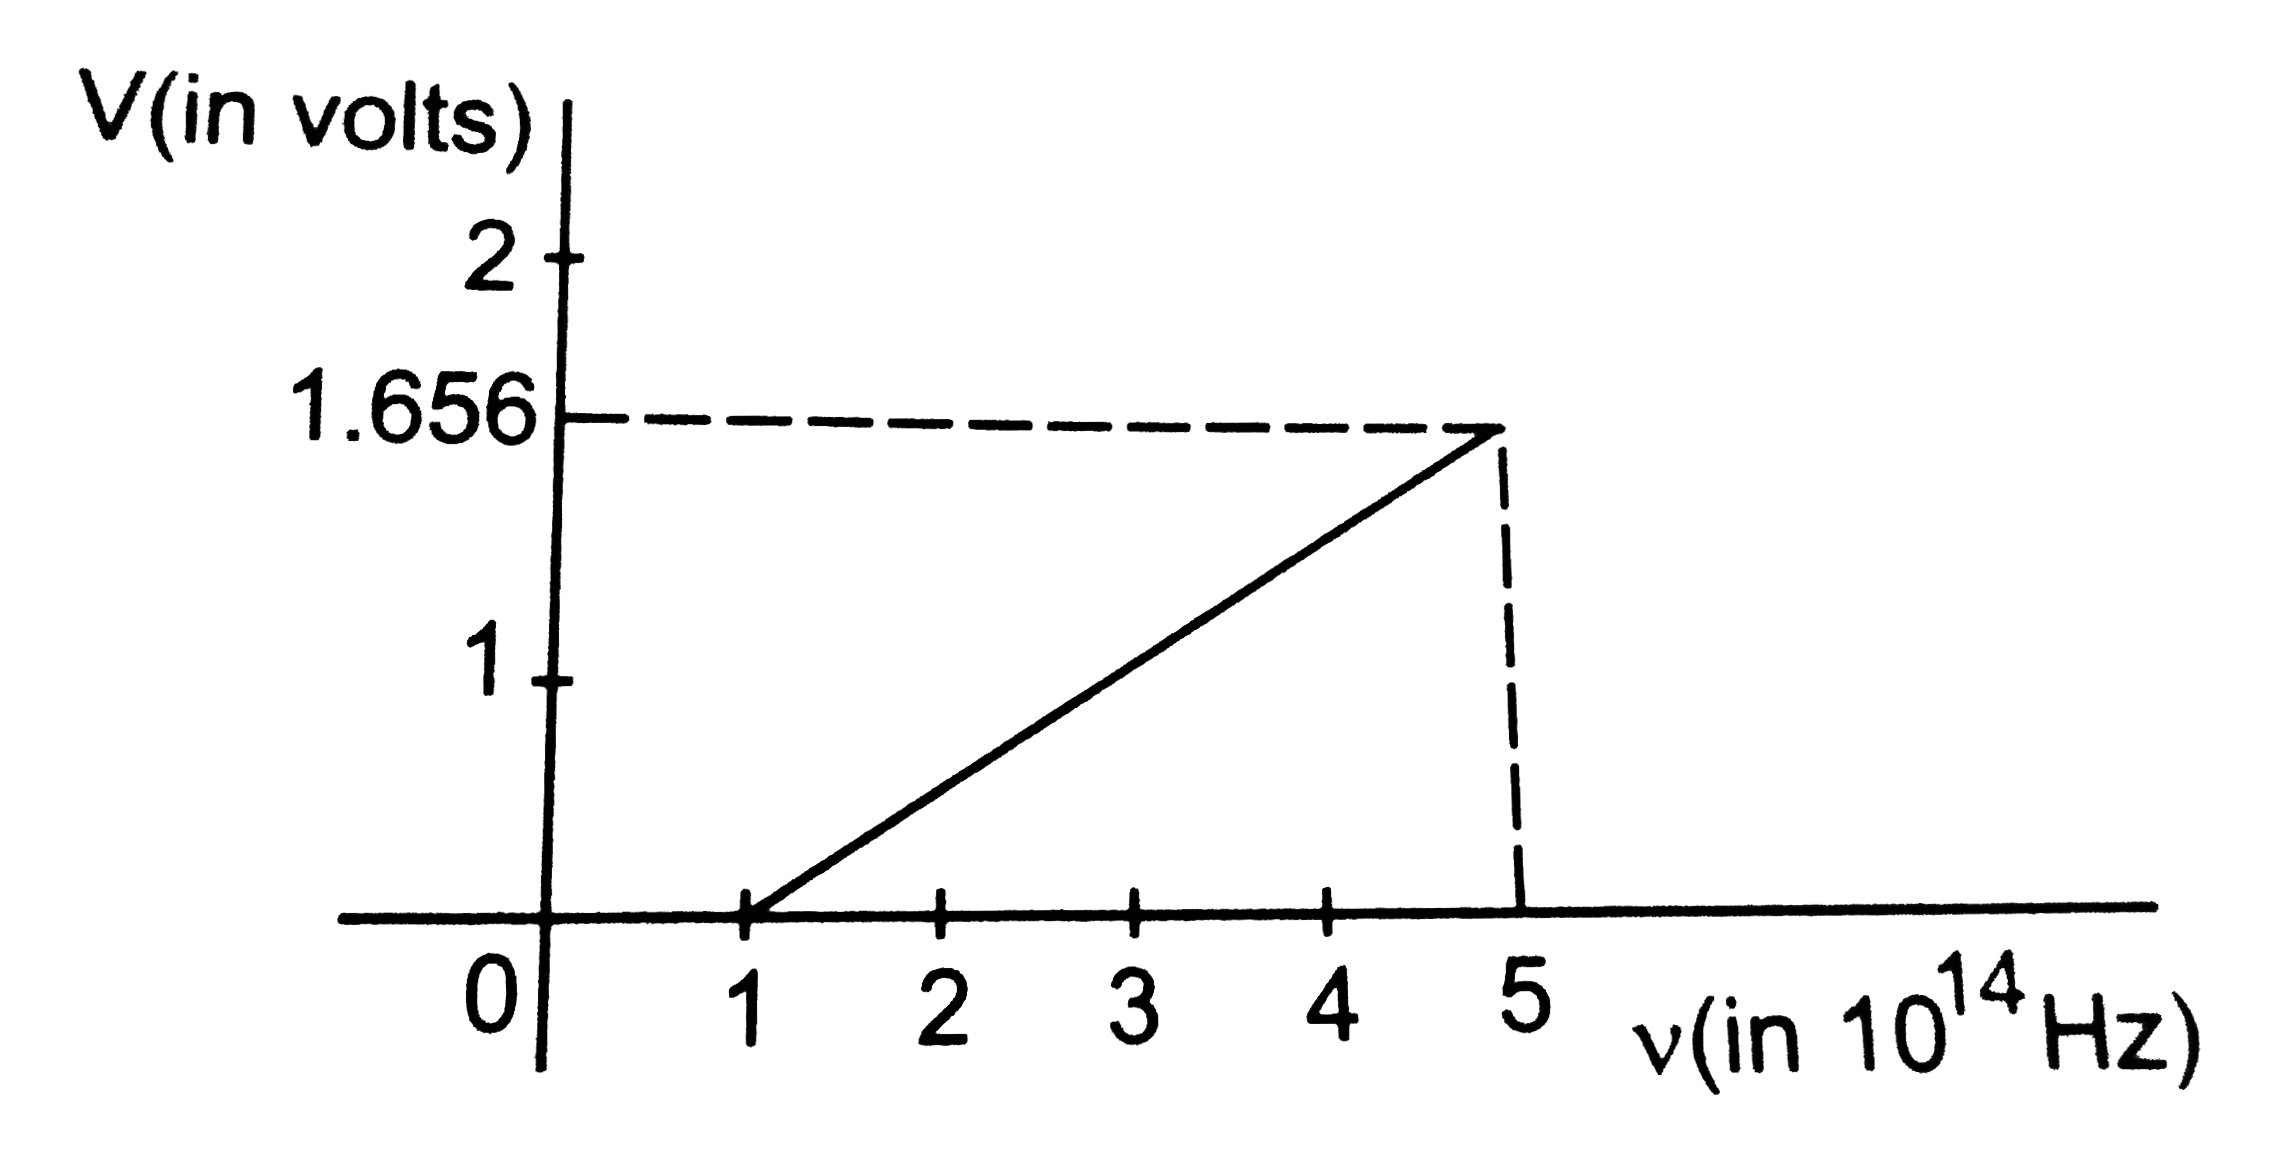
Figure is the plot of the stopping potential versus the frequency of the light used in an experiment on photoelectric effect. Find (a) the ratio h/e and (b) the work function.
 Solution in Tamil
We have to take two cases
Case - I v0=1.656 v=5×10¹⁴Hz
Case -II v0=0
v=1×10¹⁴Hz
(b) We know ev0=hv−W0
1.656e=h×5×10¹⁴−W0
0=5h×1014−5W0
1.6556e=4W0
⇒W0=1.6564eV
=0.414eV
(a) Putting the value of W_0 in equation (2)
⇒5W0=5h×1014
⇒5×0.414=5×h×1014
⇒h=4.414×10⁻¹⁵eV−s
Topper's Solved these Questions
- BOOK - HC VERMACHAPTER - PHOTO ELECTRIC EFFECT AND WAVE PARTICLE DUALITYEXERCISE - objective II7videos
PHOTO ELECTRIC EFFECT AND WAVE PARTICLE DUALITY
- BOOK - HC VERMACHAPTER - PERMANENT MAGNETSEXERCISE - Exercise25videos
PERMANENT MAGNETS
- BOOK - HC VERMACHAPTER - PHOTOMETRYEXERCISE - All Questions44videos
PHOTOMETRY
Similar Questions
When the intensity of a light source is increased.
01:46View SolutionA long bar magnet has a pole strength of 10Am. Find the magnetic field at a point on the axis of the magnet at a distance of 5cm from the north pole of the magnet.
01:36View SolutionFind the luminous flux of 10 W source of 600 nm. The relative luminosity at 600 nm is 0.6.
01:50View SolutionFigure shows the plot of the stopping potential versus the frequency of the light used in an experiment on photoelectric effect. The ratio (h)/(e) is
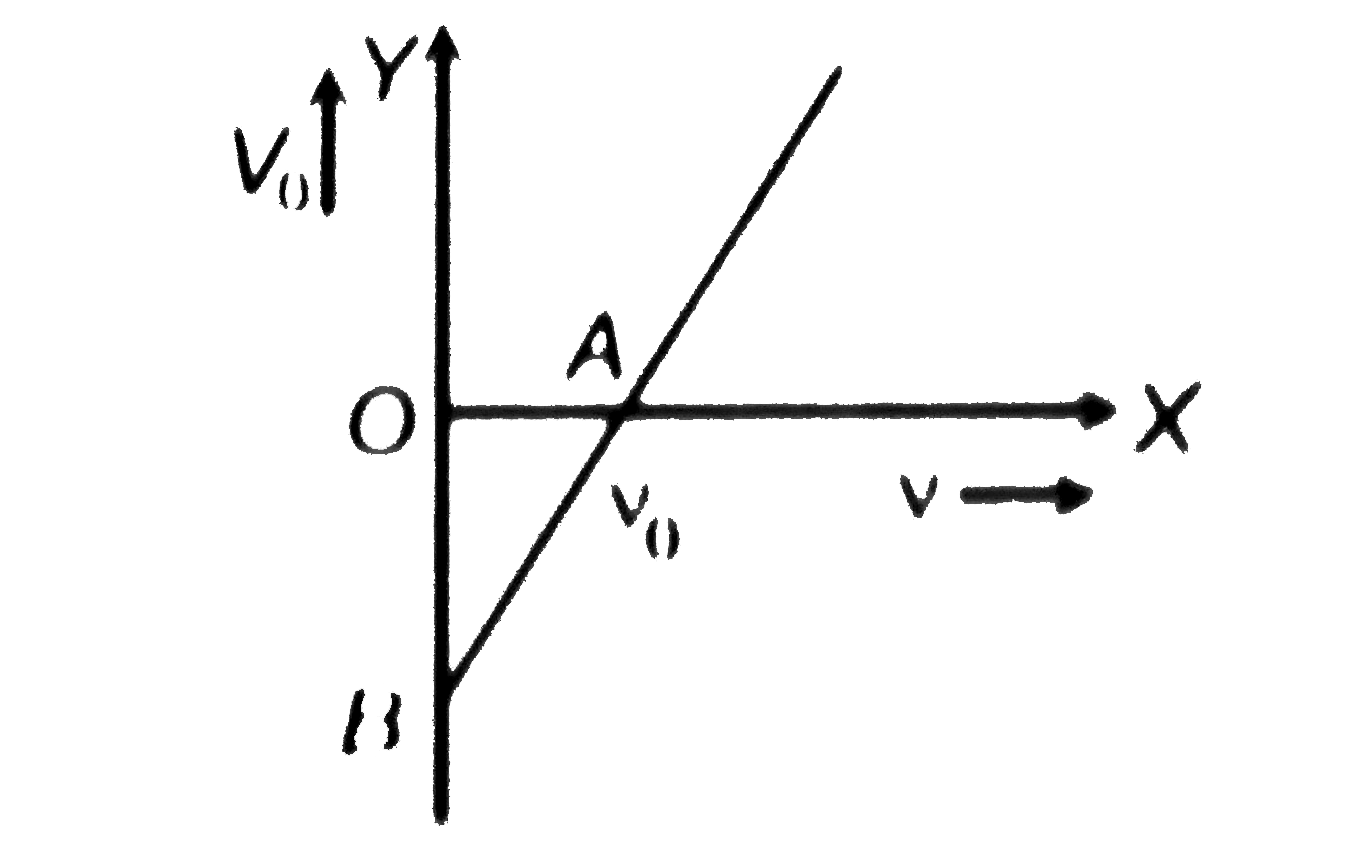
03:41View SolutionIn an experiment on photoelectric effect the frequency f of the incident light is plotted against the stopping potential V_(0) . The work function of the metal is given by ( e is the electronic charge)
04:23View SolutionThe stopping potential as a function of the frequency of the incident radiation is plotted for two different photoelectric surfaces A and B . The graphs show that work function of A is
 02:55View Solution
If the frequency of light in a photoelectric experiment is doubled the stopping potential will
03:50View SolutionA non-monochromatic light is used in an experiment on photoelectric effect. The stopping potential
01:36View SolutionIn a photoelectric experiment, two metal pairs plates A and B are used for a given light intensity I and frequency f. work function of metal B is more than that of A. The correct variation of stopping potential difference versus frequency is given by:
05:30View SolutionThe slope of the stopping potential versus frequency graph for photoelectric effect is equal to:
05:50View SolutionIn an experiment on photoelectric effect the frequency f of the incident light is plotted against the stopping potential V0. The work function of the photoelectric surface si given by ( e is the electronic charge)
 02:43View Solution
In photoelectric effect the slope of stop of stopping potential versus frequency of incident light for a given surface will be
01:41View SolutionIf the frequency of light in a photoelectric experiment is doubled the stopping potential will
01:22View SolutionA non-monochromatic light is used in an experiment on photoelectric effect. The stopping potential
04:08View SolutionThe stopping potential as a function of the frequency of the incident radiation is plotted for two different photoelectric surfaces A and B . The graphs show that work function of A is
 04:09View Solution
In photoelectric effect experiment, the slope of the graph of the stopping potential versus frequency gives the value of :
View Solution

