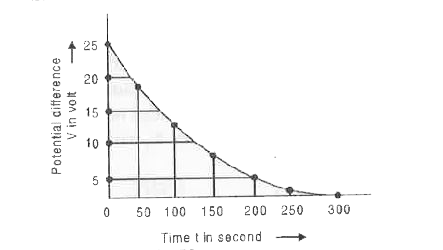
The figure shows an experimental plot for discharging of a capacitor in an R-C circuit . The time constant t of the circuit lies between:
A
100sec and 150 sec
B
150 sec and 200 sec
C
0 and 50 sec
D
50 sec and 100 sec
Text Solution
Q=CE0e−t/CR
4E=4E0e−t/π
E=E0e−t/T
When t=0⇒E0=25
E=E0=25
When t=200⇒V=5
∴5=25e−200t
In5=200t
t=200∈5=200In10−In2=200In10−0.693
Time constant is the time in which 63% discharging in completed so remaining charge =0.37×25=9.25V which lies in 100<t<150.
|
Topper's Solved these Questions
- E.M. INDUCTION AND A.C. CURRENTS BOOK - MODERN PUBLICATIONCHAPTER - E.M. INDUCTION AND A.C. CURRENTS EXERCISE - RECENT COMPETITIVE QUESTIONS
31 Videos
- E.M. INDUCTION AND A.C. CURRENTS BOOK - MODERN PUBLICATIONCHAPTER - E.M. INDUCTION AND A.C. CURRENTS EXERCISE - MULTIPLE CHOICE QUESTIONS LEVEL-II
51 Videos
- DESCRIPTION OF MOTION IN TWO AND THREE DIMENSIONBOOK - MODERN PUBLICATIONCHAPTER - DESCRIPTION OF MOTION IN TWO AND THREE DIMENSIONEXERCISE - Revision TEST
36 Videos
- ELECTROMAGNETIC WAVESBOOK - MODERN PUBLICATIONCHAPTER - ELECTROMAGNETIC WAVESEXERCISE - RECENT COMPETITIVE QUESTIONS
4 Videos
Similar Questions
Knowledge Check
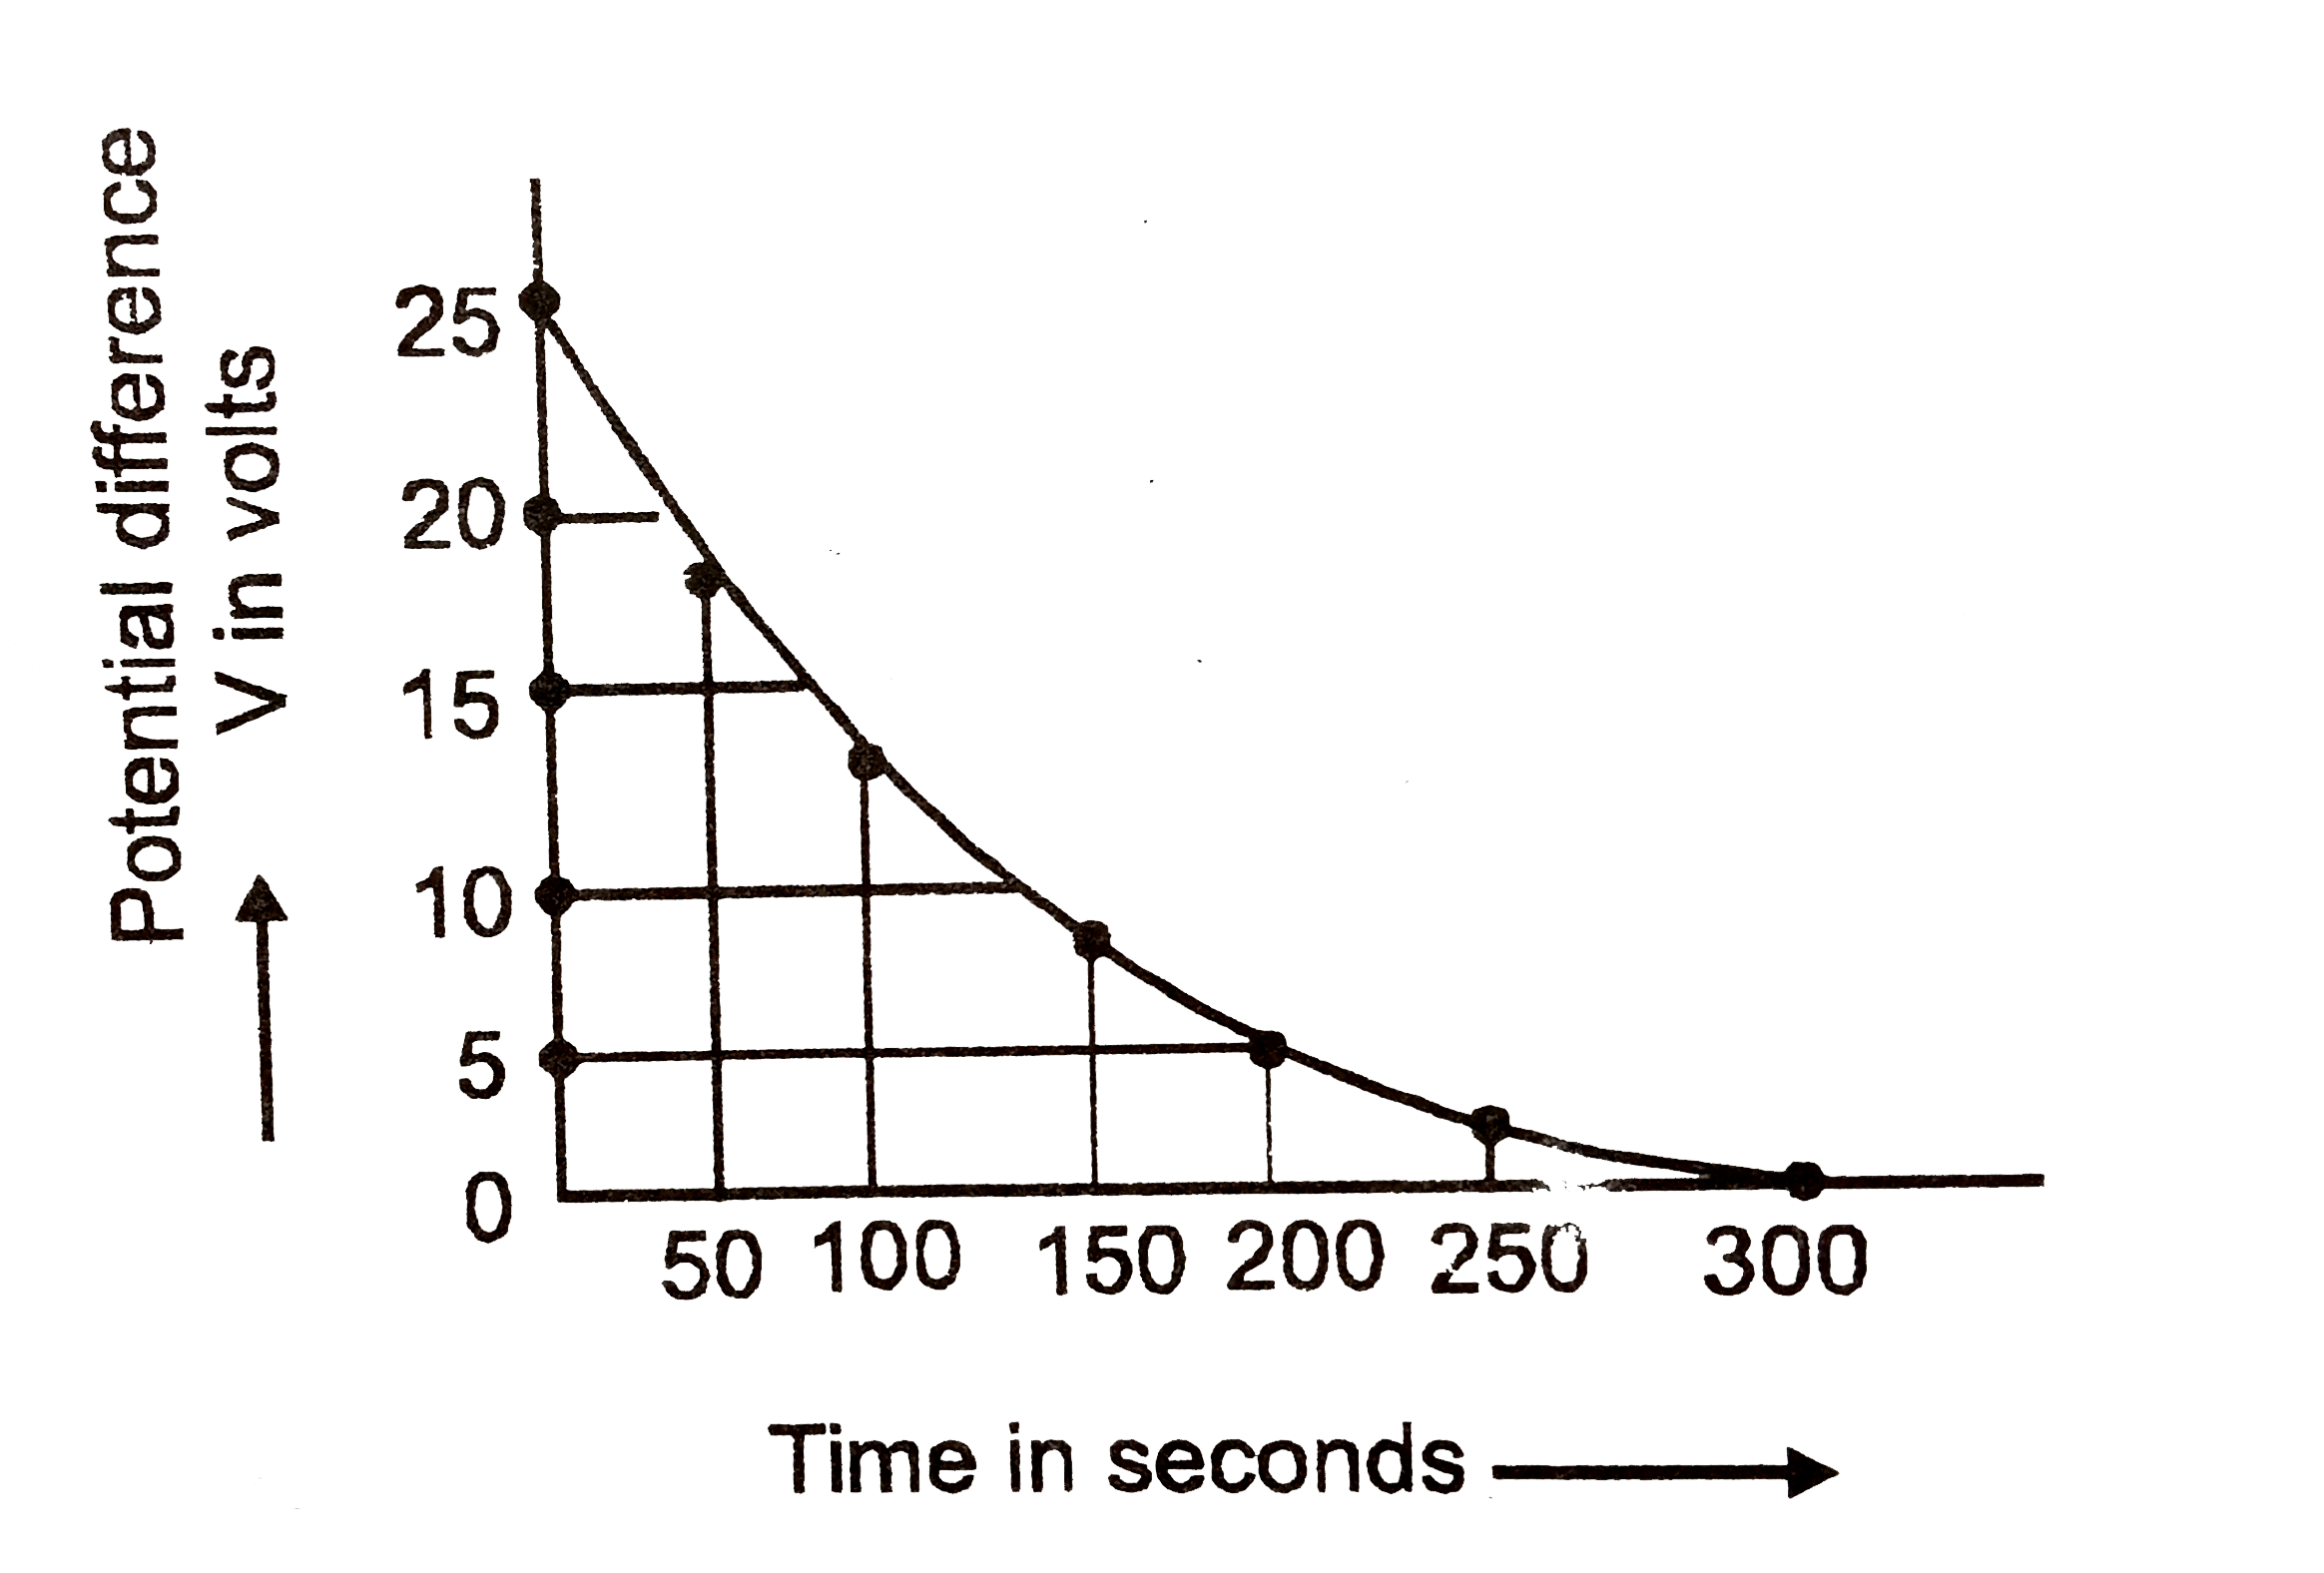
The figure shows an experimental plot discharging of a capacitor in an RC circuit. The time constant of this circuit lies between:
 A150secand 200secB0 and 50secC50sec and 100secsD100sec and 150sec
The time constant of C-R circuit is
A1CRBCRCCRDRCThe figure shows an L−R circuit the time constant for the circuit is
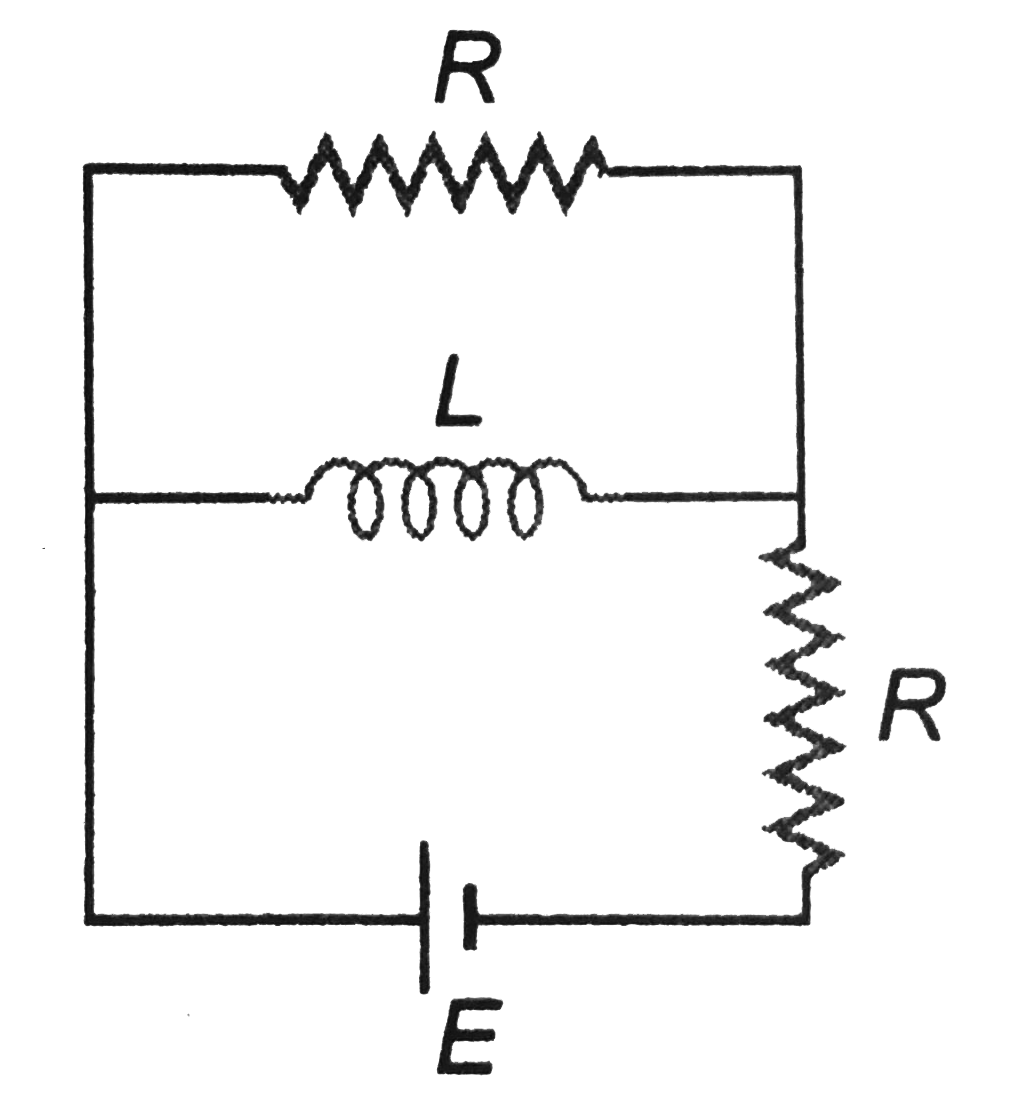 AL2RB2LRC2RLDR2L
The figure shows an L−R circuit the time constant for the circuit is

View SolutionR-C Circuit at Time 't'
View SolutionThe time constant of the circuit shown in the figure is
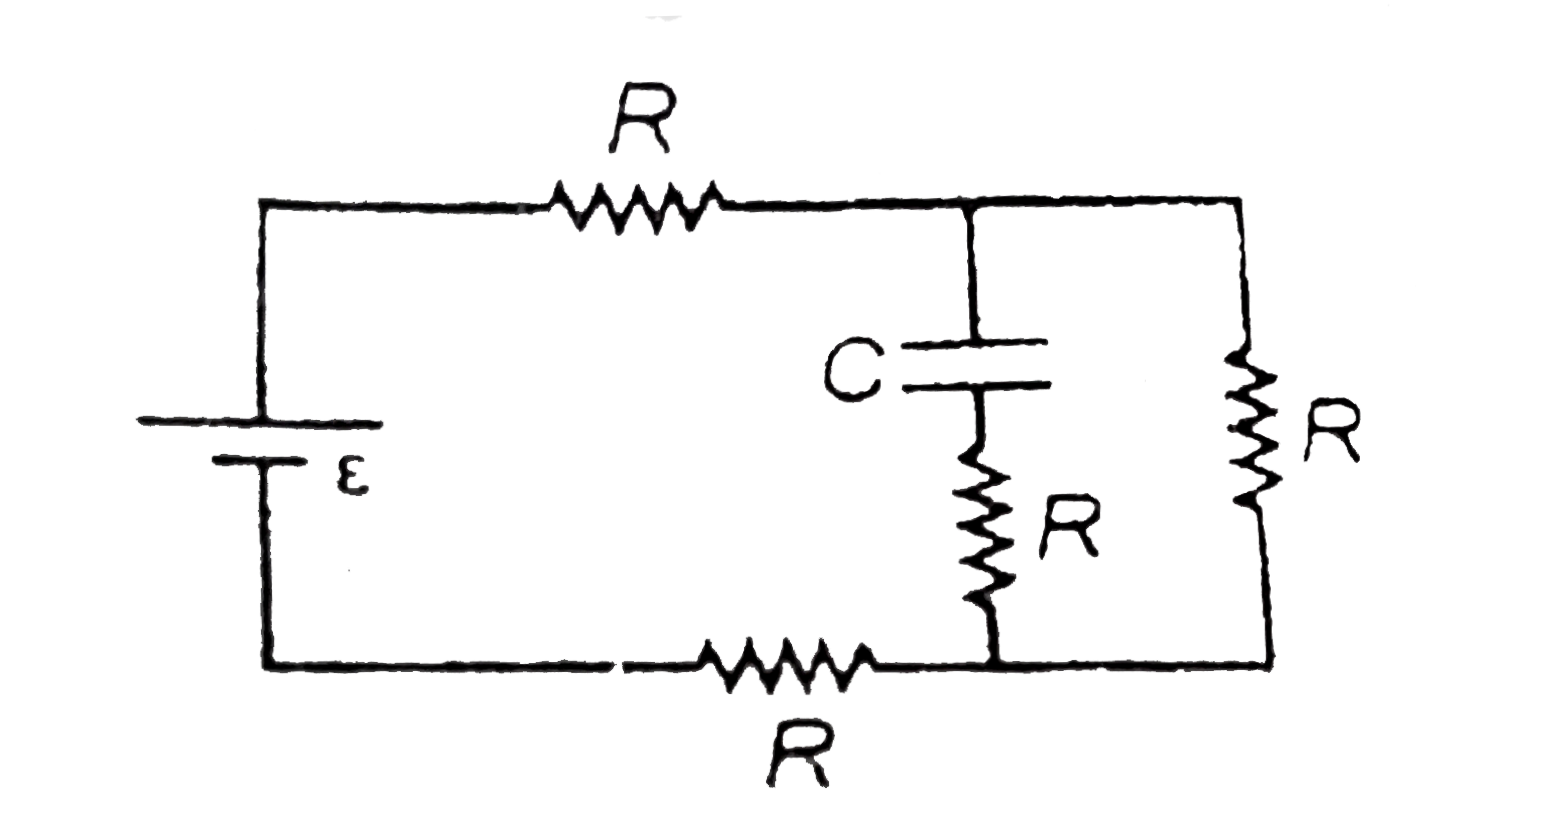
View SolutionThe time constant of the circuit shown in the figure is

View SolutionThe time constant of the circuit shown in the figure is
View Solution
