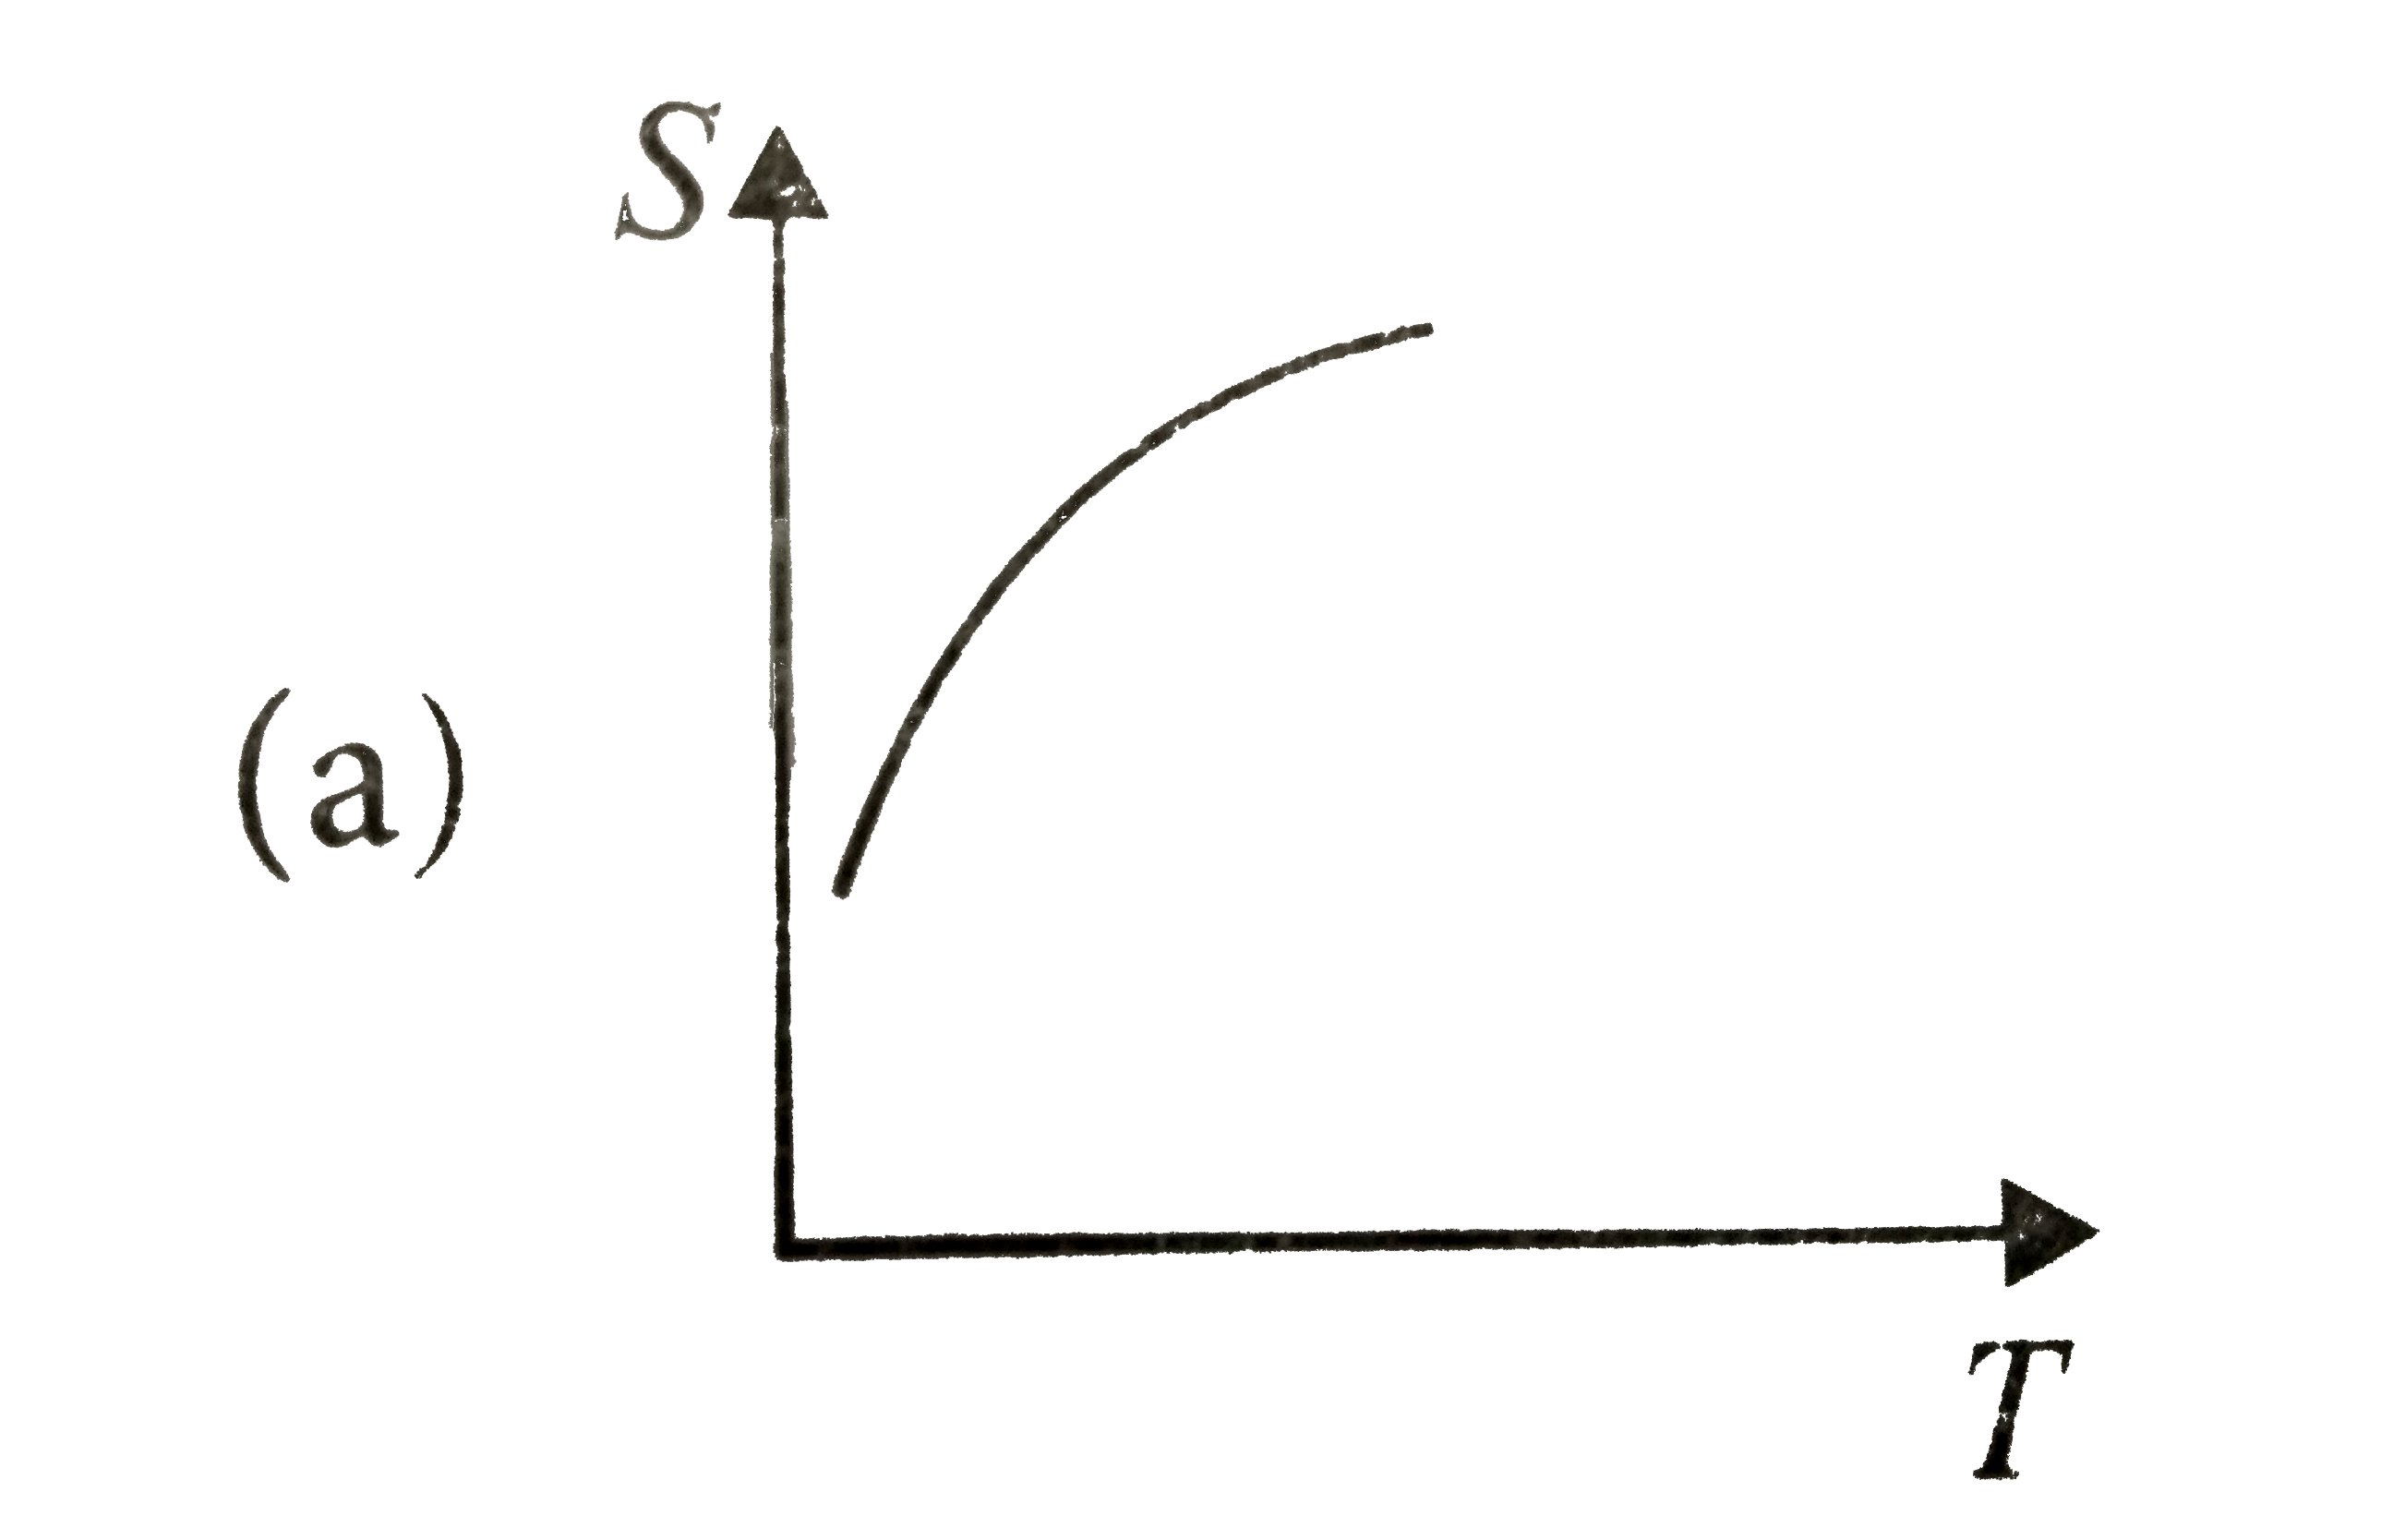
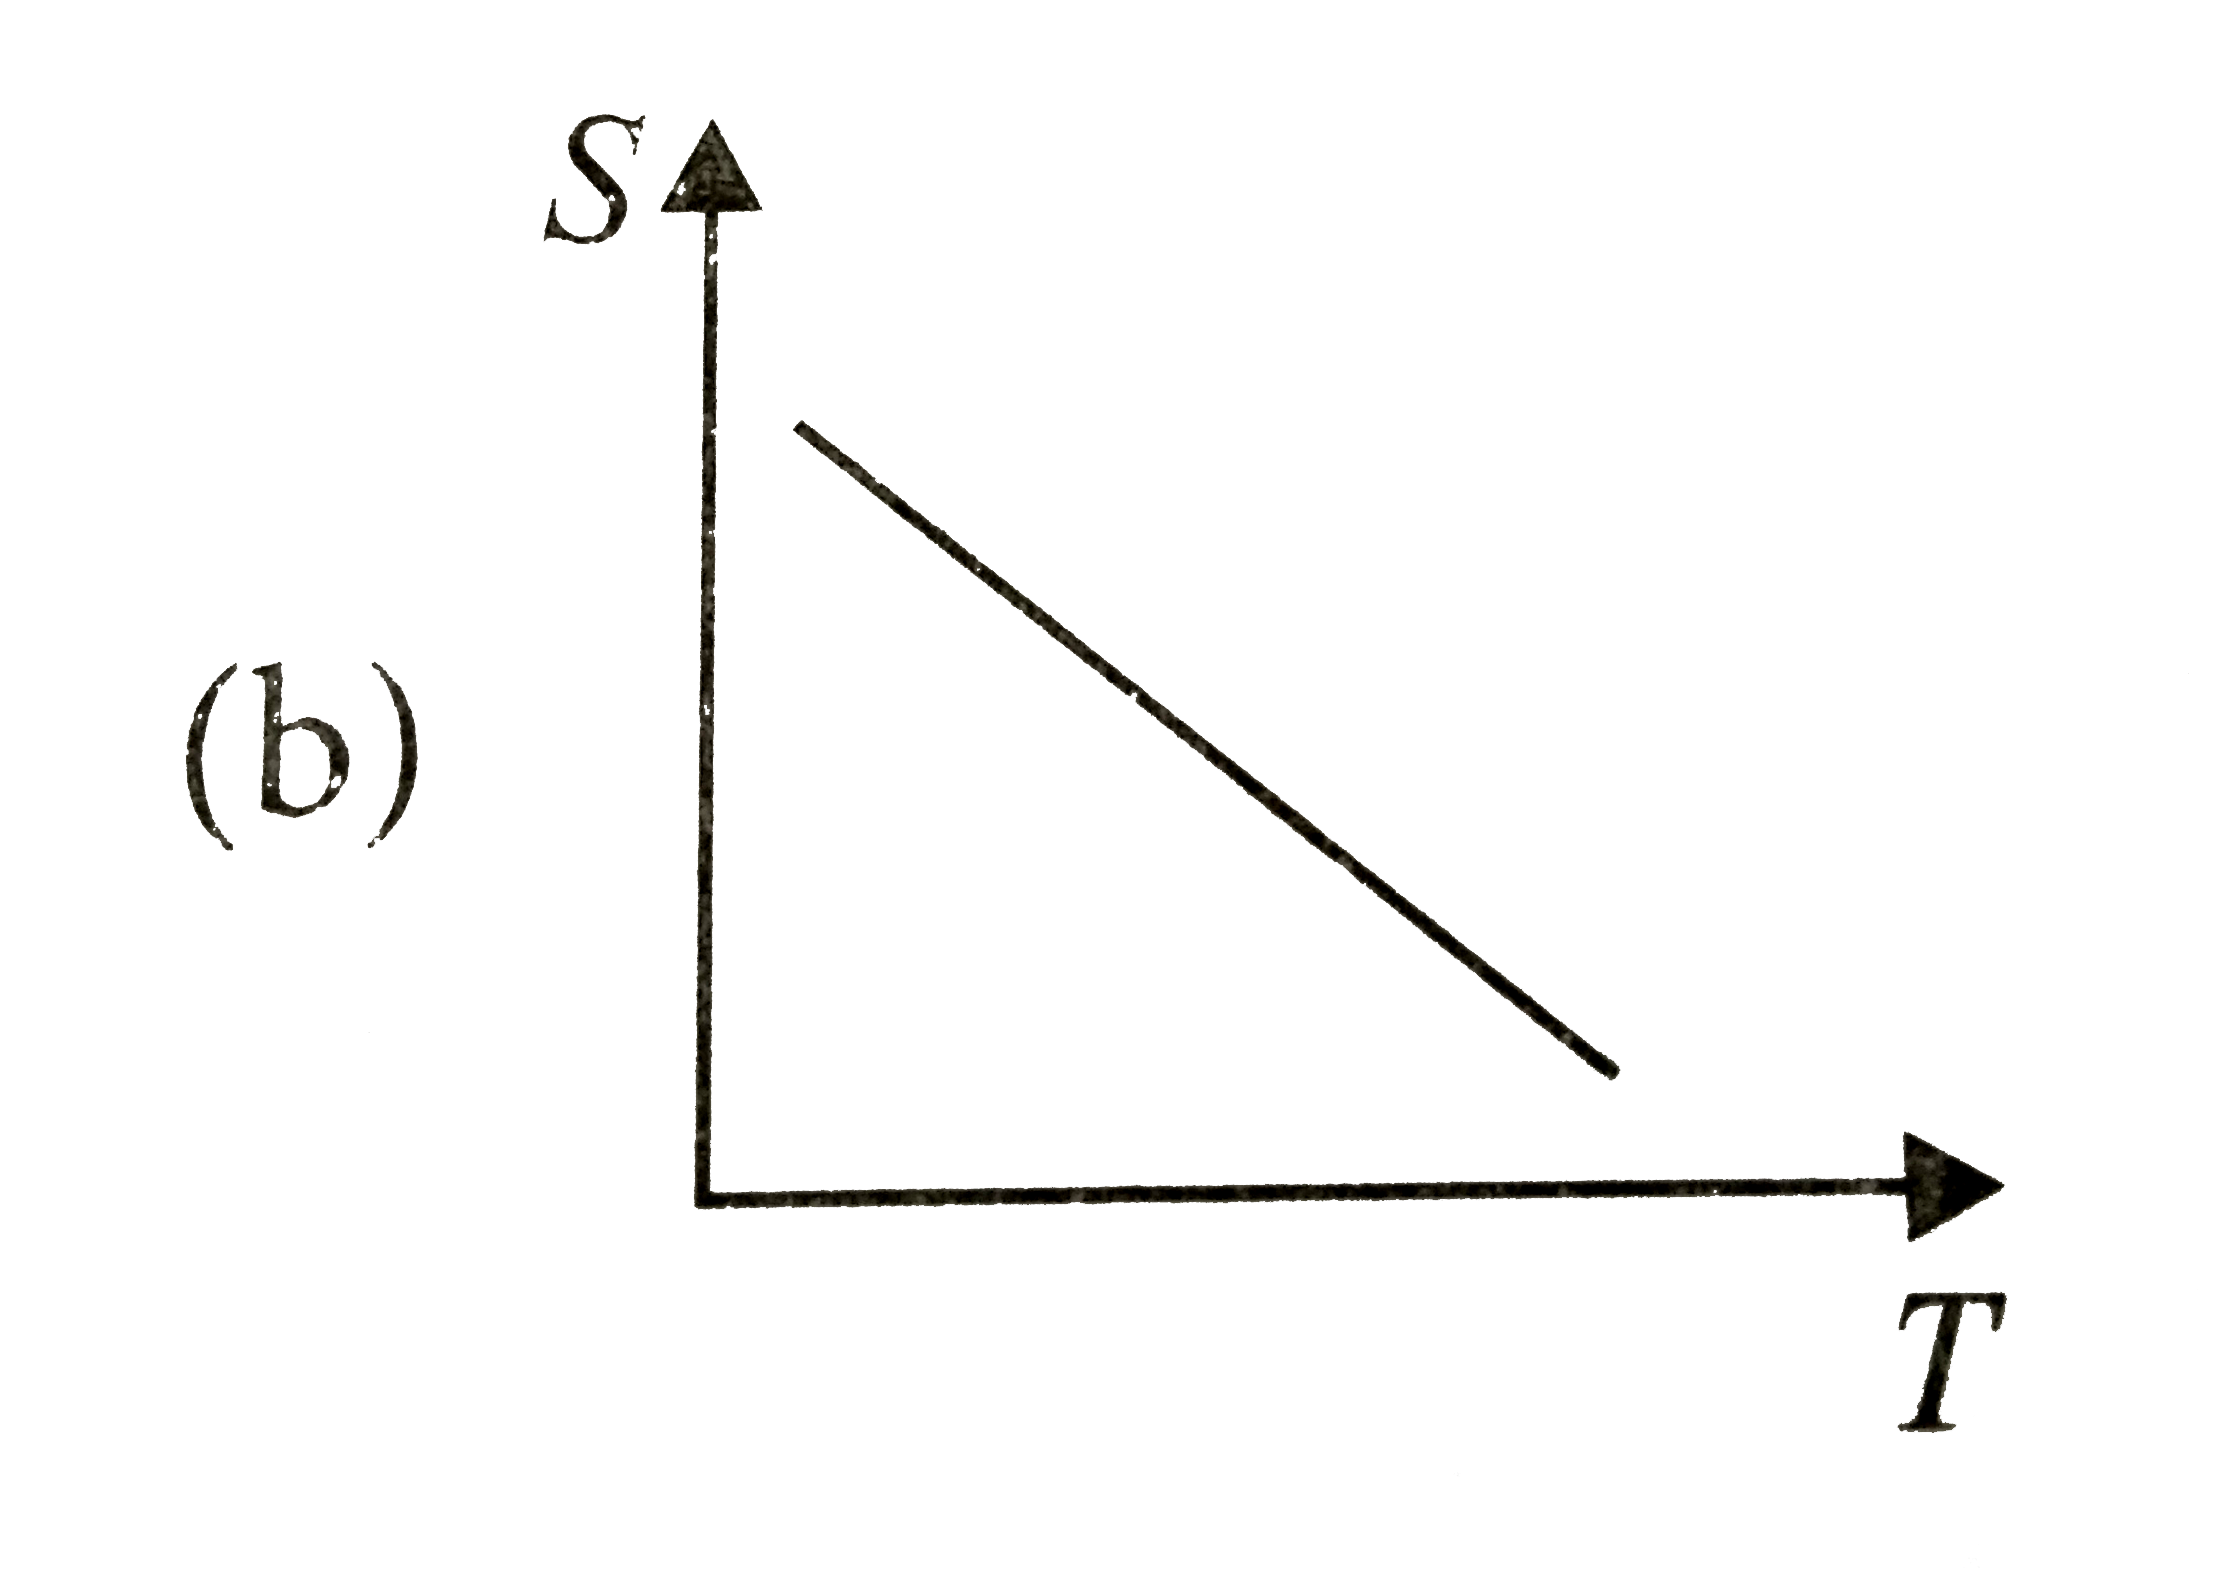
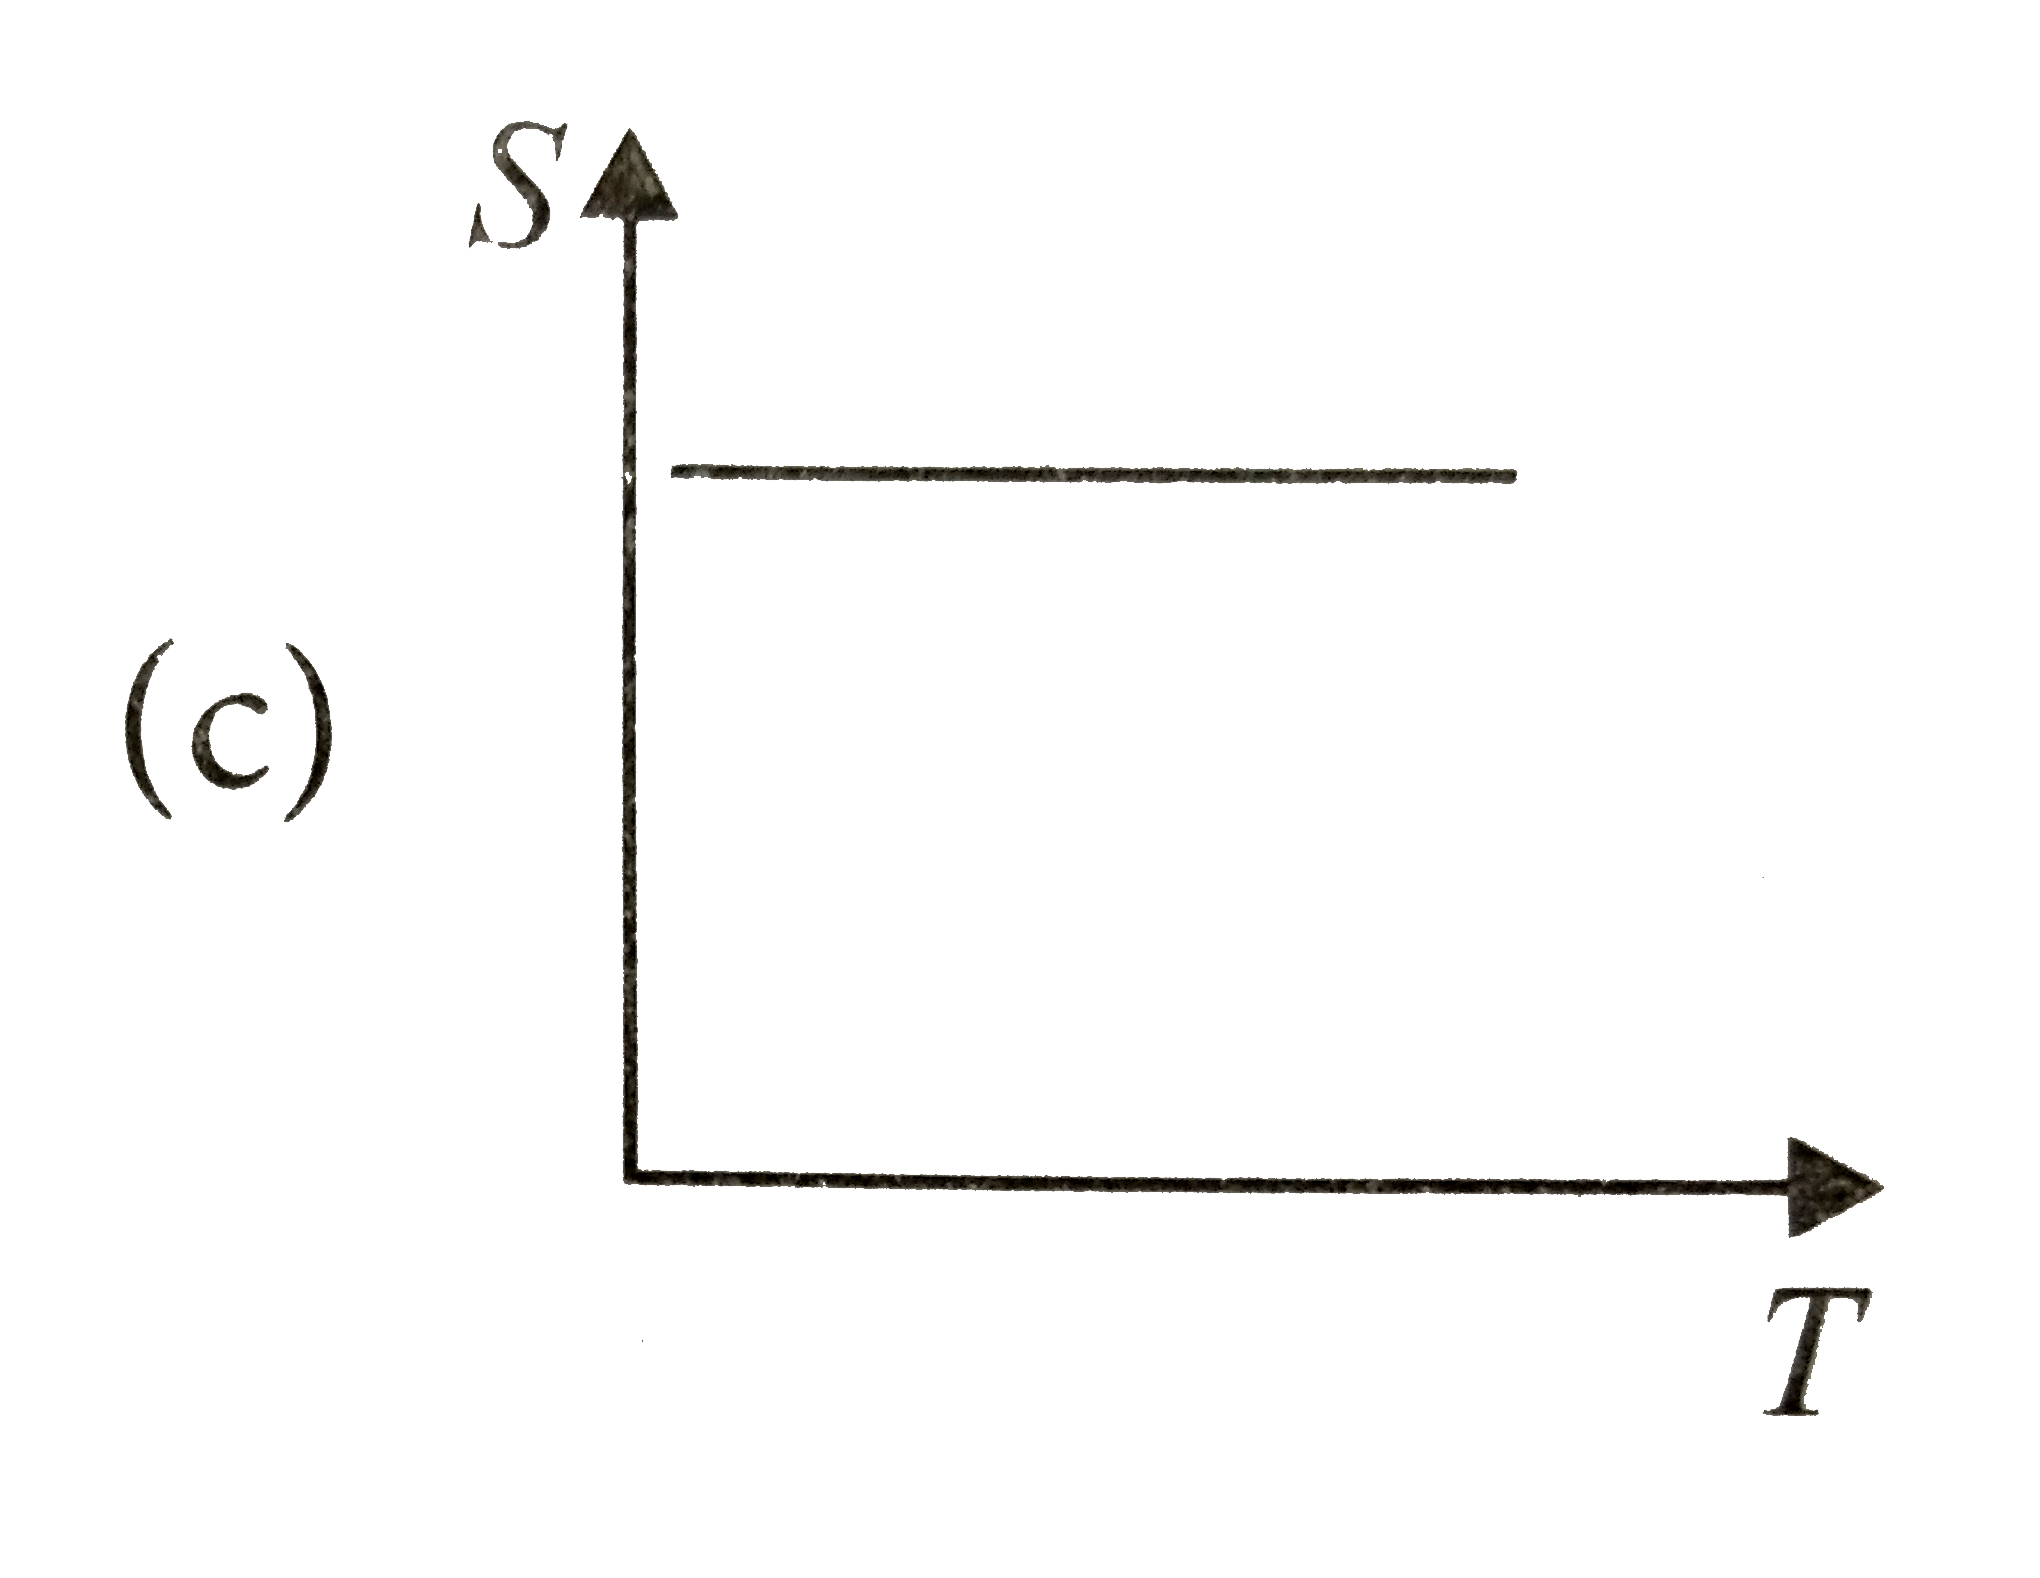
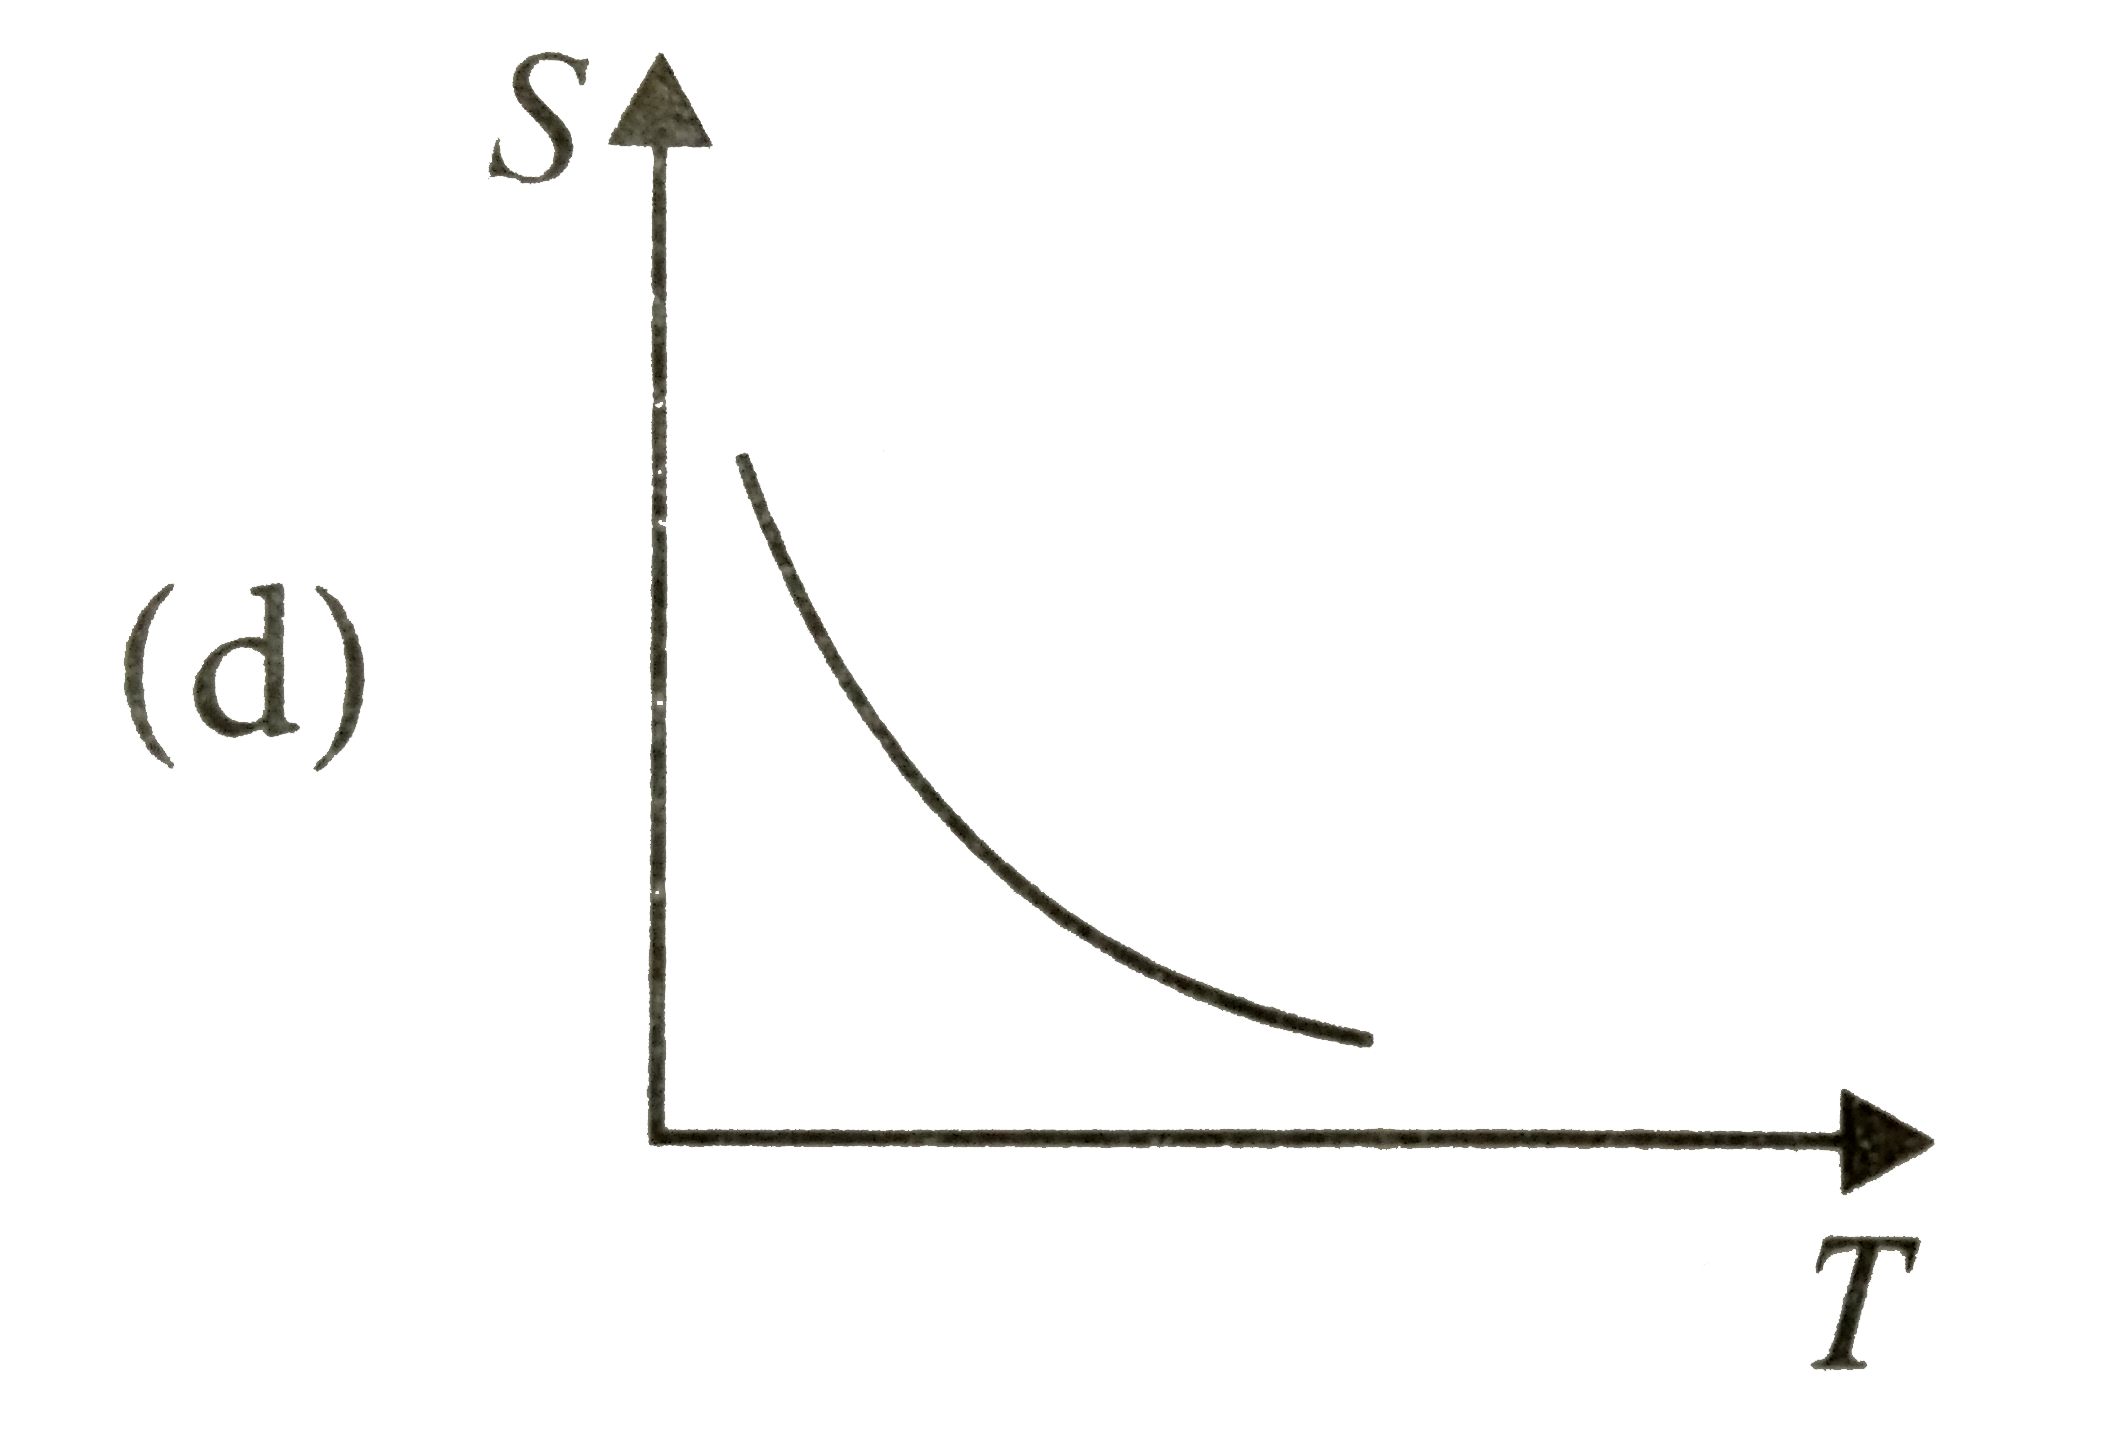
The graph between resistivity and temperature for a limited range of temperature, is a straight line for a material like
A
copper
B
nichrome
C
silicon
D
mercury
Text Solution
The correct Answer is:B
|
Topper's Solved these Questions
- CURRENT ELECTRICITYBOOK - NEW JOYTHI PUBLICATIONCHAPTER - CURRENT ELECTRICITYEXERCISE - EVALUATION QUESTIONS AND ANSWERS
72 Videos
- ATOMSBOOK - NEW JOYTHI PUBLICATIONCHAPTER - ATOMSEXERCISE - COMPETITIVE EXAM CORNER
5 Videos
- DUAL NATURE OF RADIATION AND MATTER BOOK - NEW JOYTHI PUBLICATIONCHAPTER - DUAL NATURE OF RADIATION AND MATTER EXERCISE - COMPETITIVE EXAM CORNER
15 Videos
Similar Questions
Knowledge Check
The resistivity of a semiconductor at room temperature is in between
A1010 to 1012Ω cmB106 to 108Ω cmC10−3 to 106Ω cmD10−2 to 10−5Ω cmWhich graph represents the variation of surface tension with temperature over small temperature ranges for water?
A B
B C
C D
D
The resistance of a wire at room temperature 30∘C is found to be 10Omnow to increase the resistance by 10% the temperature of the wire must be [the temperature coefficient of resistance of the material of the wire is 0.002 per ∘C]
A36∘CB83∘CC63∘CD33∘C
Show variation of resistivity of copper as a function of temperature in a graph.
View SolutionShow variation of resistivity of copper as a function of temperature in a graph.
View SolutionShow variation of resistivity of SI with temperature in a graph.
View SolutionWhich graph represents the variation of surface tension with temperature over small temperature ranges for water?
View SolutionA platinum resistance thermometer is used for measuring temperatures ranging from……. To ……….
View Solution
