Which graph shows the variation of electric field E due to a hollow spherical conductor or radius R as a function of distance from the centre of the sphere ?
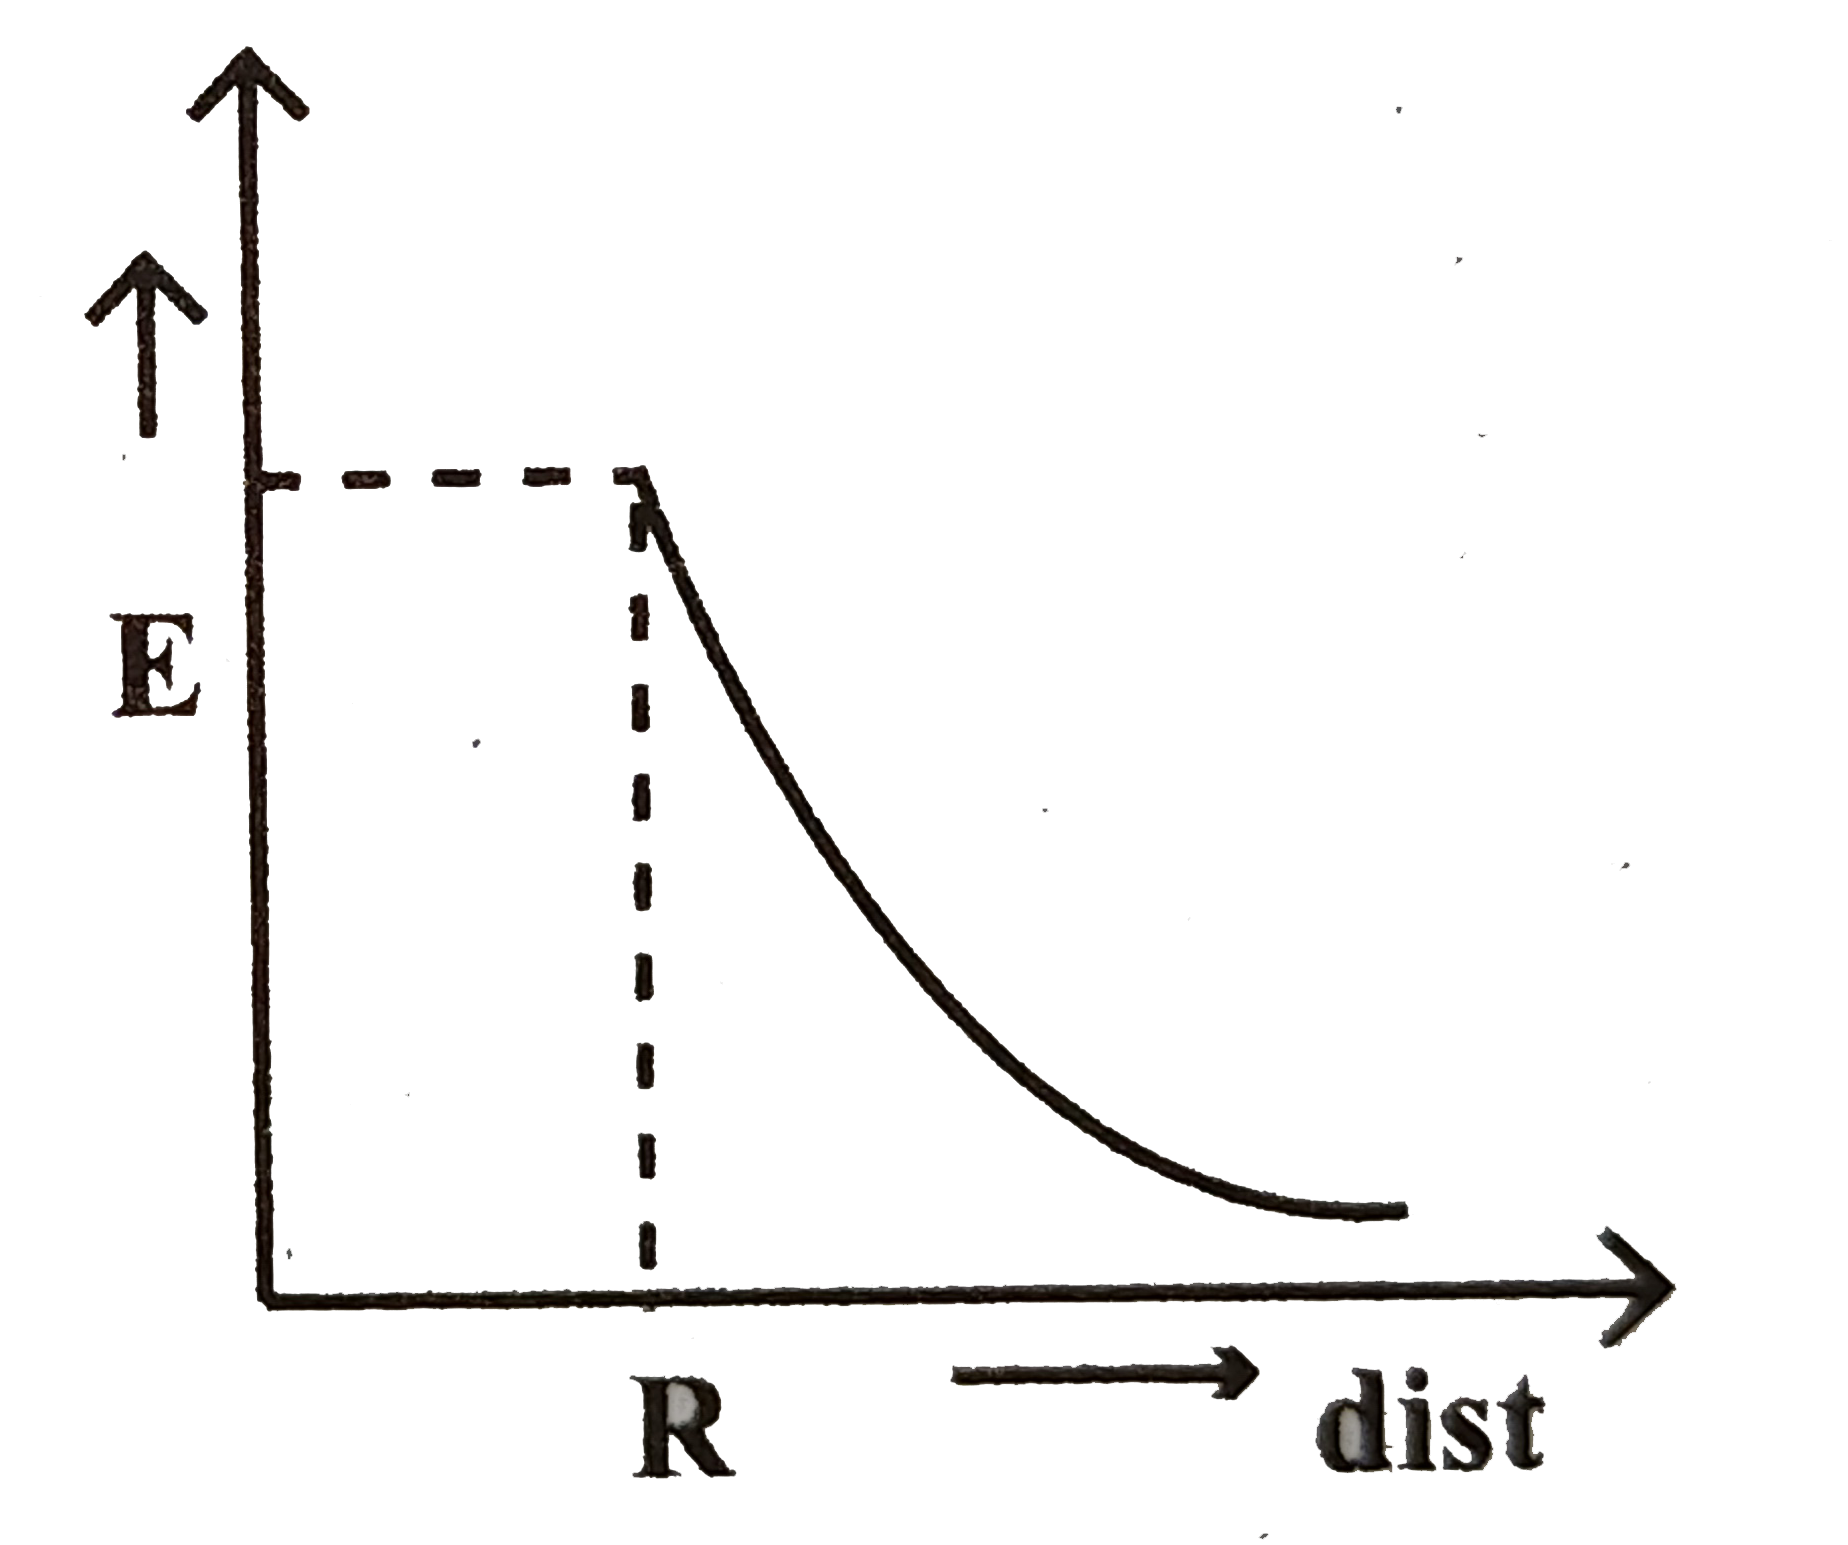
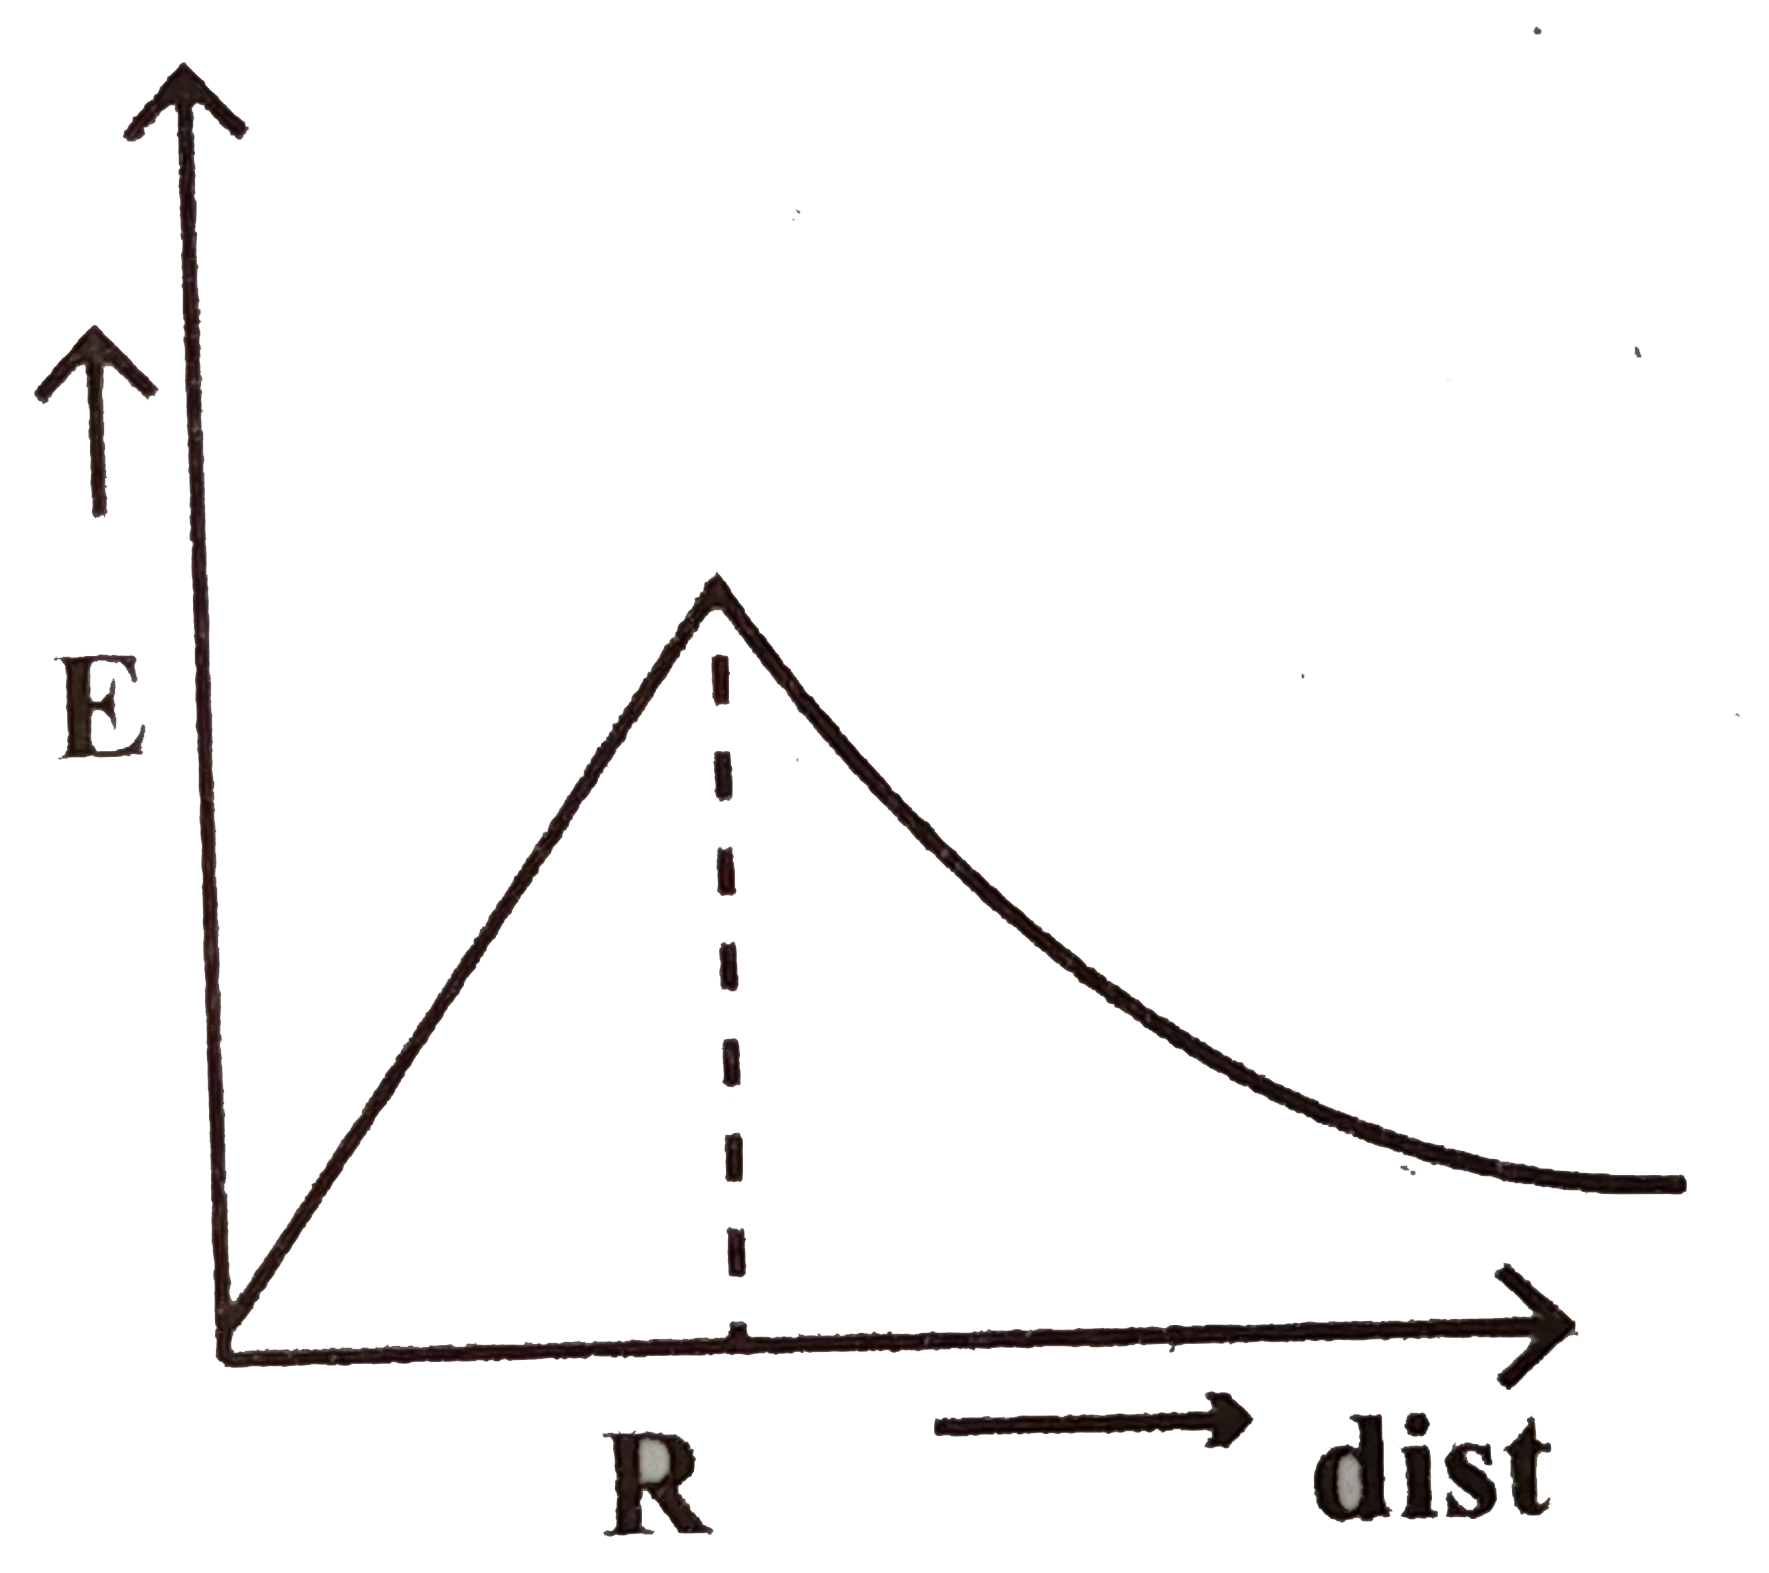
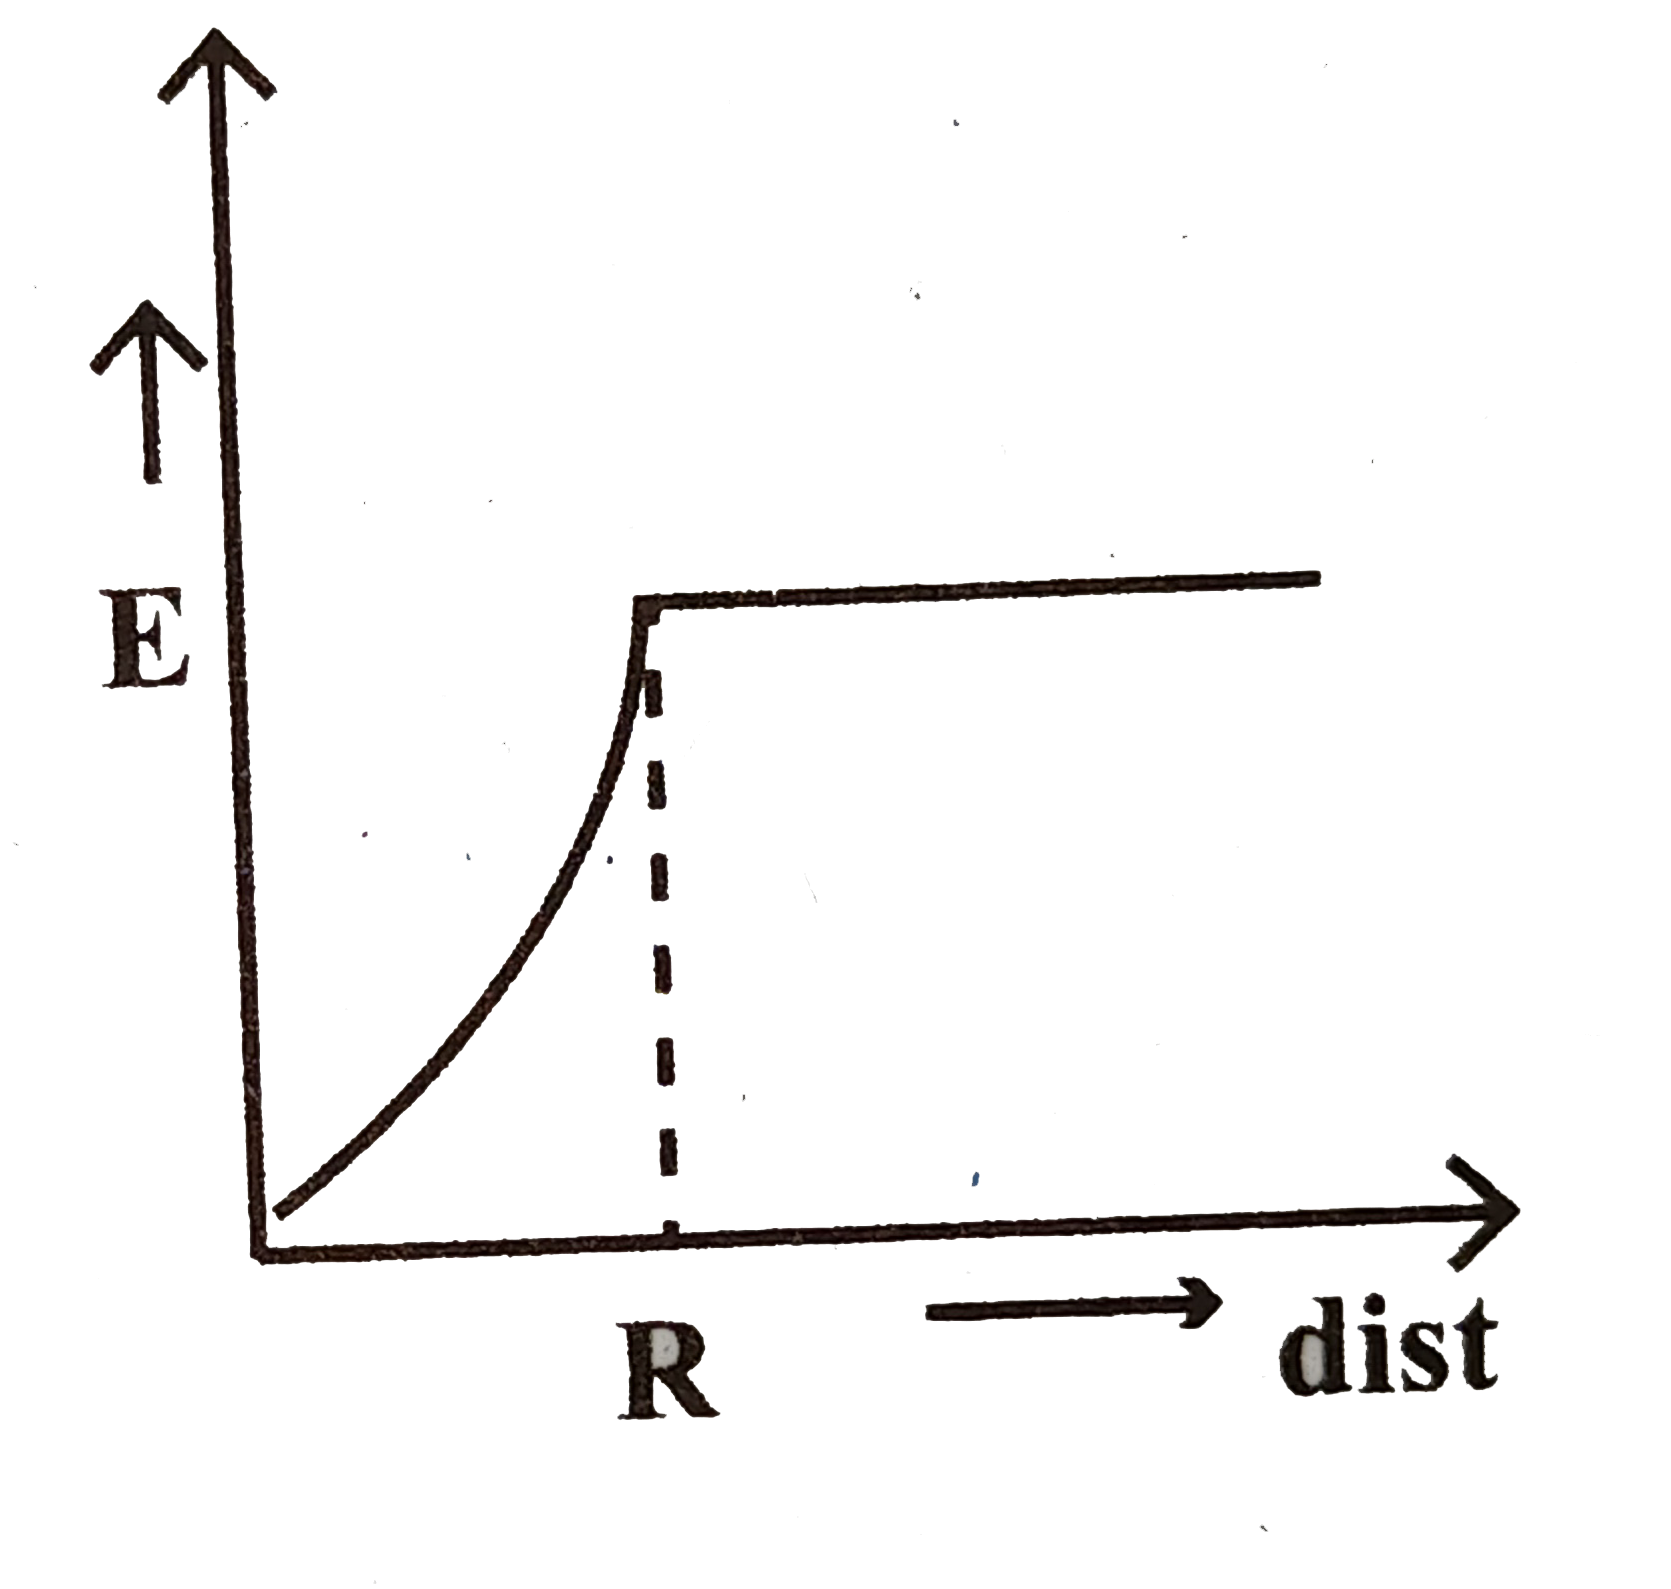
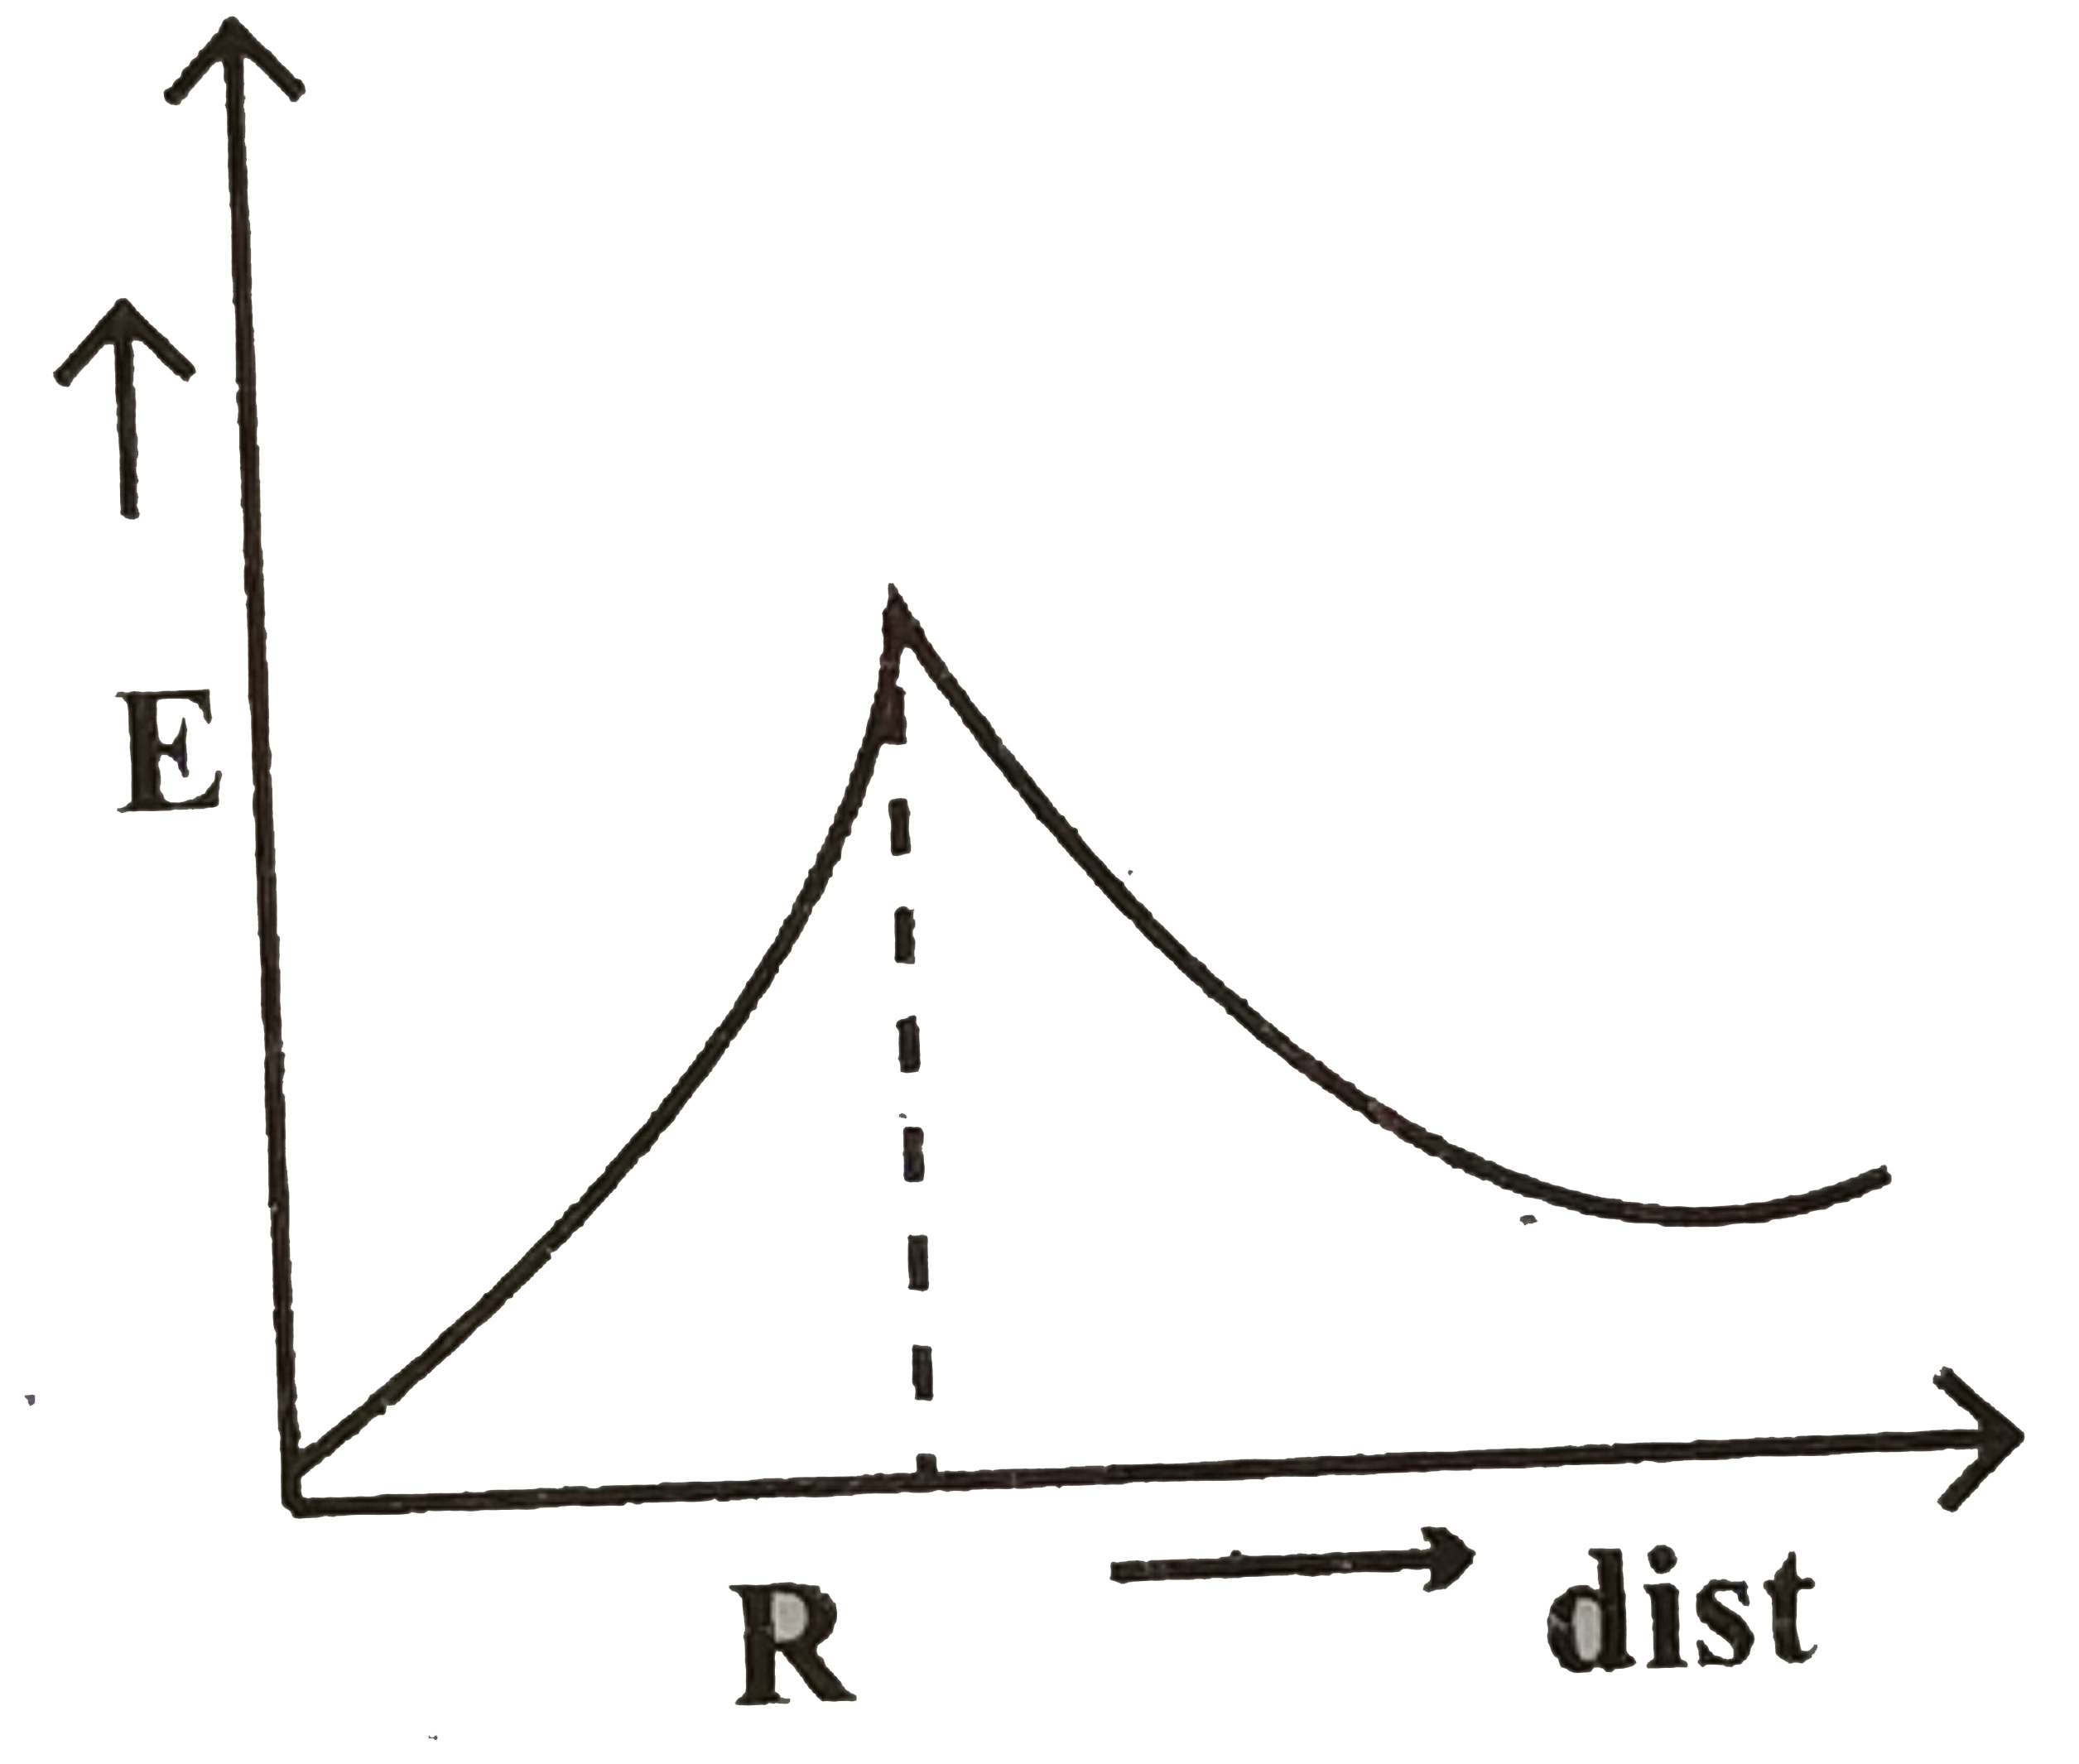
The correct Answer is:A
Similar Questions
Knowledge Check
Which of the following graph represents the variation of electric field E due to a thin charged spherical shell of radius R as a function of the distance r from the centre of the shell?
A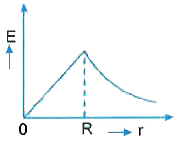 B
B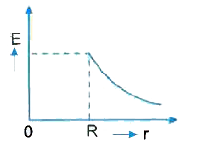 CD
CD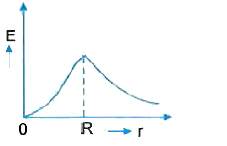
Graphical representation of electric field due to uniformly charged sphere of radius R as function of distance from its centre is given by:
A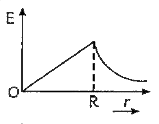 B
B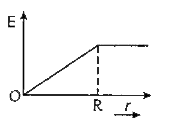 C
C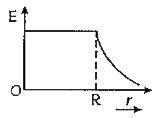 D
D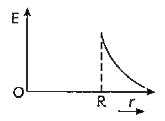
The electric field due to uniformly charged sphere of radius R as a function of the distance from its centre is represented graphically by
A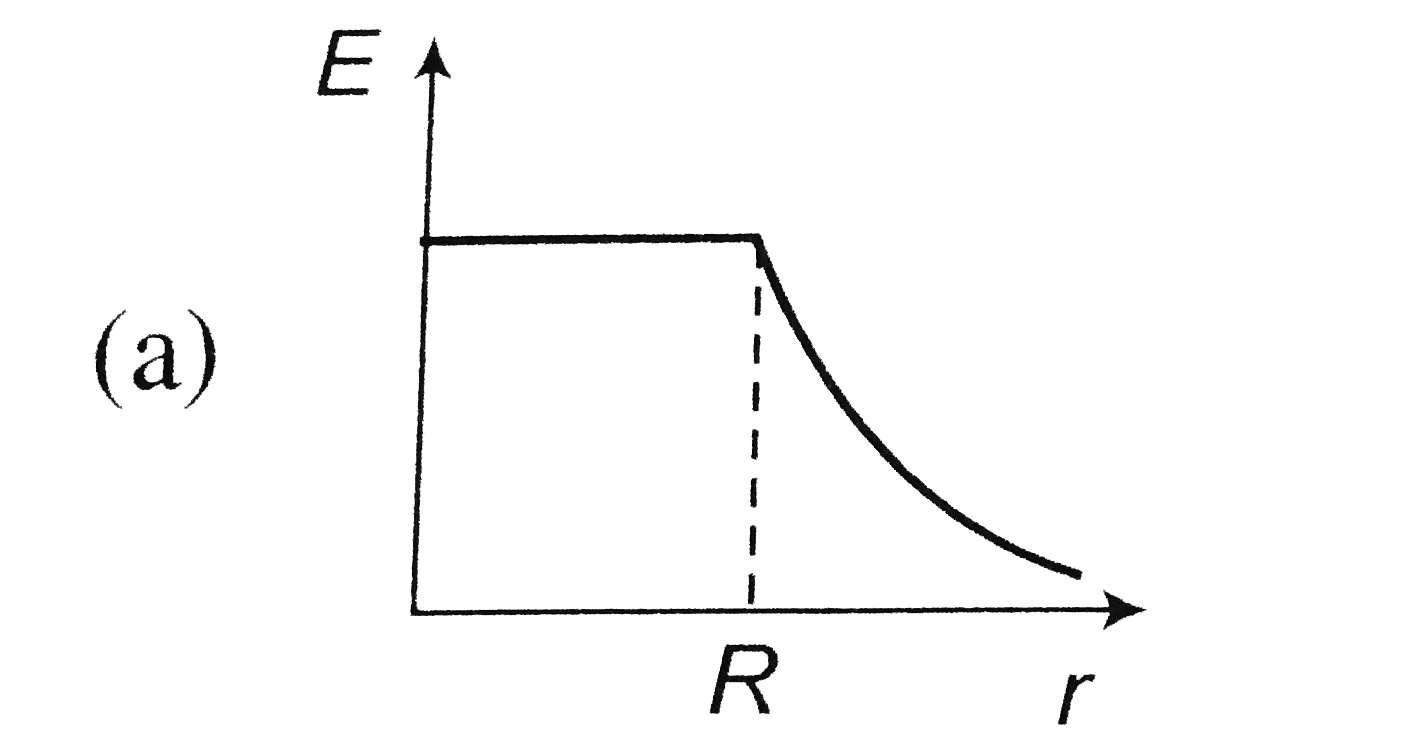 B
B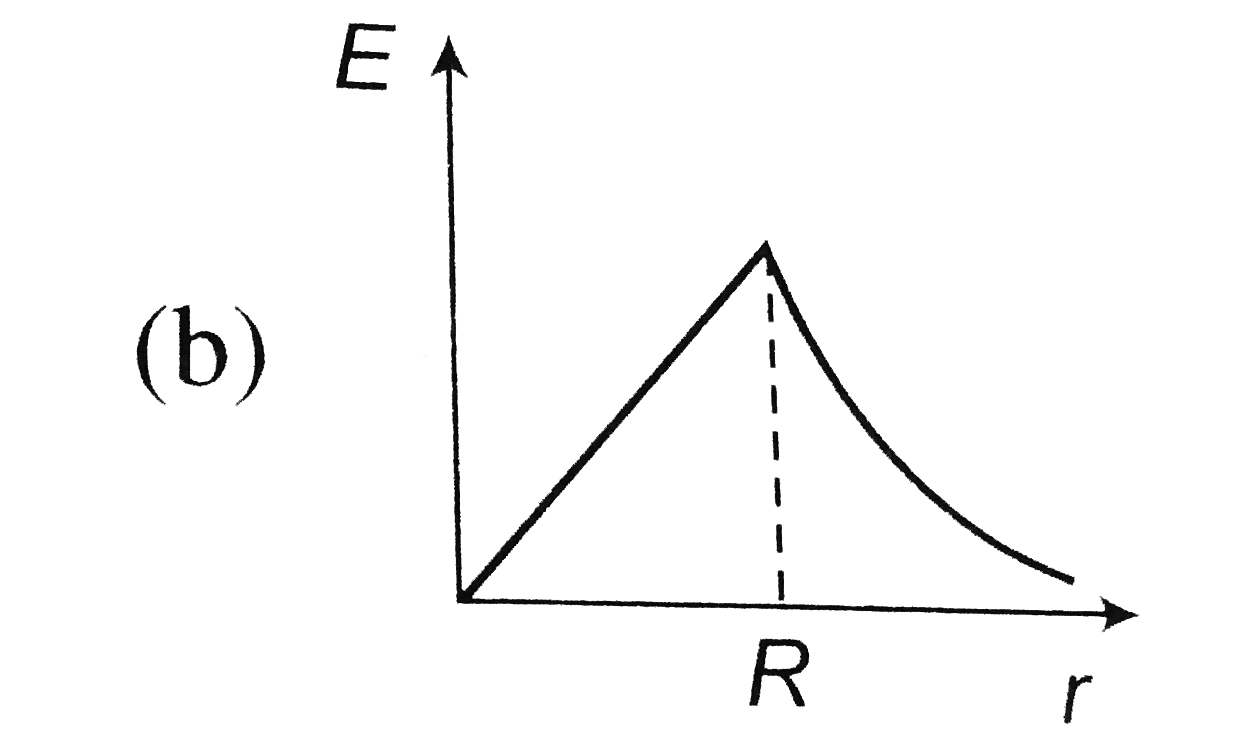 C
C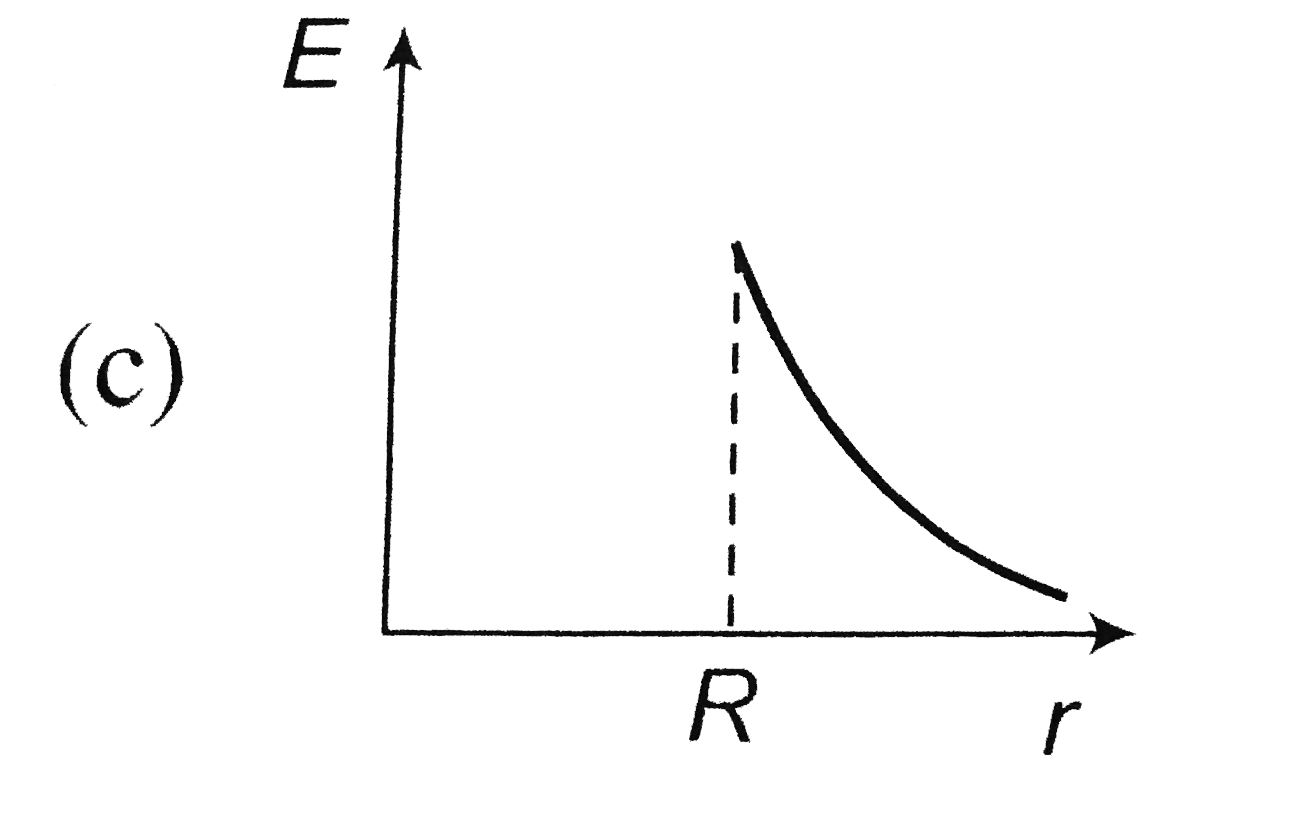 D
D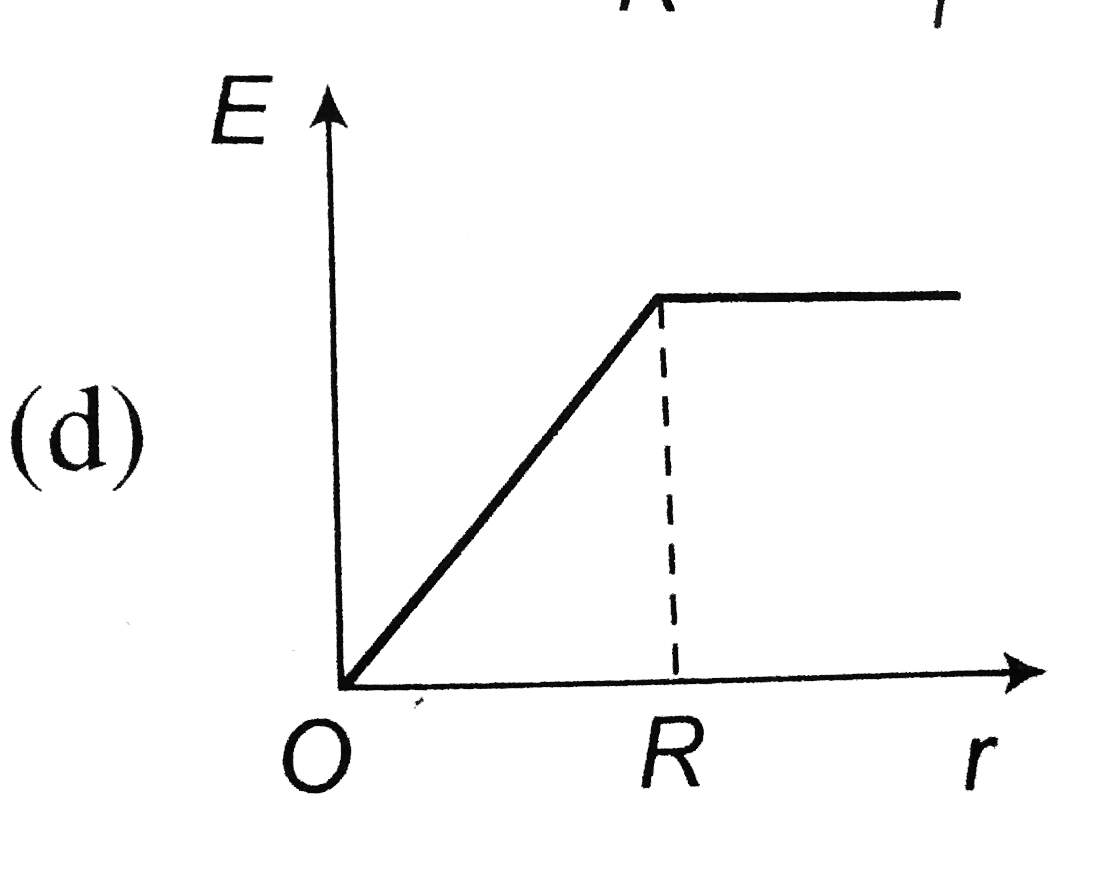
Using Gauss' law deduce the expression for the electric field due to uniformaly charged spherical conducting shell of radius R at point (i) outside ,and (ii) inside the shell.
Plot a graph showing variation of electric field as a functions or r for r< R and .(r being the distance from the centre of the shell).
View SolutionWhich graph best represents the variation of electric potential as a function of distance from the centre of a uniformly charged solid sphere of charge of radius R ?
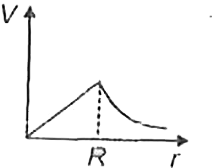
View SolutionUsing Gauss' law deduce the expression for the electric field due to a uniformly charged sperical conducting shell of radius R at a point (i) outside and (ii) inside the shell.
Plot a graph showing variation of electric field as a function of r>Randr<R. (r being the distance from the centre of the shell)
View Solution→E due to uniformly charged sphere of radius R as a function of distance from its centre is represented by:
View SolutionWhich graph best represents the variation of electric potential as a function of distance from the centre of a uniformly charged solid sphere of charge of radius R ?
View Solution
