The Table given below present the sunrise (SR) and sunset (SS) timings in a city during six consecutive days of a week. It is given that the total daylight time (in hrs) = T, and (12-T) expressed in hours is P.

If all P’s are represented through a pie chart, what will be the central angle (in degrees) of the sector representing D2?
96
108
126
135
The correct Answer is:B
Step by step video, text & image solution for The Table given below present the sunrise (SR) and sunset (SS) timings in a city during six consecutive days of a week. It is given that the total daylight time (in hrs) = T, and (12-T) expressed in hours is P. If all P’s are represented through a pie chart, what will be the central angle (in degrees) of the sector representing D2? by Maths experts to help you in doubts & scoring excellent marks in Class 14 exams.
Topper's Solved these Questions
- BOOK - SSC SELECTION POSTCHAPTER - SSC PREVIOUS YEAR PAPER GRADUATION LEVEL (17 JAN 2019 SHIFT 3)EXERCISE - Section: Graduation Level19videos
SSC PREVIOUS YEAR PAPER GRADUATION LEVEL (17 JAN 2019 SHIFT 3)
- BOOK - SSC SELECTION POSTCHAPTER - SSC PREVIOUS YEAR PAPER MATRIC LEVEL (14 NOV 2020 SHIFT 1)EXERCISE - Quantitative Aptitude25videos
SSC PREVIOUS YEAR PAPER MATRIC LEVEL (14 NOV 2020 SHIFT 1)
Similar Questions
The Table given below presents the Rainfall (in mm) in two cities on different days of a week.
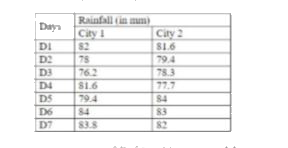
If the data of Rainfall of city 1 is represented through a Pie chart, then what will be the central angle (nearest to 0.1 degree) corresponding to D1?View SolutionThe Table given below presents the Rainfall (in mm) in two cities on different days of a week.
नीचे दी गयी तालिका दो शहरों में सप्ताह के अलग-अलग दिन हुई बारिश (मिमी में ) को दर्शाती है |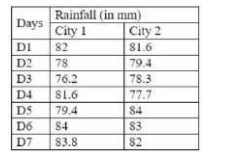 If the data of Rainfall of City 1 is represented through a Pie chart, then what will be the central
angle (nearest to 0.1 degree) corresponding to D1?
यदि शहर 1 की वर्षा के आंकड़ों को एक पाई-चार्ट में प्रस्तुत किया जाए, तो D1 के संगत केंद्रीय कोण ( 0.1 डिग्री के निकटतम ) का मान क्या होगा ?View Solution
Knowledge Check
- Question 1 - Select One
The Table given below present the sunrise (SR) and sunset (SS) timings in a city during six consecutive days of a week. It is given that the total daylight time (in hrs) = T, and (12-T) expressed in hours is P.

On which day P is zero?AD4BD5CD2DD3 - Question 2 - Select One
The Table given below present the sunrise (SR) and sunset (SS) timings in a city during six consecutive days of a week. It is given that the total daylight time (in hrs) = T, and (12-T) expressed in hours is P.
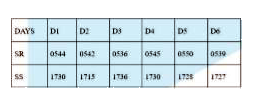
What is average of P for D3 to D6 (correct up to two decimal places)?A0.15B0.20C0.12D0.18 - Question 3 - Select One
Expenses (in multiples of ₹10,000/-) on consumption of fuel for the official car at a regional office (RO) of a national organization during 2006-2010 is given below in a tabular form along with the National Average (NA) during the said period. It is given that there are five ROs.
Year20062007200820092010RO2022232425NA1817191823
If the data of the RO is represented through a pie chart, Then what would be the central angle (nearest to degree) of the sector corresponding to the year 2008?
(a)68∘
(b)70∘
(c)76∘
(d)73∘A68∘B70∘C76∘D73∘
The pie chart given below shows the percentage of time taken by different processes in making a car
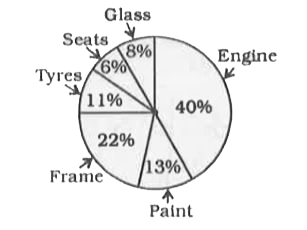
15% of total time is spent on quanlity check and this time is equalty check and this time is equally taken from all other processes . So what will be the new sectorial angle (in degrees) made by total time of seats and glass ?View SolutionTable shows the production of rice (in million tonnes) of three states over six years.
यह तालिका तीन राज्यों में छः वर्षों में दौरान चावल के उत्पादन ( मिलियन टन में ) को दर्शाती है | If the data related to the total production in all three states over these six years is represented in a pie chart, then what will be the central angle of the sector representing the year 2014 ? ( to the nearest whole number )
यदि सभी छ: वर्षों में तीनों राज्यों के कुल उत्पादन के आंकड़ों को वृत्त-आरेख (पाई-चार्ट) के रूप में दर्शाया जाए, तो वर्ष 2014 को दर्शाने वाले त्रिज्यखंड (सेक्टर) का केंद्रीय कोण क्या होगा ? (निकटतम पूर्ण संख्या में )View SolutionThe table shows the number of cars sold by three showrooms over a period of six years.
यह तालिका तीन शोरूम द्वारा छः वर्षों की अवधि में बेची गयी कारों की संख्या दर्शाती है |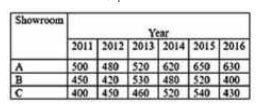 If the total number of cars sold by all three showrooms over the years is represented as a pie-chart, what is the central angle of the sector representing the total number of cars sold in the year 2013 (to the nearest whole number)?
यदि तीनों शोरुम द्वारा इन वर्षों के दौरान बेची गयी कारों की कुल संख्या को एक पाई-चार्ट में प्रस्तुत किया जाए, तो वर्ष 2013 में बेची गयी कारों की कुल संख्या को दर्शाने वाले त्रिज्यखंड का केंद्रीय कोण क्या होगा? ( निकटतम पूर्ण संख्या में )View SolutionThe table shows the number of cars sold by three showrooms over a period of six year.
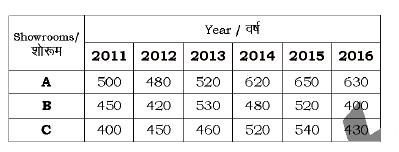
The total number of cars sold by all three showrooms over the years is represented as a pie chart, what is the central angle of the sector representing the total number of cars sold in the year 2013View SolutionThe given pie-chart represents the distribution of the percentage of sales of a particular brand of car from five showrooms A, B, C, D and E during 2018. The total number of cars sold during that year from the five showrooms is 5000.
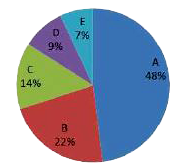
What is the central angle (nearest to 0.1 degree) of the sector corresponding to the sales from the showroom C?View Solution

