The Table given below present the sunrise (SR) and sunset (SS) timings in a city during six consecutive days of a week. It is given that the total daylight time (in hrs) = T, and (12-T) expressed in hours is P.
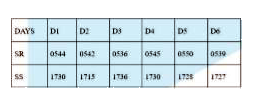
What is average of P for D3 to D6 (correct up to two decimal places)?
0.15
0.20
0.12
0.18
The correct Answer is:B
Step by step video, text & image solution for The Table given below present the sunrise (SR) and sunset (SS) timings in a city during six consecutive days of a week. It is given that the total daylight time (in hrs) = T, and (12-T) expressed in hours is P. What is average of P for D3 to D6 (correct up to two decimal places)? by Maths experts to help you in doubts & scoring excellent marks in Class 14 exams.
Topper's Solved these Questions
- BOOK - SSC SELECTION POSTCHAPTER - SSC PREVIOUS YEAR PAPER GRADUATION LEVEL (17 JAN 2019 SHIFT 3)EXERCISE - Section: Graduation Level19videos
SSC PREVIOUS YEAR PAPER GRADUATION LEVEL (17 JAN 2019 SHIFT 3)
- BOOK - SSC SELECTION POSTCHAPTER - SSC PREVIOUS YEAR PAPER MATRIC LEVEL (14 NOV 2020 SHIFT 1)EXERCISE - Quantitative Aptitude25videos
SSC PREVIOUS YEAR PAPER MATRIC LEVEL (14 NOV 2020 SHIFT 1)
Similar Questions
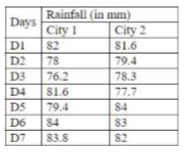
The Table given below presents the Rainfall (in mm) in two cities on different days of a week.
What is the difference (correct up to two decimal places) in average rainfall in two cities per day?
 View Solution
The Table given below presents the Rainfall (in mm) in two cities on different days of a week.
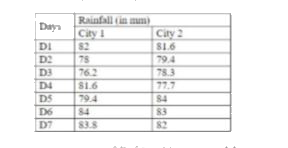
If the data of Rainfall of city 1 is represented through a Pie chart, then what will be the central angle (nearest to 0.1 degree) corresponding to D1?View Solution
Knowledge Check
- Question 1 - Select One
The Table given below present the sunrise (SR) and sunset (SS) timings in a city during six consecutive days of a week. It is given that the total daylight time (in hrs) = T, and (12-T) expressed in hours is P.

On which day P is zero?AD4BD5CD2DD3 - Question 2 - Select One
The Table given below present the sunrise (SR) and sunset (SS) timings in a city during six consecutive days of a week. It is given that the total daylight time (in hrs) = T, and (12-T) expressed in hours is P.

If all P’s are represented through a pie chart, what will be the central angle (in degrees) of the sector representing D2?A96B108C126D135 - Question 3 - Select One
The pie Chart given below presents the number of laptops as a percentage of the total number of laptops in an office delivered by six different companies.
The central angles shown in the Pie Chart are not as any chosen scale.
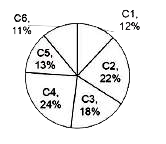
What is the central angle in degrees (correct up to one decimal place) corresponding to the laptops delivered by Company C6 ?Aa. 51.7∘Bb. 39.6∘Cc. 45.1∘Dd. 52.8∘
The Table given below presents the Rainfall (in mm) in two cities on different of a week.
The rainfall on day D2 in city 1 is how much percent more than the rainfall on day D4 in City 2?
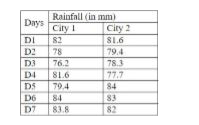 View Solution
The Table given below presents the Rainfall (in mm) in two cities on different days of a week.
नीचे दी गयी तालिका दो शहरों में सप्ताह के अलग-अलग दिन हुई बारिश (मिमी में ) को दर्शाती है |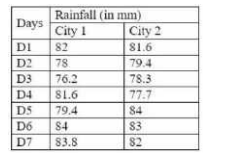 What is the difference (correct up to two decimal places) in average rainfall in two cities per day?
प्रति दिन इन दो शहरों में होने वाली औसत वर्षा में क्या अंतर ( दशमलव के दो स्थान तक) है ?View SolutionThe Bar graph given below presents the number of female employees working in two factories on six different days of a week.
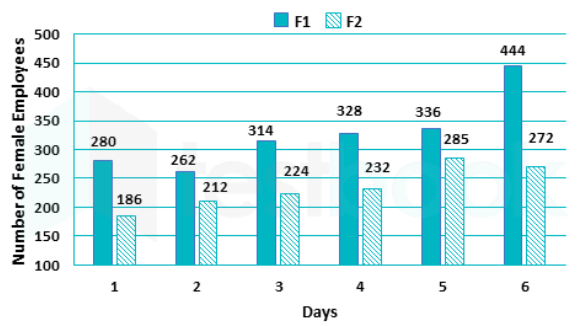
What is the difference (correct up to two decimal places) in the average number of females working per day in a factory F1 and the average number of females working per day in a factory F2?View SolutionThe Table given below presents the annual expenses (in thousands ) on various heads made by a firm during 2006-2010. By how much percentage (correct up to two decimal places ) is the average expenditure on purchases more than the average expenditure on rent ?
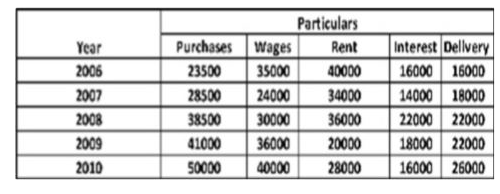 View Solution
The table given below presents the number of books on different subjects kept on separate shelves. Subjects with odd and even numbers are of Arts and Science respectively.
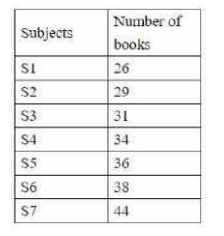 The number of books of S3 is what percent (correct to one decimal place) of the average number of Science books? View Solution
