An A.C. source of variable frequency f is connected to an LCR series circuit. Which one of the graphs represents the variation of current I in the circuit with frequency f?
A
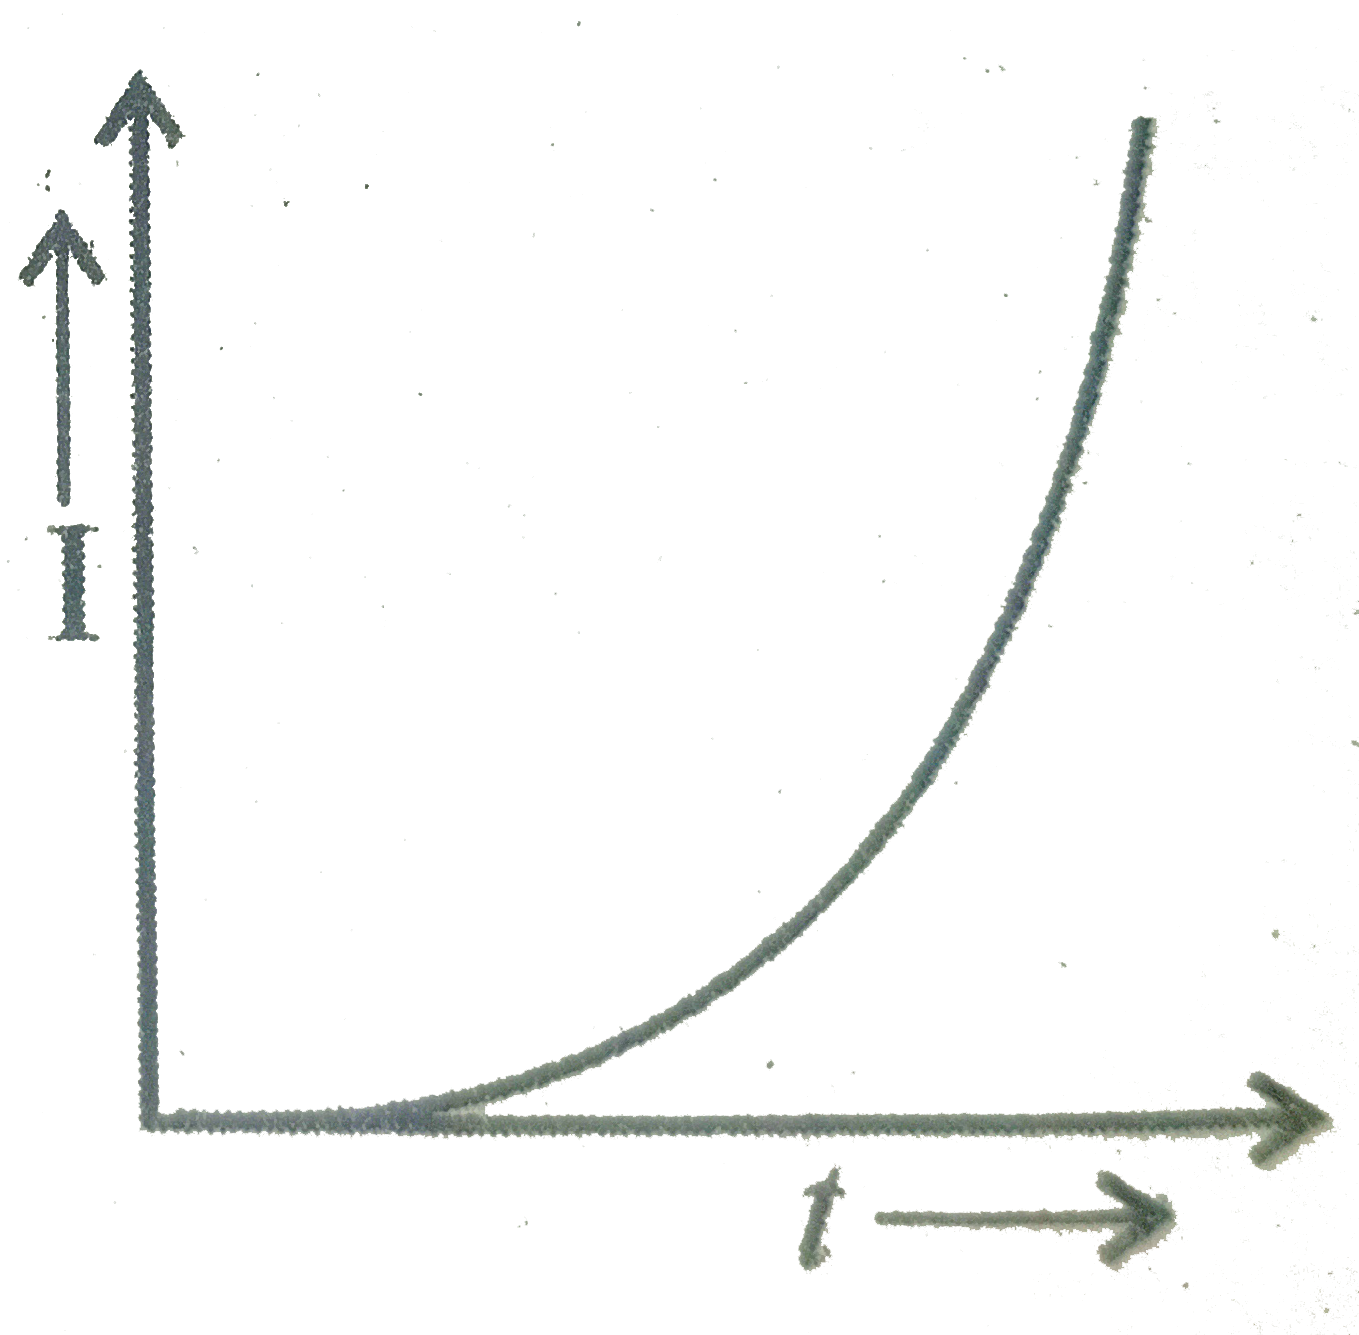
B
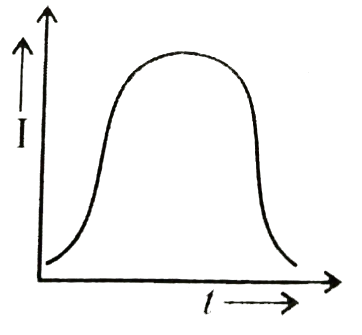
C
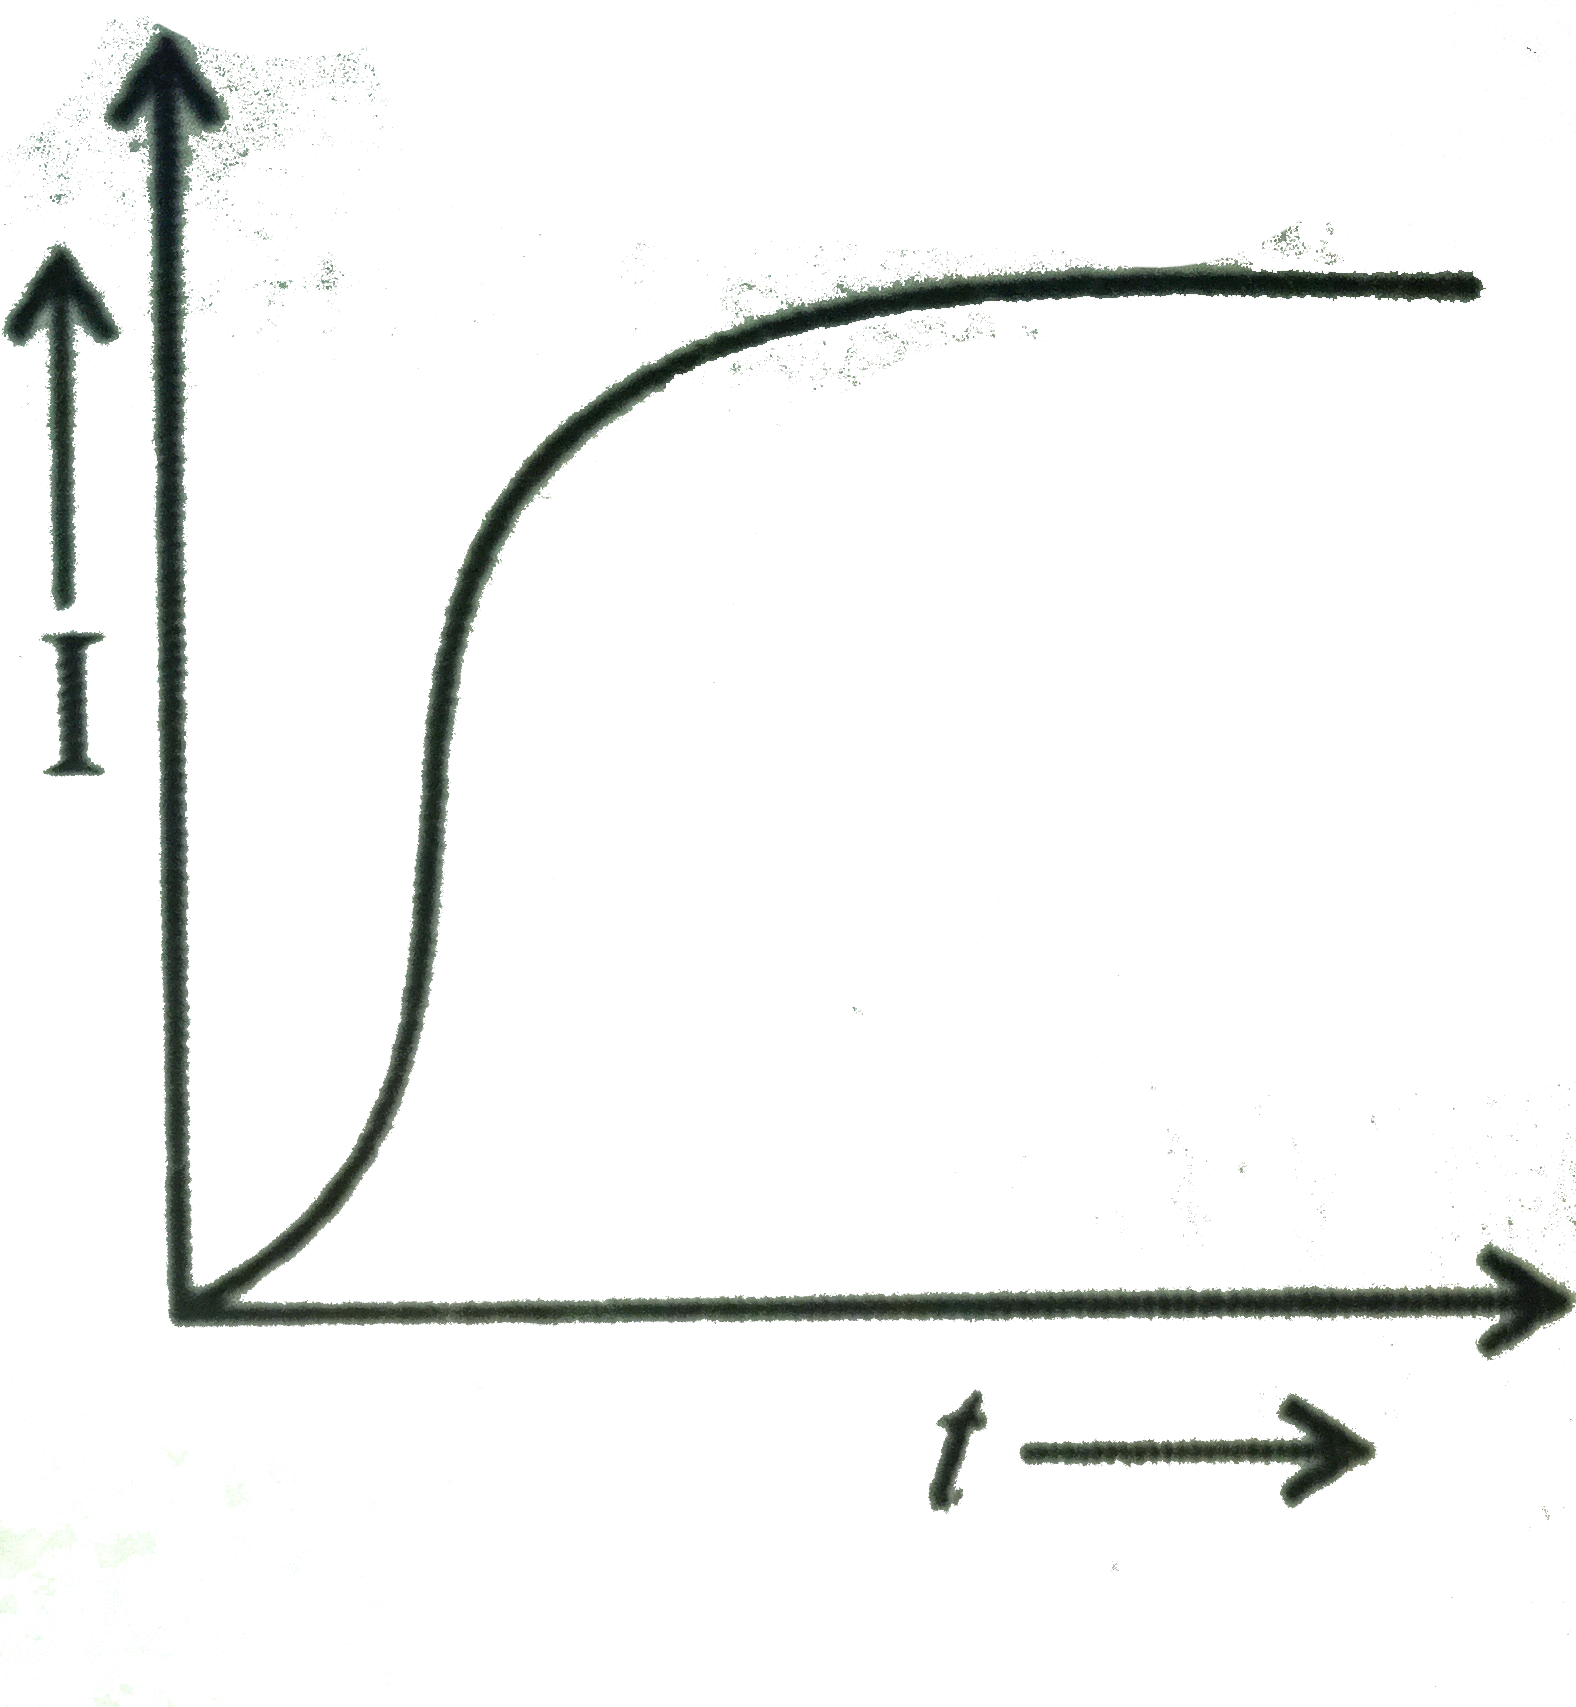
D
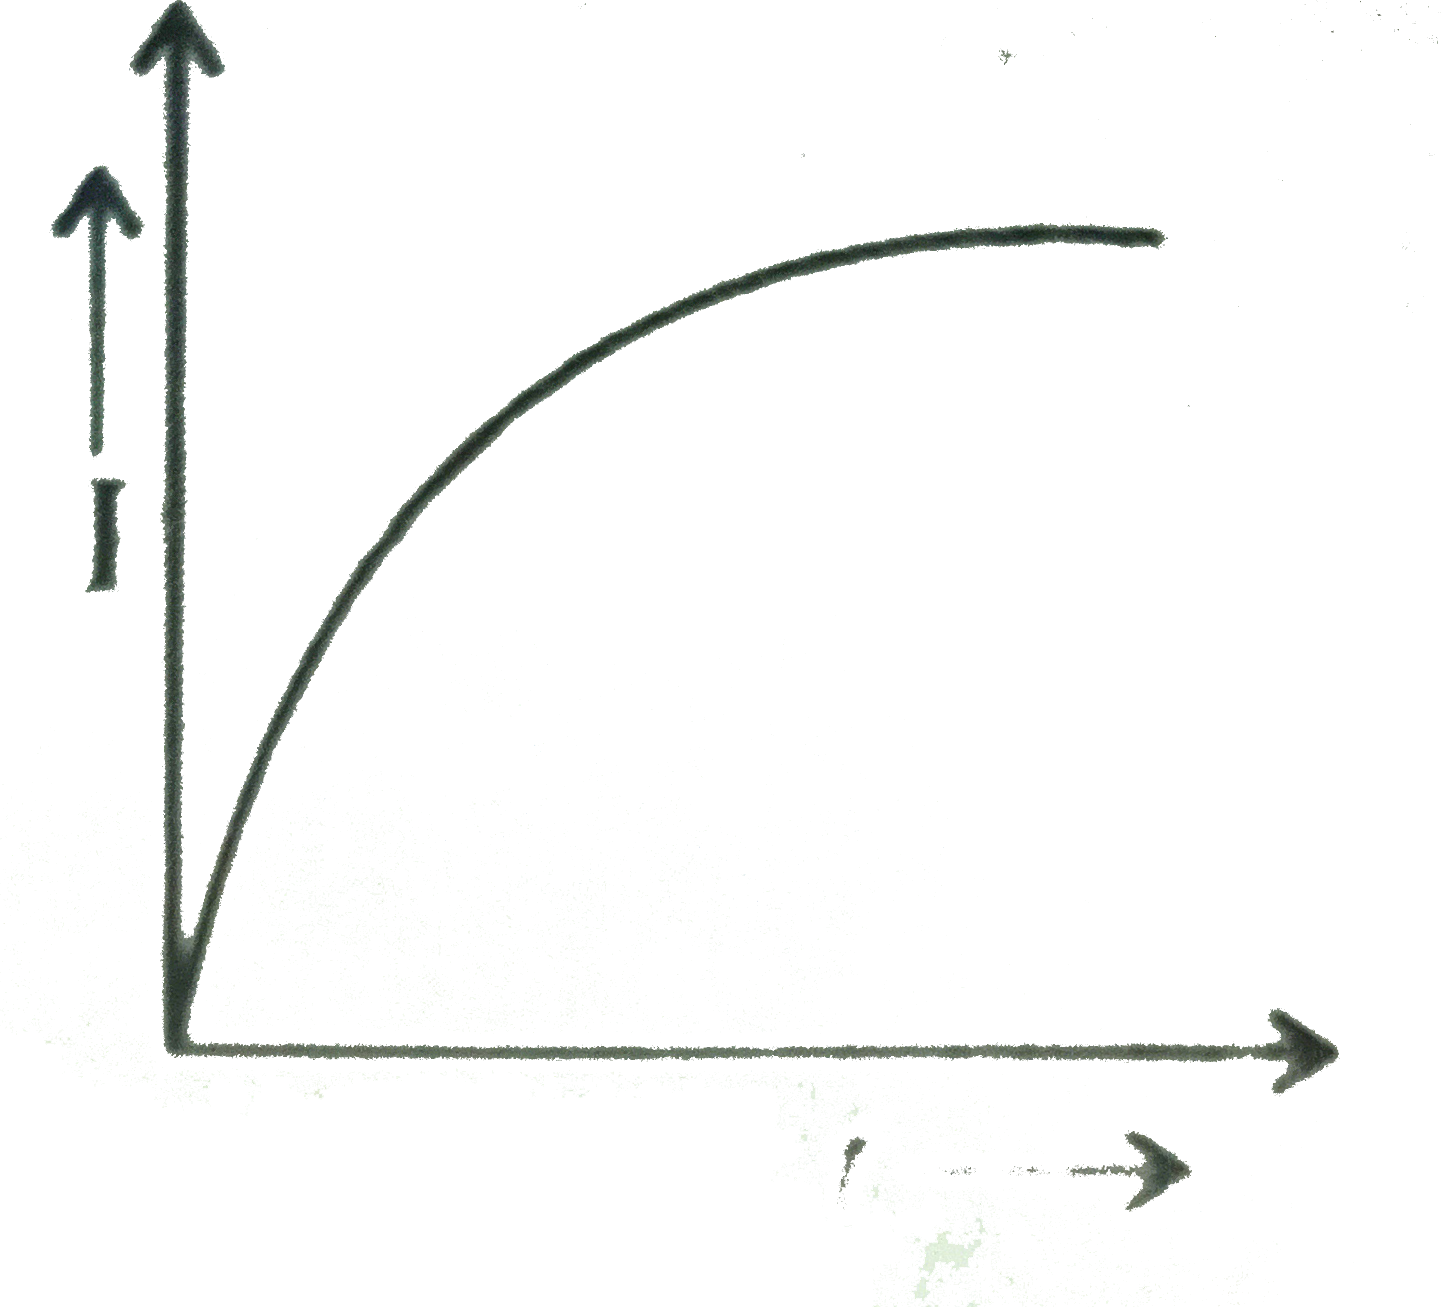
Text Solution
The correct Answer is:B
I=V√R2+(ωL−1ωC)2
where ω=2πr
In increases with increase in ω upto ω=ωc is given by
ωL=1ωC
When I will be maximum.
At ω>ωc I decreases with increase in ω. Hence the correct graph is (b).
|
Updated on:21/07/2023
Similar Questions
Knowledge Check
- Question 1 - Select One
An AC source of variable frequency f is connected to an LCR series circuit. Which one of the graphs in figure represents the variation of current of current I in the circuit with frequency f?
A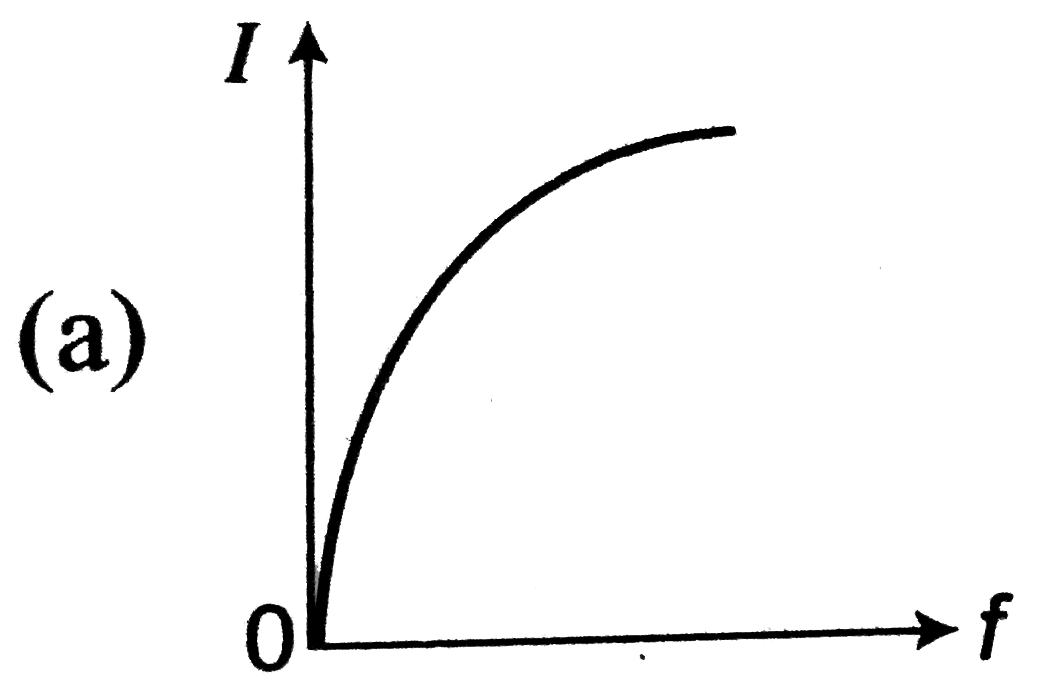 B
B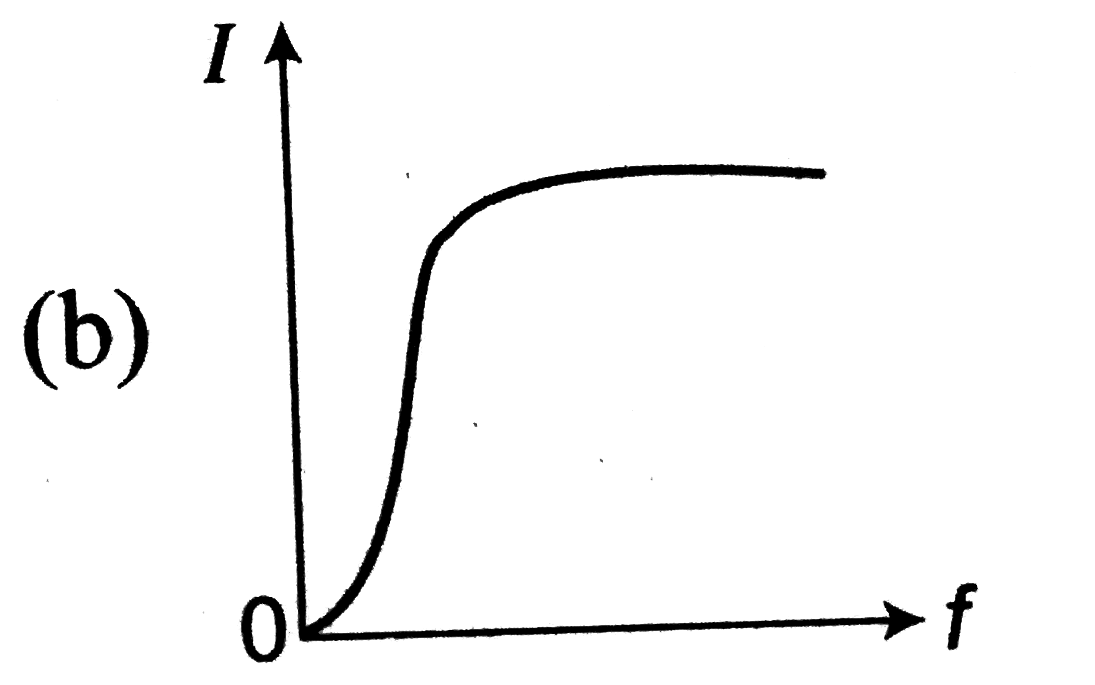 C
C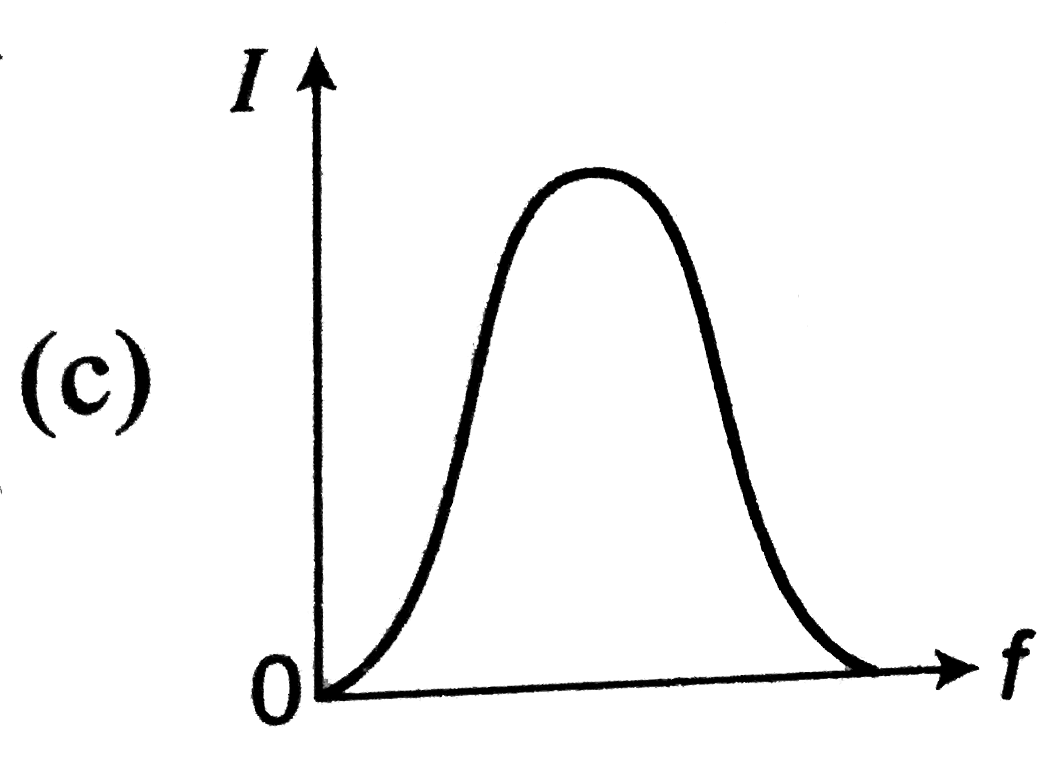 D
D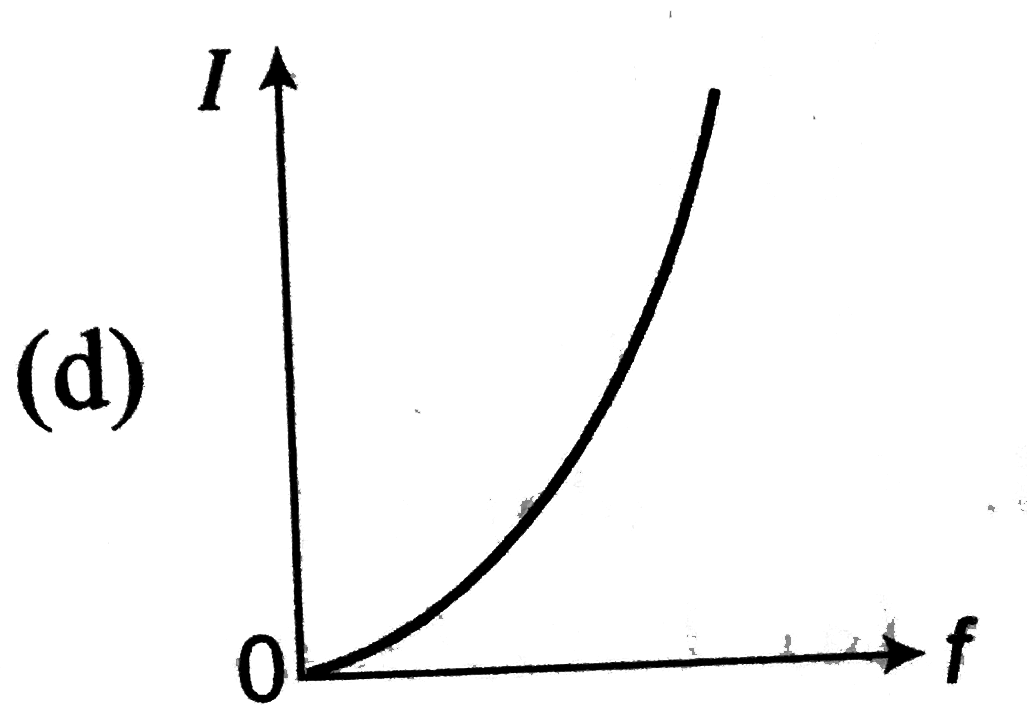
- Question 2 - Select One
An a.c. source of variable angular frequency o is connected to an LCR series circuit. Which one of the following graphs correctly represents variation of impedance Zof a.c. circuit with angular frequency ω?
A B
B C
C D
D
- Question 3 - Select One
Which of the following curves represents the variation of impedance (Z) with frequency f in series LCR circuit?
A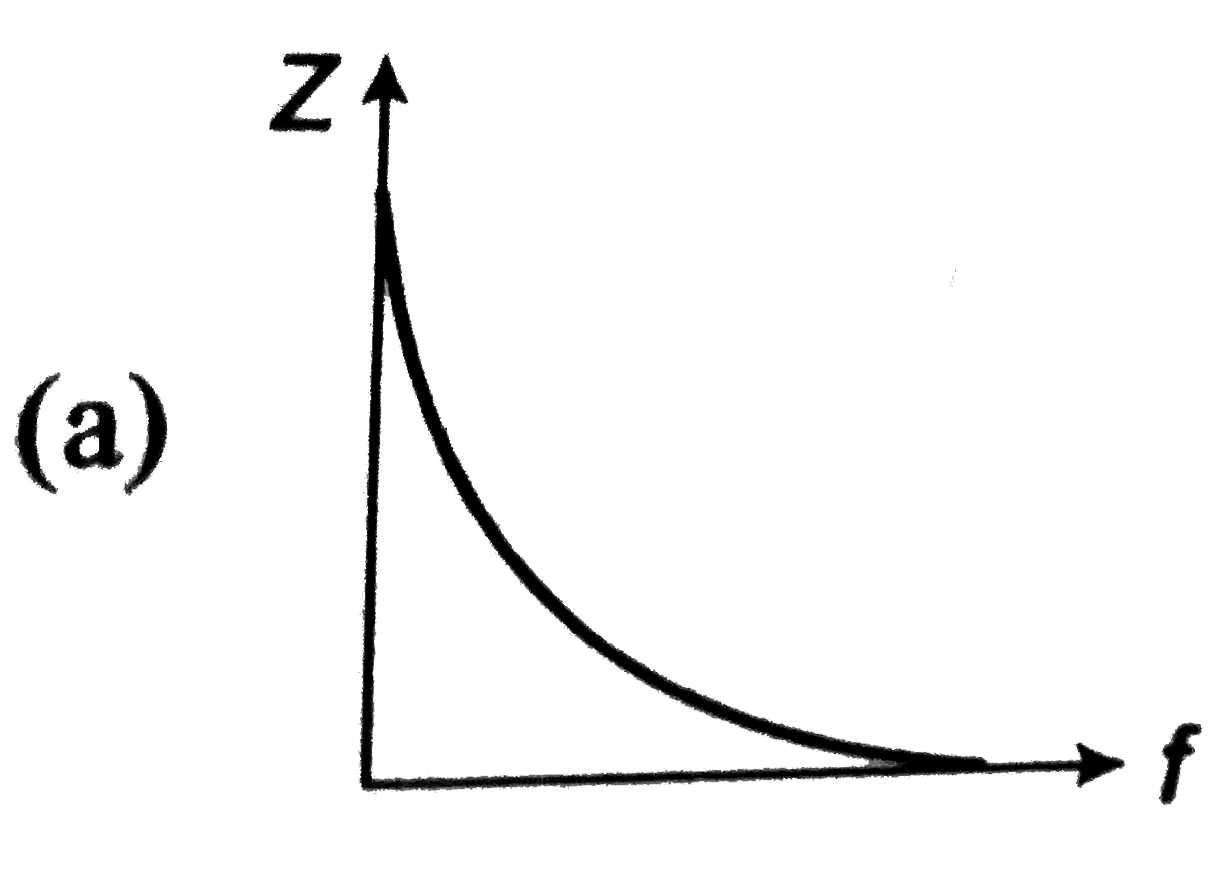 B
B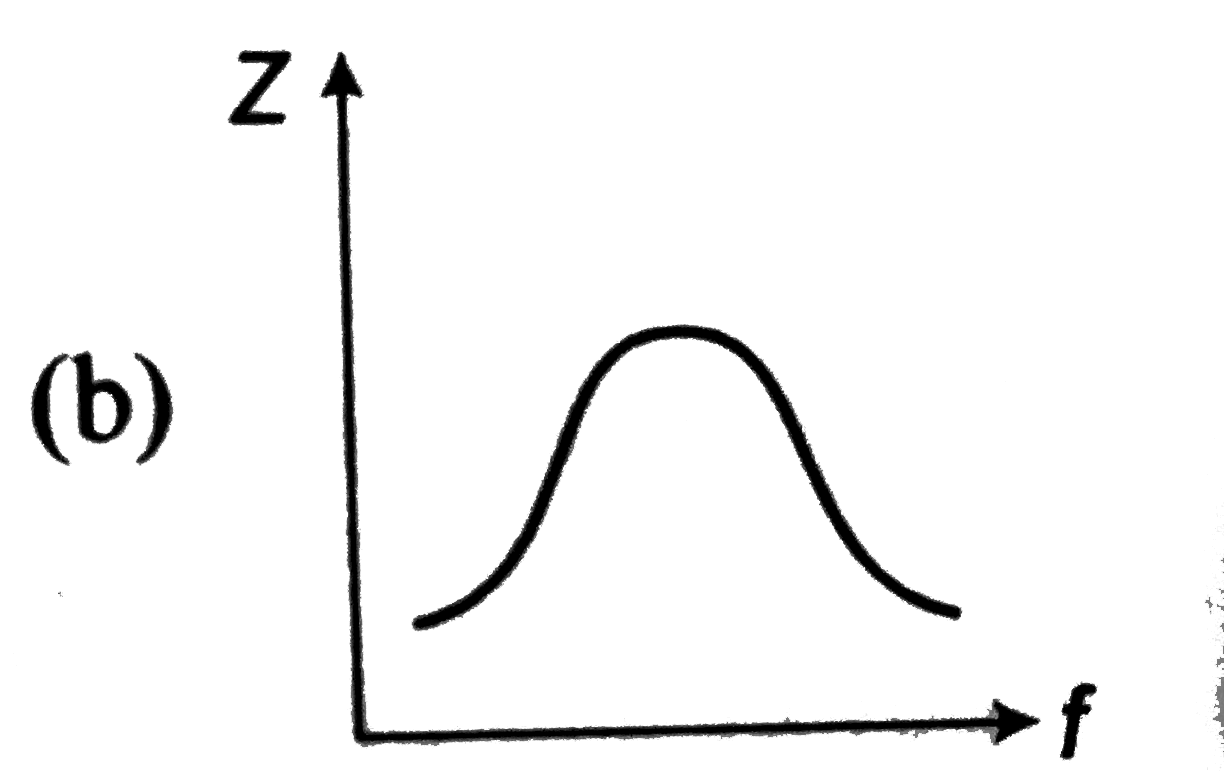 C
C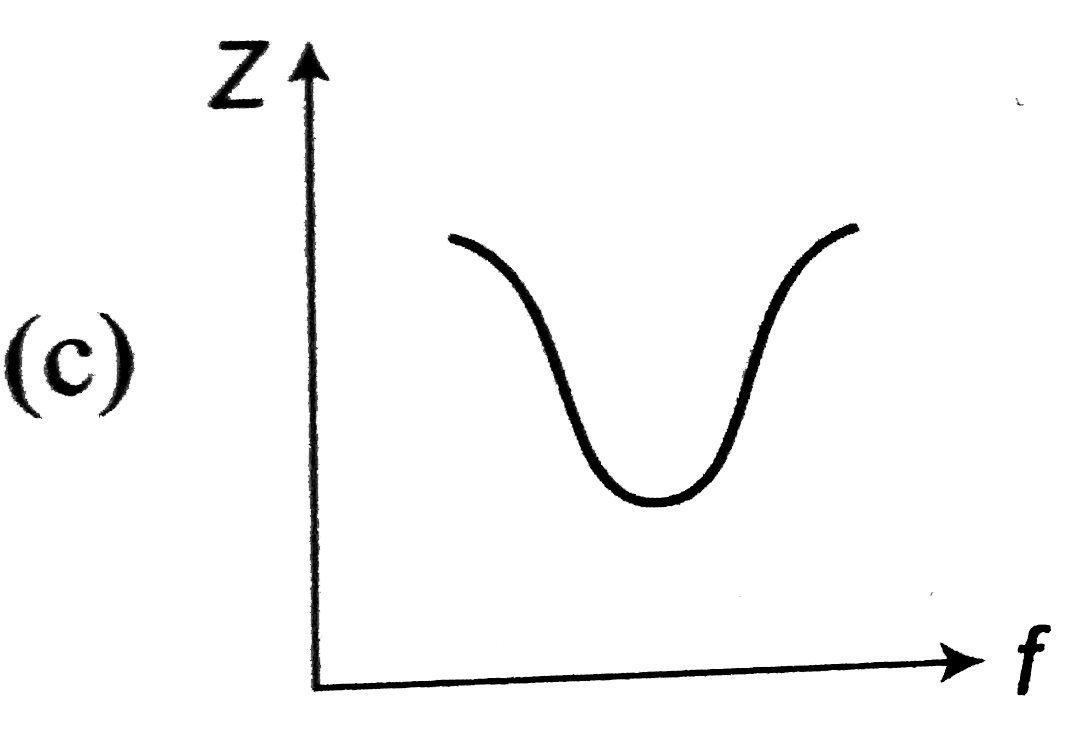 D
D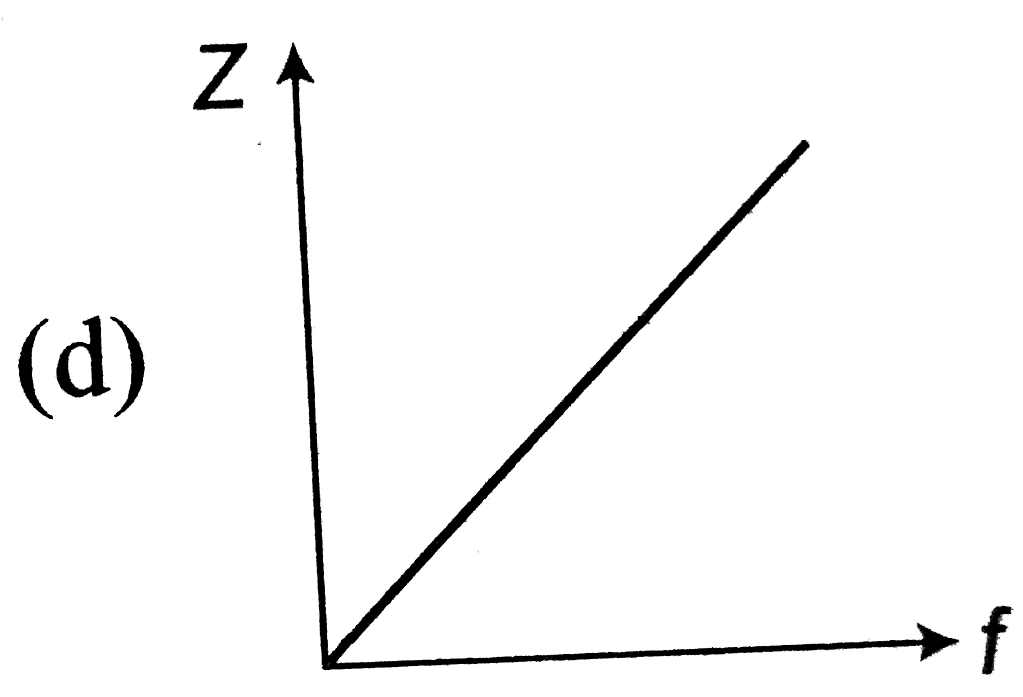
Mention the factors on which the resonant frequency of a series LCR circuit depends. Plot a graph showing variation of impedance of a series LCR circuit with the frequency of the applied a.c. source.
View SolutionWhich of the following graphs represent the variation of current(I) with frequency (f) in an AC circuit containing a pure capacitor?
View SolutionA variable frequency a.c. source is connected to a capacitor. Will the displacement current change if the frequency of the a.c. source is decreased ?
View SolutionAt resonant frequency the current amplitude in series LCR circuit is
View SolutionAt resonant frequency the current amplitude in series LCR circuit is
View Solution
