According to the given graph, between which two consecutive months was the change in the auto sales the greatest?
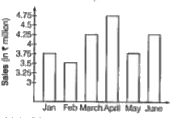
April-May
May-June
January-February
February-March
The correct Answer is:A
Topper's Solved these Questions
- DATA HANDLING BOOK - ARIHANT PUBLICATION PUNJABCHAPTER - DATA HANDLING EXERCISE - CHAPTER EXERCISE
50 Videos
- ALGEBRA BOOK - ARIHANT PUBLICATION PUNJABCHAPTER - ALGEBRA EXERCISE - CHAPTER EXERCISE
73 Videos
- DATA HANDLING AND PATTERNSBOOK - ARIHANT PUBLICATION PUNJABCHAPTER - DATA HANDLING AND PATTERNSEXERCISE - Chapter Exercise
50 Videos
Similar Questions
Knowledge Check
According to the given graph , between which two consecutive months was the changes in the auto sales the greatest ?
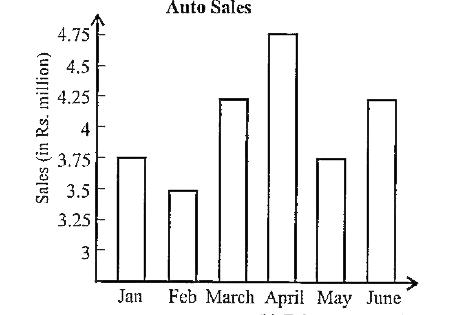 AJanuary-FebruaryBFebruary-MarchCMarch-MayDMay-June
Distance between two consecutive crests is
AλBλ/2Cλ4D2λThe distance between two consecutive antinodes is,
A2λ,Bλ4Cλ2Dλ
The following bar graph shows the number of deaths from road accidents occurred during the rainy season in the year 1992. Study the graph carefully and answer the question.
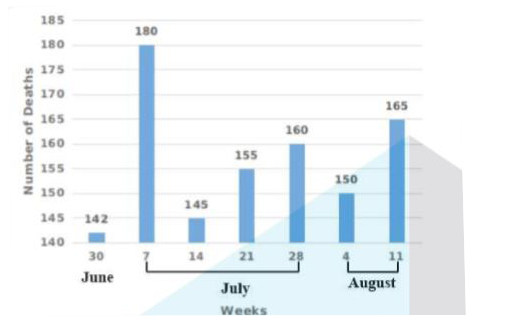
Between which two consecutive weeks was the rise in the number of deaths the greatest?
View SolutionThe following bar graph shows the number of deaths from road accidents occurred during the rainy season in the year 1992. Study the graph carefully and answer the question.
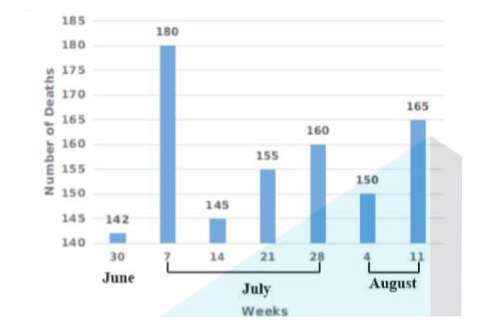
Between which two consecutive weeks was the fall in the number of deaths the greatest?
View SolutionWhat is the distance between two consecutive nodes and two consecutive antinodes ?
View SolutionProblems in which product of two consecutive no is given
View SolutionThe distance between two consecutive crests is L, then the wavelength is given by
View Solution

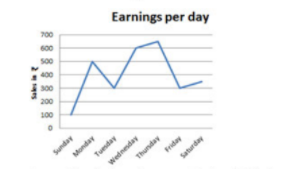 According to the given graph, the highest earnings was on: