The given Venn diagram shows a total of 50 students who appeared for three different examinations : A, B, and C. All have appeared for at least one examination. How many appeared for examination A and B but not C ?
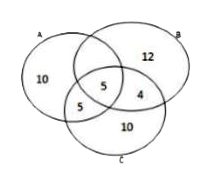
A) 5
B) 10
C) 4
D) 6
The correct Answer is:B
Step by step video, text & image solution for The given Venn diagram shows a total of 50 students who appeared for three different examinations : A, B, and C. All have appeared for at least one examination. How many appeared for examination A and B but not C ? by Maths experts to help you in doubts & scoring excellent marks in Class 14 exams.
Similar Questions
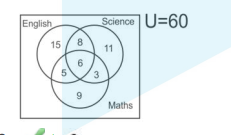
The given Venn diagram shows the number of students who have passed in the three exams, viz, english, science and Maths. How many students failed in all the three exams?
 View Solution
In an examination, 8% of the students fail. What percentage of the students pass? If 1650 students appeared in the examination, how many passed?
View Solution
Knowledge Check
- Question 1 - Select One
In an examination 74% of the candidates passed and 156 failed. The candidates who appeared in the examination were
A211B400C500D600 - Question 2 - Select One
Study the following table and answer question.
Number of students appeared in an examination from five citie s:
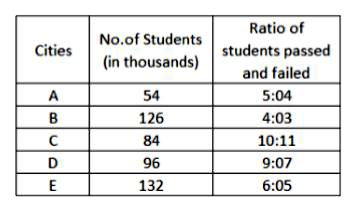
The total number of students who appeared in the examination from cities C and D is what percent more than the total number of students who failed in cities A, B and E ? (nearest to an integer)A44B30C41D42 - Question 3 - Select One
In an examination ,92% of the students passed and 480 students failed.If so, how many students appeared in the examinations?
A6000B5000C5800D6200
The given bar graph represents the number of students who appeared in the board examination in session 2017-18 and 2018-19. Study the graph and answer the question that follows.
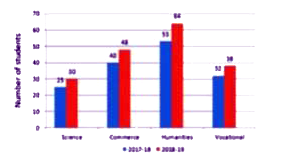
What percentage is the total number of students who appeared in 2017-18 is less than the total number of students who appeared in 2018-19?View SolutionThe given bar graph represents the number of students who appeared in the board examination in session 2017-18 and 2018-19. Study the graph and answer the question that follows.
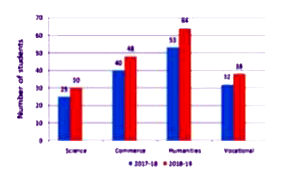
What is the ratio of the total number of students appeared in examination in 2017-18 and 2018-19?View Solution2,71,855 students appeared at an examination. Out of them 1,27,968 failed. How many students passed ?
View SolutionSuppose n students appear in an examination. Let X = the number of students who pass the examination. Suppose P(X=k)=λk2, then value of λ is
View SolutionRohit ranks sixteenth from the top and forty ninth from the bottom in an examination. Nine students did not appear in the examination. How many students were there in a class?
View Solution

