Read the following graph carefully and answer the questions given below.
Percentage of cars of 6 different models produced by a company in two years.
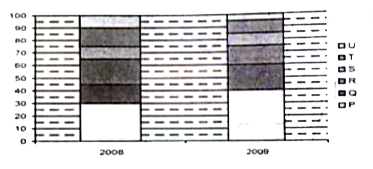
What is the percentage increase in a number of car of Q model from 2008 to 2009 ?
68
65
60
62
The correct Answer is:C
Topper's Solved these Questions
Similar Questions
Knowledge Check
Read the following graph carefully and answer the questions given below.
Percentage of cars of 6 different models produced by a company in two years.
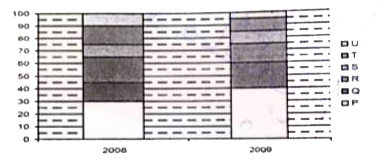
What is the total number of cars of P, Q and T models in year 2008 ?A2,85,000B2,18,000C2,70,000D2,50,000Read the following graph carefully and answer the questions given below.
Percentage of cars of 6 different models produced by a company in two years.
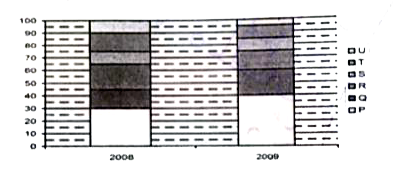
What is the difference between number of T model cars in year 2008 and 2009 ?A12500B14500C15000Dnone of theseRead the following graph carefully and answer the questions given below.
Percentage of cars of 6 different models produced by a company in two years.
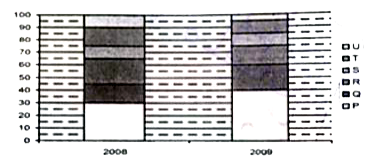
In 2009 the number of P model cars is what percent that of U model cars ?A400B800C600D200
Read the following graph carefully and answer the questions given below:
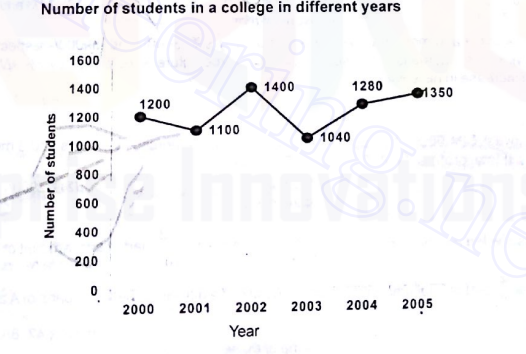
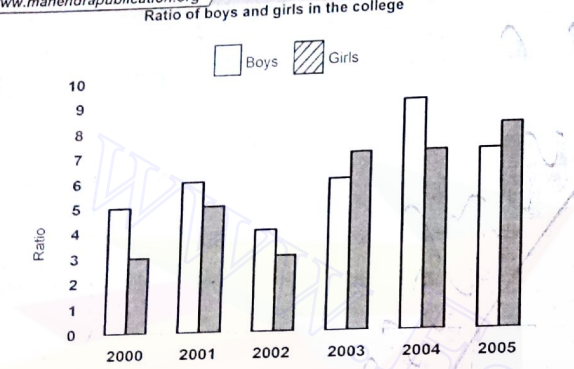
What is the difference between the number of boys and girls in the year 2004 ?
View SolutionRead the following graph carefully and answer the questions given below.
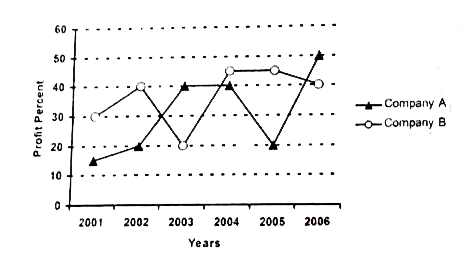
In which year the average of the profit percent of the both companies was the maximum ?
View SolutionStudy the following graph carefully and answer the question given below.
The graph gives the three types of mobile phones manufactured by a company over the years.
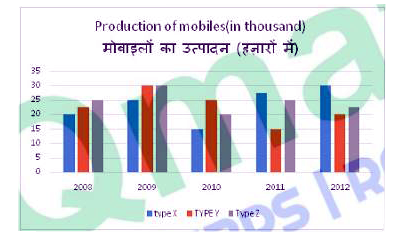
What is the percentage drop in the number of Z type mobiles manufactured from 2009 to 2010 ?
View SolutionStudy the following graph carefully to answer the questions given below.
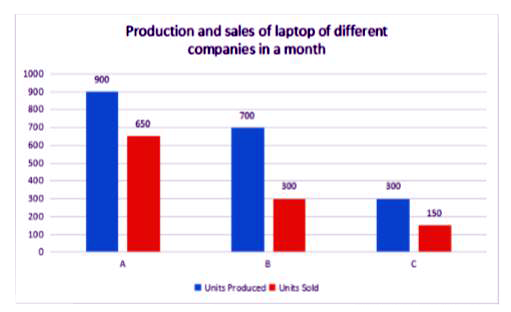
What is the average number of Units produced by all the Companies together?
View SolutionRead the following graph carefully and answer the questions given below.
Production of sugar in three different factories over years (in thousand tonnes)
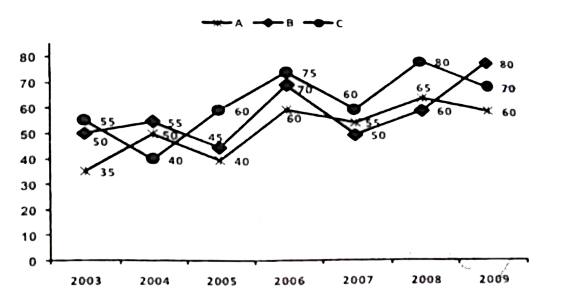
What was the percentage decrease in production of company C in 2007 from previous year ?
View Solution
