If 85% of the S type cars produced in each year were sold by the company, how many S type cars remained unsold?
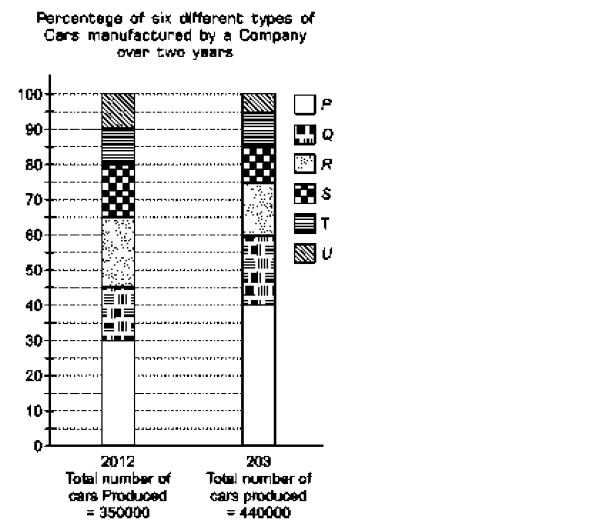
14850
12750
13350
11850
The correct Answer is:A
Step by step video, text & image solution for If 85% of the S type cars produced in each year were sold by the company, how many S type cars remained unsold? by Maths experts to help you in doubts & scoring excellent marks in Class 14 exams.
Topper's Solved these Questions
Similar Questions
The bar chart given below shows the percentage distribution of the production of various models of a ,mobile manufacturing company in 2007 and 2008. The total production in 2007 was 35 lakh mobile phones and in 2008 the production was 44 lakh. Study the chart and answer the following questions.
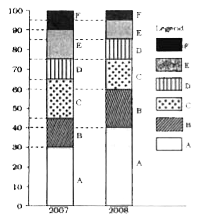
If 85% of the D type mobiles prodeced in each year were sold by the company, how many D type mobiles remained unsold ?View SolutionThe pie chart shows the annual car production of six countries (A,B,C,D,E,F) study the diagram and answer the following question
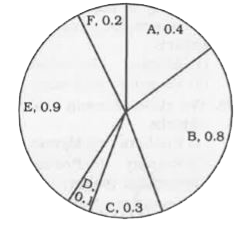
If 35% of the cars produced by these six countries are die then how many petrol cars were producedView Solution
Knowledge Check
- Question 1 - Select One
Study the following graph carefully to answer the questions that follows
The % of five different types of cars produced by a company during two years is given below:
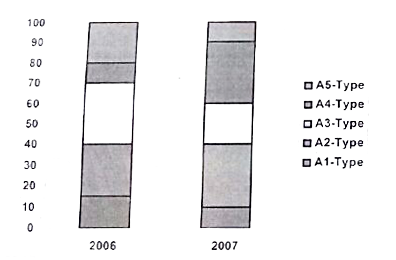
If 85% of A, type cars produced during 2006 and 2007 are being sold by the company, then how many A, type cars left unsold by the company?A21000B22500C21300D24200 - Question 2 - Select One
The given pie chart shows the quantity wise sales distribution of five products (A, B, C, D and E) of a company in 2016.
दिया गया पाई चार्ट 2016 में एक कंपनी के पाँच उत्पादों ( A, B, C, D और E ) की मात्रा वार बिक्री का वितरण दर्शाता है |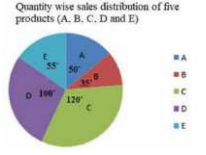 If 320 units of product A were sold by the company, then how many units of products B and E together were sold by the company?
यदि कंपनी के द्वारा वस्तु A की 320 इकाइयाँ बेची गयीं , तो कंपनी के द्वारा बेची गयी वस्तु B और E की कुल इकाइयों की संख्या ज्ञात करें |A567B576C512D640 - Question 3 - Select One
The table shows the production (in thousands) of different types of cars.
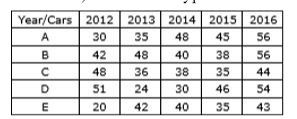
The number of years in which the production of B type cars occurred in all the years is less than the average production of D type cars is as follows:A2B3C1D4
A bakery opened with its daily supply of 40 dozen rolls. Half of the were sold by noon and 60% of the remaining rolls were sold between noon and closing time. How many dozen rolls were left unsold? 6 b. 8 c. 10 d. 12
View SolutionMany types of fish were being sold by them at the market.
View SolutionThe pie-chart shows the annual car production (in millions) of six countries (A, B, C, D ,E, F). Study the diagram and answer the following questions.
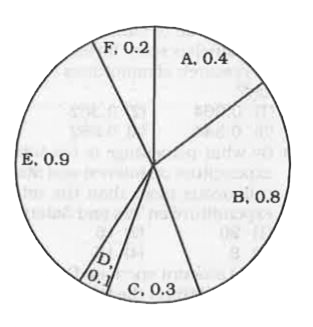
If 35% of the cars produced by these six countries are diesel and the rest are petrol, then how many petrol cars were produced (in millions) ?View SolutionThe table shows the production of different types of cars
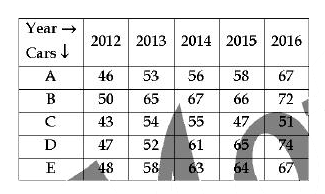
The average production of type A cars during the five years is what percent of the total production of type C cars during the five years?View SolutionThe table shows the production of different types of cars (in thousands).
यह तालिका एक कंपनी द्वारा अलग-अलग कारों के उत्पादन (हज़ार में ) को दर्शाती है |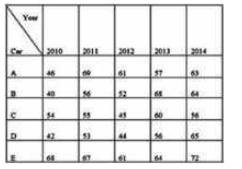 The average production of all type of cars in 2014 is approximately what percent less than the total production of type B cars in 2013 and type D cars in
2010 taken together?
2014 में सभी प्रकार की कारों का औसत उत्पादन 2013 में B प्रकार तथा 2010 में D प्रकार की कारों के कुल उत्पादन से लगभग कितना प्रतिशत कम है ?View Solution

