Study the graph and answer the following questions-
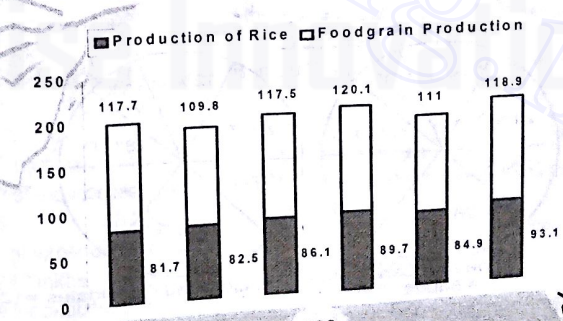
Percentage increase/decrease in production of rice in year 2009-2010 over the year 2006-2007 is about
10.4%
6%
9.8%
0.98%
The correct Answer is:C
Topper's Solved these Questions
Similar Questions
The graph shows the result of 10th class students of a school for 4 years. Study the graph and answer the questions :
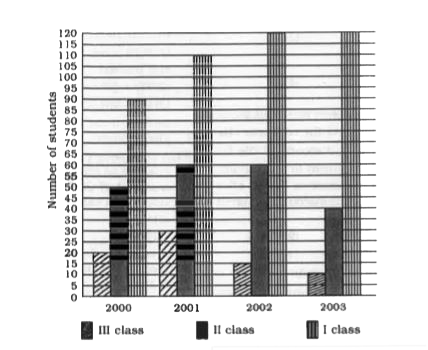
The percentage increase of first class in the year 2003 over the year 2002 is approximately
View SolutionRead the graph and answer the following questions
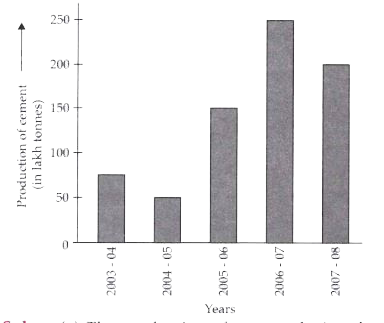
What was the production of cement in the year 2006-07 ?
View Solution
Knowledge Check
Study the graph and answer the following questions-
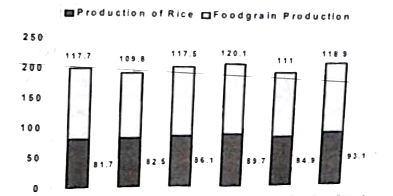
Over the given years what is average production of rice?A86.33 million tonnesB88.66 million tonnesC85 million tonnesD88 million tonnesThe following graph shows production (in thousands) of two types (P and Q) of vehicles by a factory over the years 2009 to 2014. Study the graph and answer the given questions.
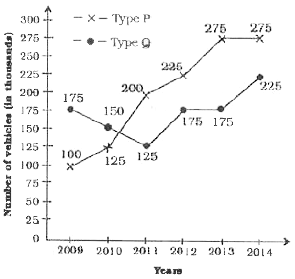
Approximate percentage decrease in production of Type Q vehicles from 2010 to 2011 isA10.1B16.7C14.3D12.5Study the graph and answer the following questions-

Average production of rice is what percent of the maximum recorded production of food grains over the years?A42.5%B38.4%C42.7%D40.7%
Observe the graph below and answer the following question
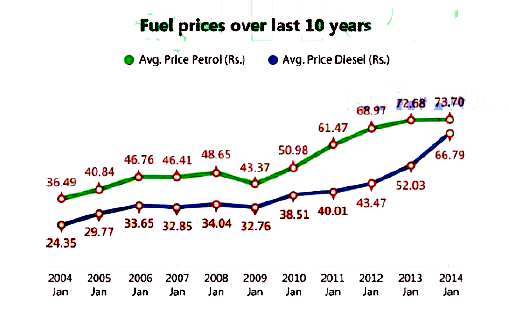
What is the average of diesel prices over the years 20062012?
View SolutionThe following graph shows the production of cotton bales of 100 kg each (in lakhs) by different states A, B, C, D and E over the years. Study the graph and answer the following Questions.
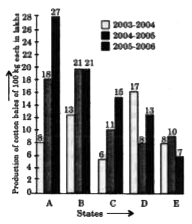
The number of State for which the production of cotton in 2005-2006 is less than or equal to the preceding year is
View SolutionStudy the following graph carefully and answer the given questions.
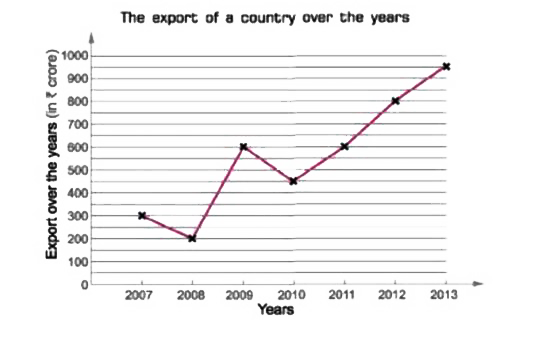
What is the difference in exports in the years 2009 and 2010 ?
View SolutionObserve the graph below and answer the following question.
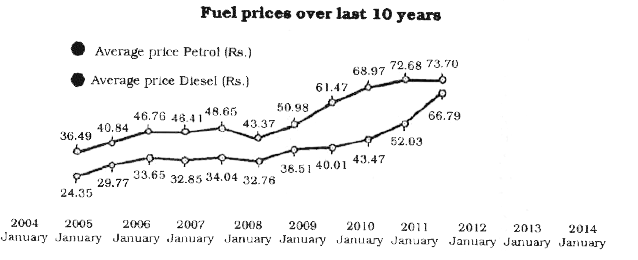
What is the average of diesel prices over the years 2006-2012?
View SolutionThe following graph shows the production of cotton bales of 100 kg each in lakhs by different states A, B, C, D and E over the years. Study the graph and answer the following Questions.
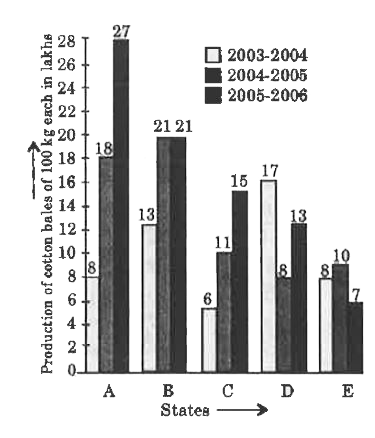
The number of States for which s the production of cotton in 2005 2006 is less than or equal to the preceding year is
View Solution
