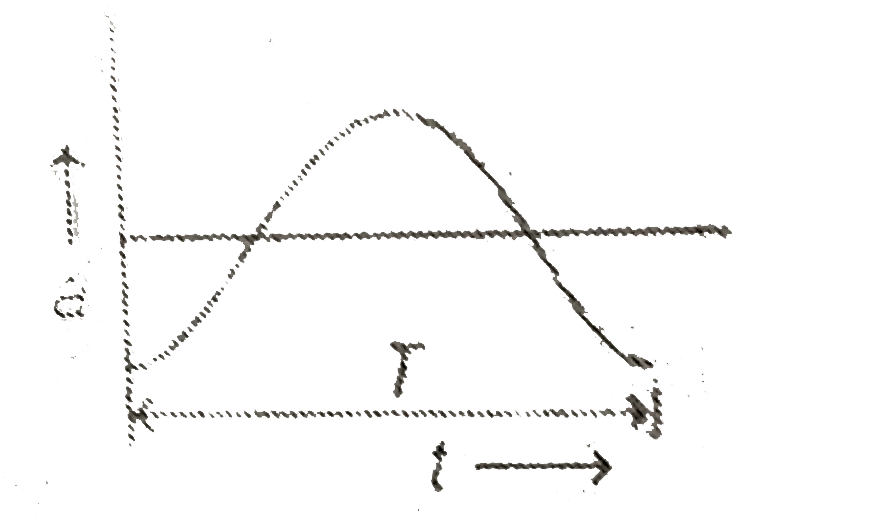
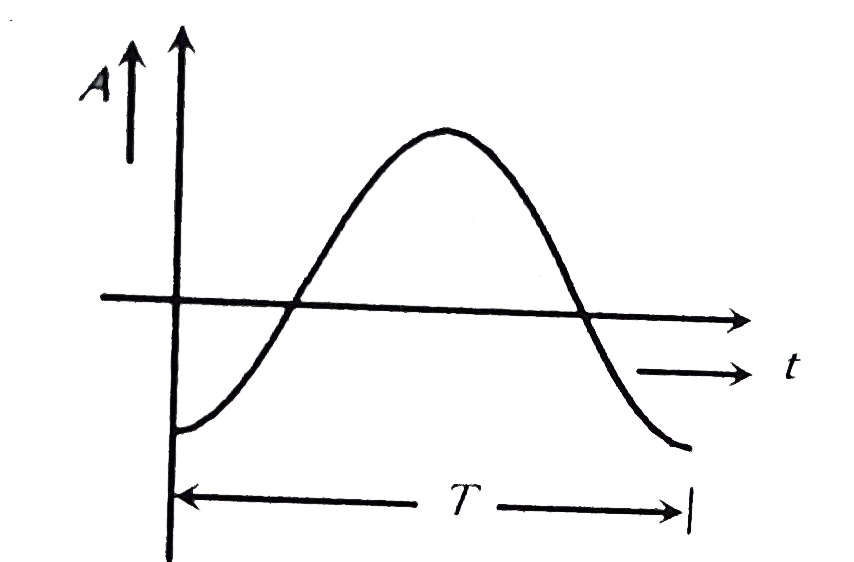
Acceleration 'a'versus time't' graph of a body in SHM is given by a curve shown below. T is the time period. Then corresponding graph between kinetic energy KE and time t is correctly represented by


The correct Answer is:A
Acceleration is −ω2x. If is maximum when x=Amplitude. So at extreme position, x is maximum and this happens when t=0, so at t=0 acceleration is maximum.
At t=0,|a|=maximum. Therefore the particle is at extreme position, where v=0 or KE=0
Further, in one time period (of x, v, or a), kinetic energy oscillates two times. Therefore the correct graph is (A)
Similar Questions
Acceleration versus time graph of a body in SHM is given by a curve shown below. T is the time period. Then corresponding graph between kinetic energy KE and time t is correctly represented by
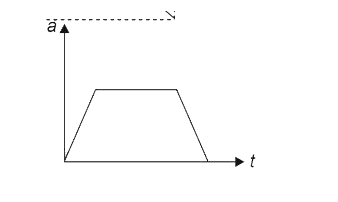
View SolutionAcceleration versus time graph of a particle moving in a straight line is as shown in adjoining figure. If initially particle was at rest. Then corresponding kinetic energy versus time graph will be :
View Solution
Knowledge Check
Acceleration versus time graph of a body in SHM is given by a curve shown below. T is the time period. Then corresponding graph between kinetic energy KE and time t is correctly represented by
 A
A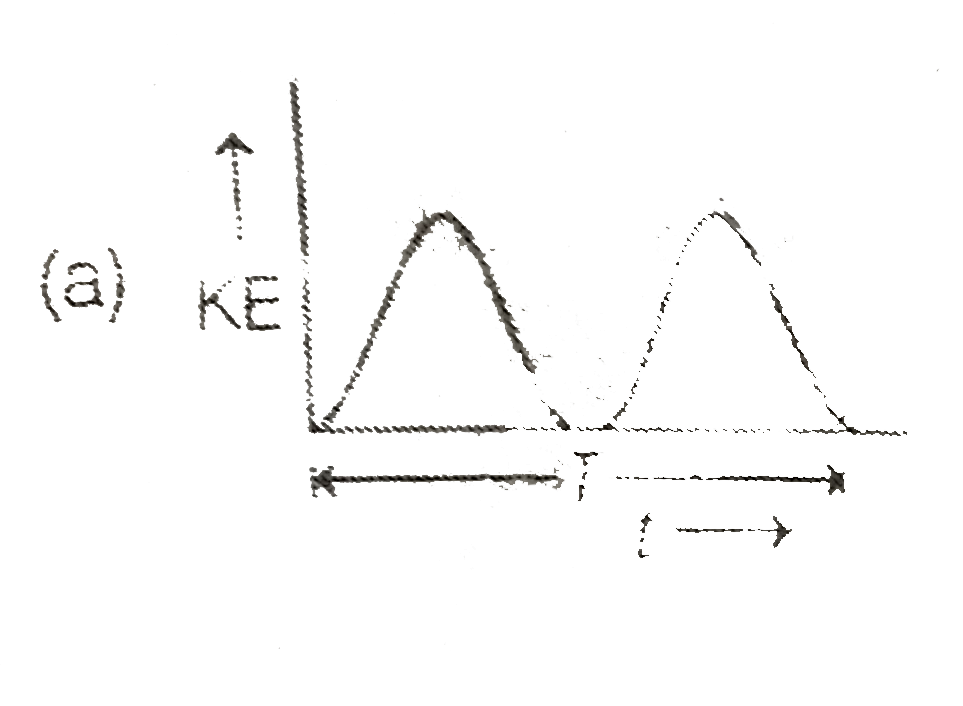 B
B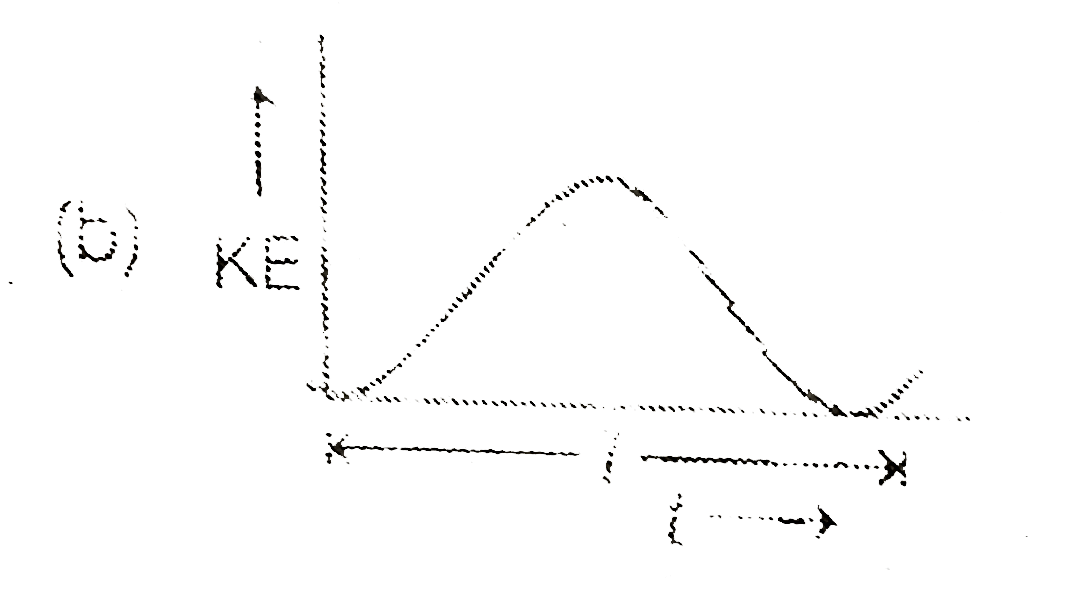 C
C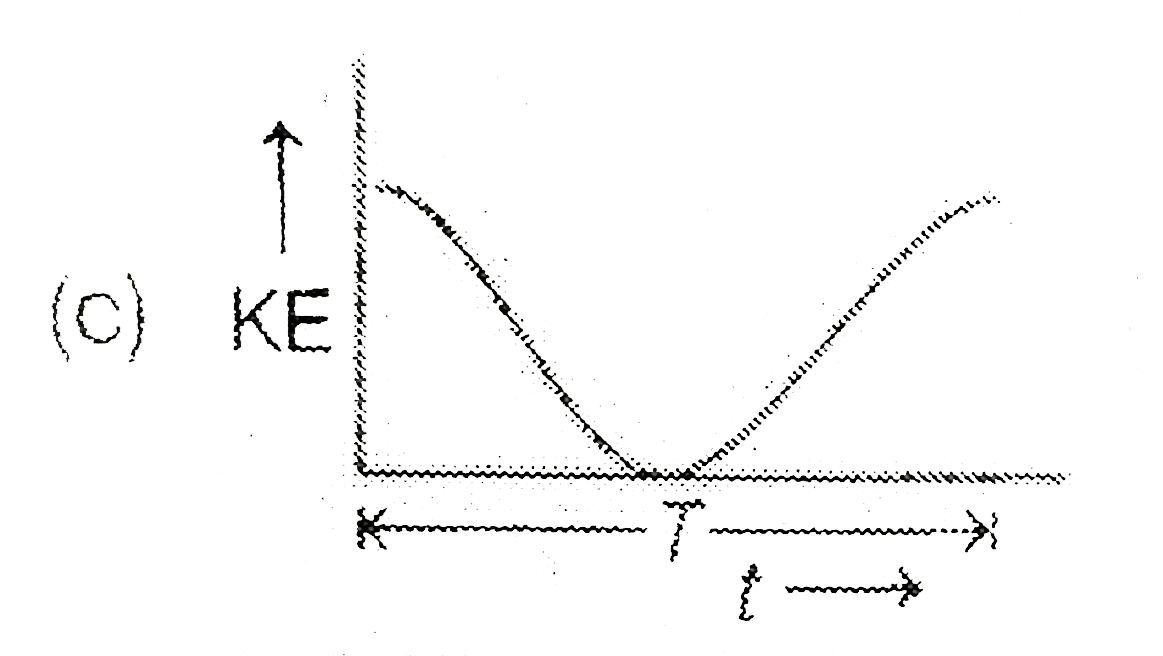 D
D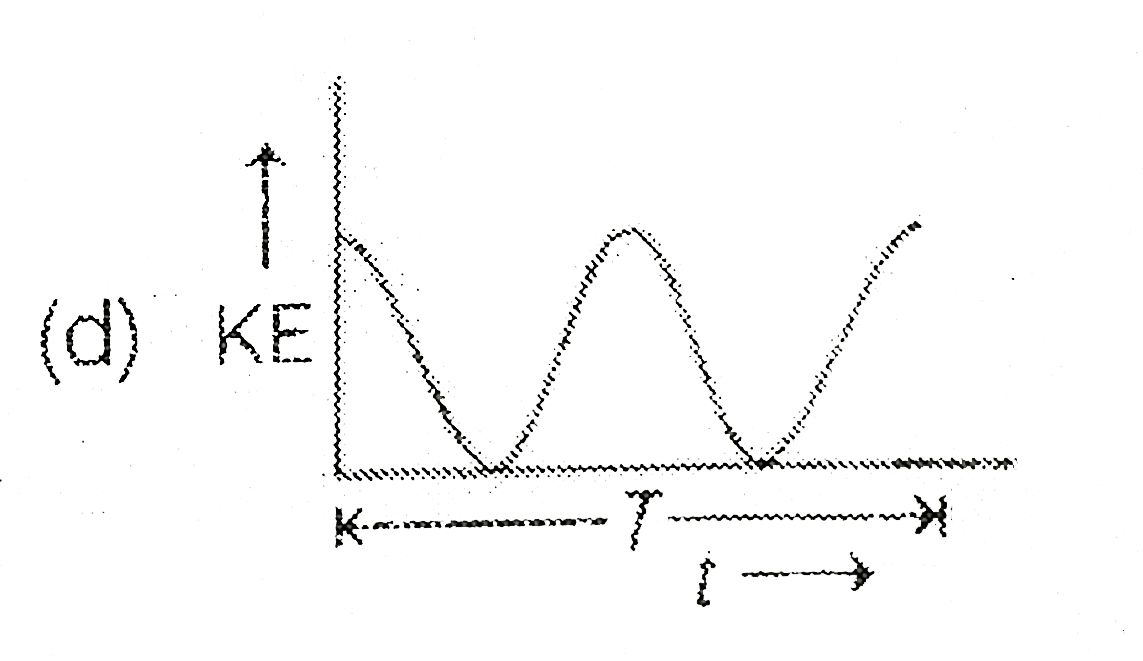
Acceleration A and time period T of a body in S.H.M. is given by a curve shown below. Then corresponding graph, between kinetic energy (K.E.) and time t is correctly represented by
 A
A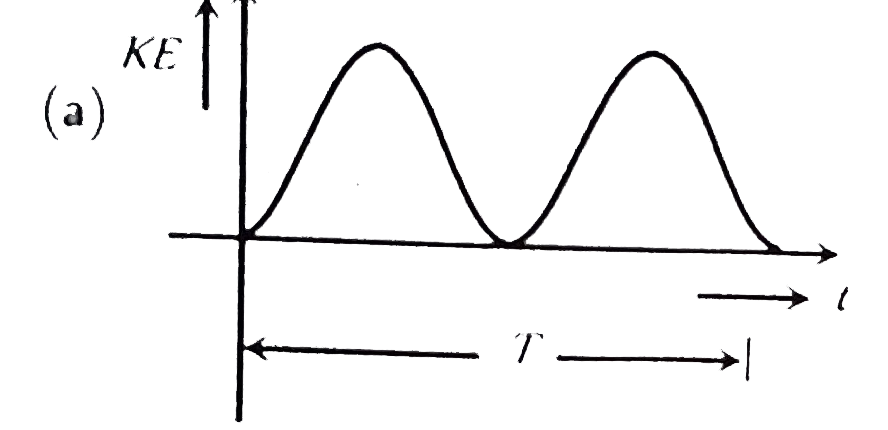 B
B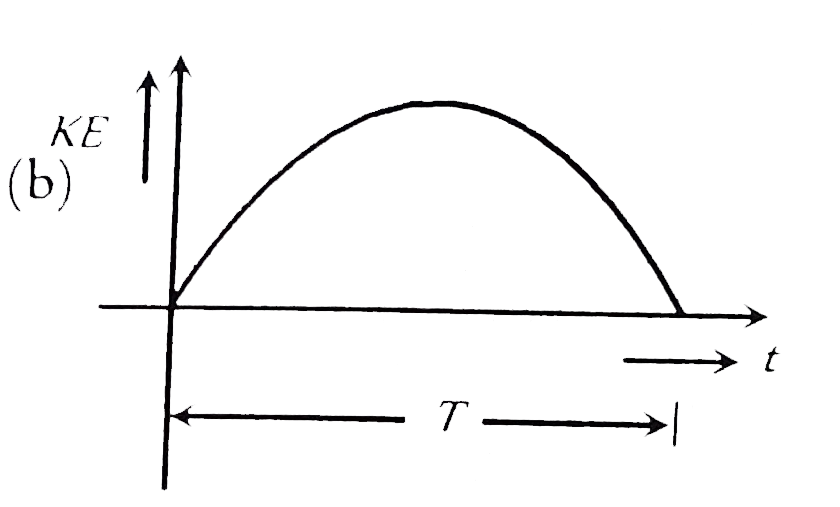 C
C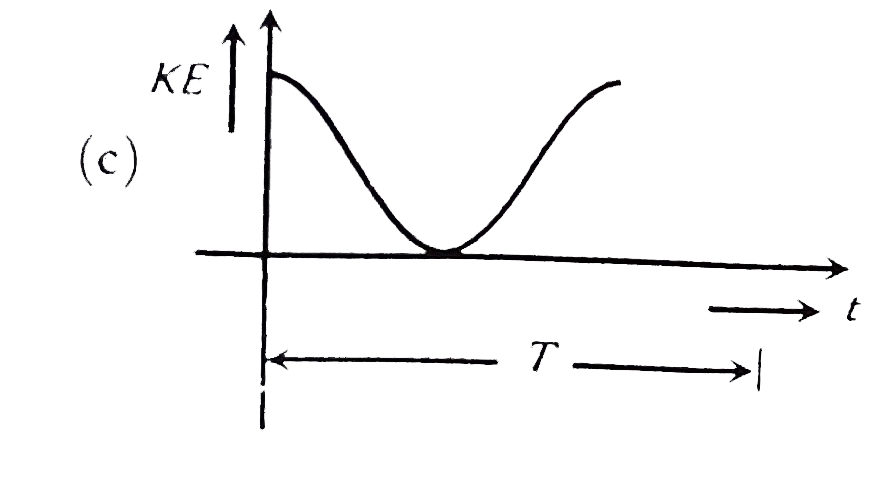 D
D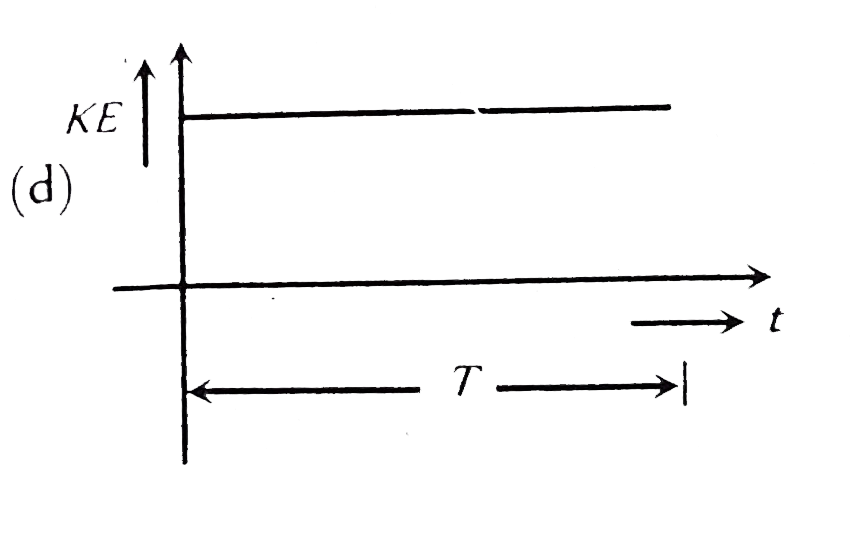
In S.H.M., the graph between kinetic energy K and time 't' is
A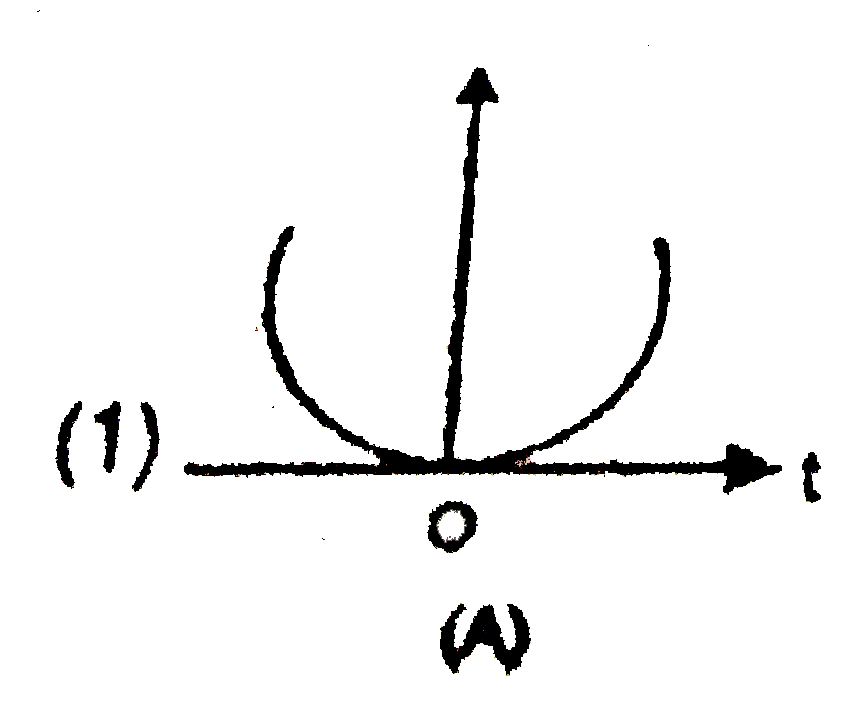 B
B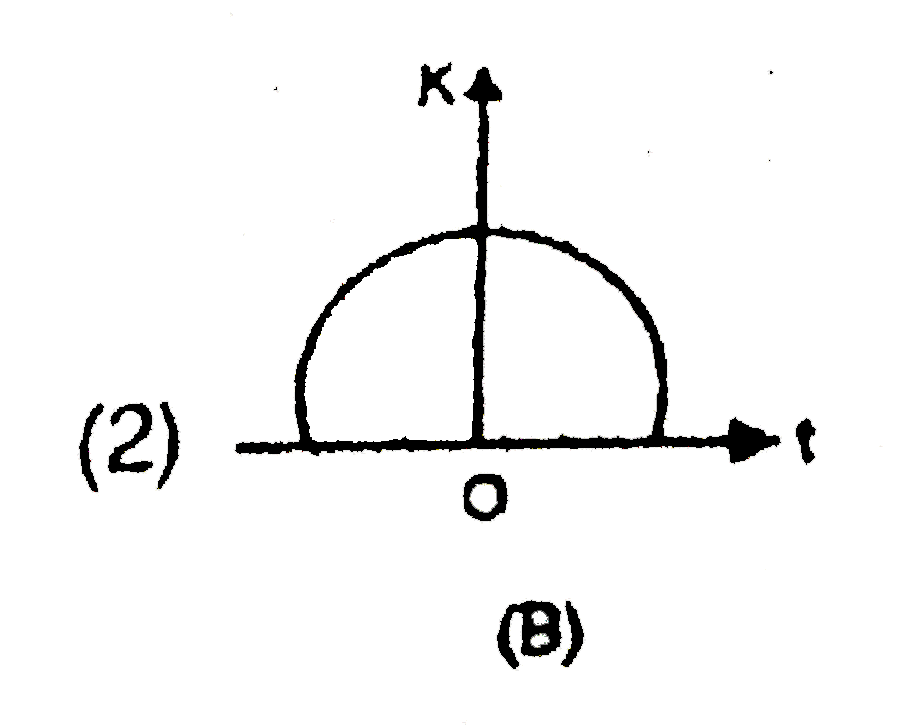 C
C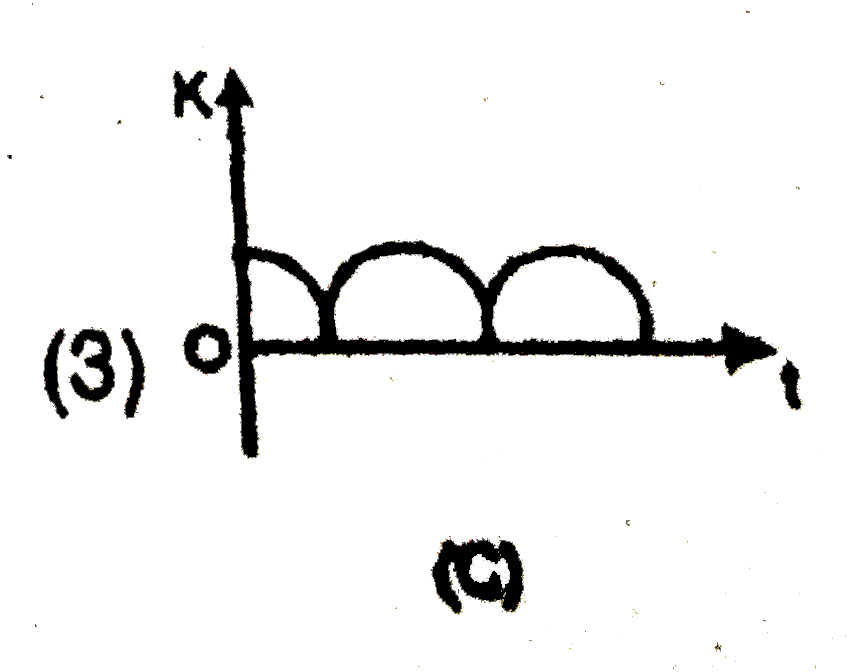 D
D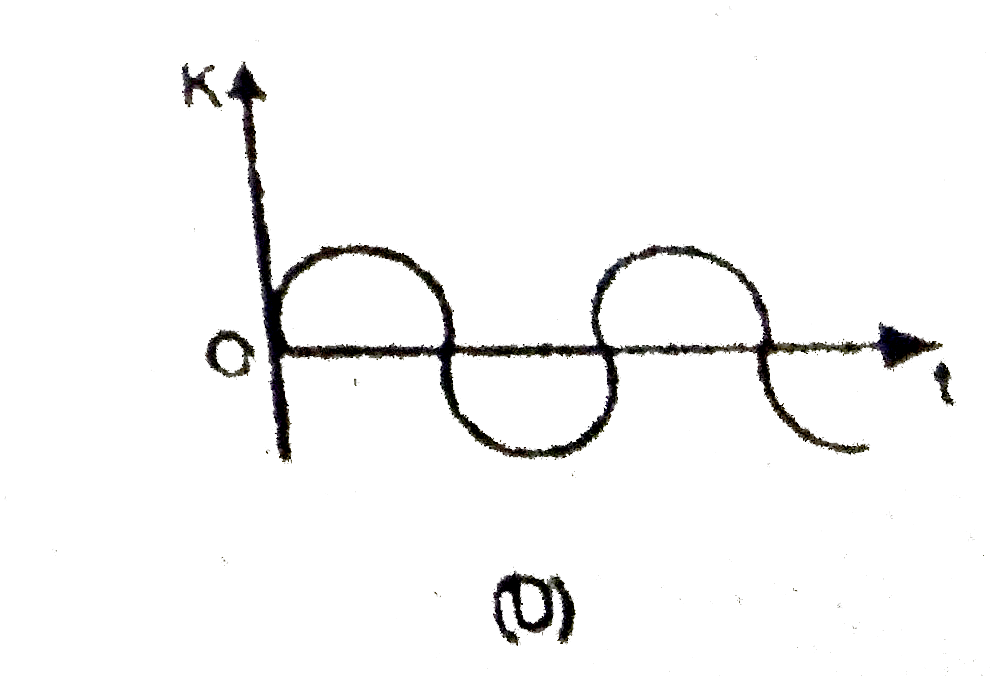
The acceleration versus time graph of a particle is shown in. The respective v−t graph of the particle is .
 .
.
View SolutionAcceleration time graph of a body is shown below the corresponding velocity time graph of the same body is
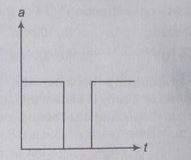
View SolutionAcceleration time graph of a body is shown below the corresponding velocity time graph of the same body is

View SolutionIf a body is realeased from the top of a tower, the graph between distance (x) and time (t) is correctly shown by
View SolutionAcceleration versus time graph of a particle moving in a straight line is as shown in adjoining figure. If initially particle was at rest. Then corresponding kinetic energy versus time graph will be :

View Solution
