Directions: Study the Pie chart and answer the following question.
The pie chart is showing the percentage of different types of shirts sold by five different stores namely A, B, C,
D and E.
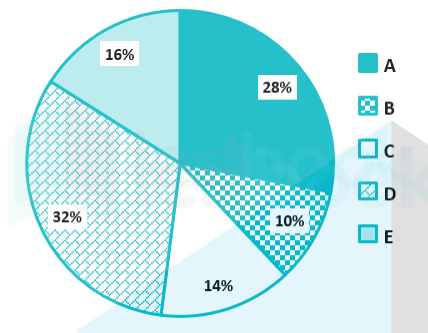
If the difference in shirt sold by store C and store D is 1800. Find the number of shirts sold by store D.
2800
2400
3600
3200
Step by step video & image solution for Directions: Study the Pie chart and answer the following question. The pie chart is showing the percentage of different types of shirts sold by five different stores namely A, B, C, D and E. If the difference in shirt sold by store C and store D is 1800. Find the number of shirts sold by store D. by Maths experts to help you in doubts & scoring excellent marks in Class 14 exams.
Similar Questions
Directions: Study the Pie chart and answer the following question. The pie chart is showing the percentage of different types of shirts sold by five different stores namely A, B, C, D and E.

If the difference in shirt sold by store A and store D is 64, then find the total shirt sold by store A, B and E.View SolutionDirections: Study the Pie chart and answer the following question. The pie chart is showing the percentage of different types of shirts sold by five different stores namely A, B, C, D and E.

Find the average of shirt sold by store D and E, if the shirt sold by E is 256View SolutionDirections: Study the Pie chart and answer the following question. The pie chart is showing the percentage of different types of shirts sold by five different stores namely A, B, C, D and E.

Find the average of shirt sold by all stores. If the shirt sold by store B is 1750.View SolutionDirections: Read the following Pie chart carefully and answer the following questions:- The pie chart shows the percentage of candidates in 6 different shifts of an examination. Total number of candidates = 5500
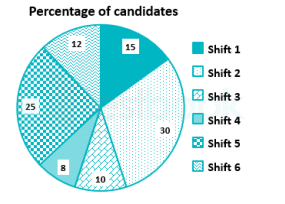
If 40% candidates in shift 6 were failed, then find the number of candidates passed the examination in the same shift.View SolutionDirections: Read the following Pie chart carefully and answer the following questions:- The pie chart shows the percentage of candidates in 6 different shifts of an examination. Total number of candidates = 5500
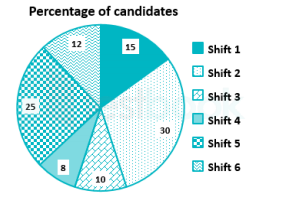
If 215 candidates in shift 2 were absent, then find the number of candidates present in the same shift.View SolutionDirections: Read the following Pie chart carefully and answer the following questions:- The pie chart shows the percentage of candidates in 6 different shifts of an examination. Total number of candidates = 5500
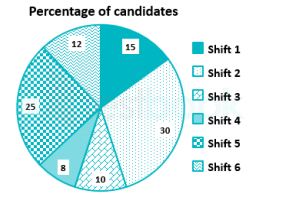
Find the average number of candidates in shift 2, shift 3 and shift 4 together in the examination.View SolutionDirections: Read the following Pie chart carefully and answer the following questions:- The pie chart shows the percentage of candidates in 6 different shifts of an examination. Total number of candidates = 5500
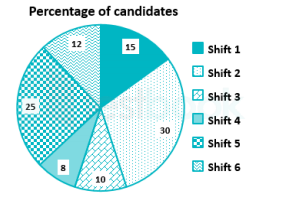
If ratio of male to female candidates in shift 3 is 6 : 5, then find number of female candidates in shift 3) 1) 350 2) 225View SolutionDirections: Read the following Pie chart carefully and answer the following questions:- The pie chart shows the percentage of candidates in 6 different shifts of an examination. Total number of candidates = 5500
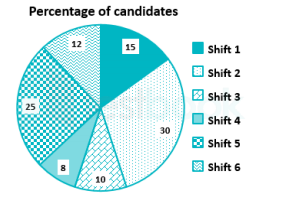
Number of candidates in shift 6 is what percentage more/less than number of candidate in shift 4?View SolutionDirections: Refer to the following graph and answer the given questions. Data related to the number of shoes sold by two stores (A and B )during five years:
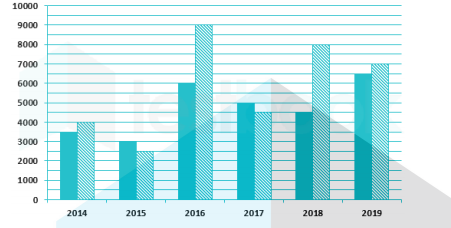
What is the difference between the total number of shoes sold by store A in 2018 and 2019 together and the total number of shoes sold by store B in 2014 and 2015 together?View SolutionDirections: Refer to the following graph and answer the given questions. Data related to the number of shoes sold by two stores (A and B )during five years:
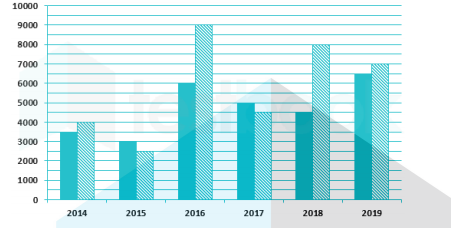
Find the ratio between the total number of shoes sold by stores A and B together in 2016 to the total number of shoes sold by stores A and B together in 2018?View Solution

