Each of the three graphs represents acceleration versus time for an object that already has a positive velocity at time t1. Which graphs show an object whose speed is increasing for the entire time interval between t1 and t2?

graph I, only
graphs I and II, only
graphs I and III, only
graphs I, II, and III
The correct Answer is:D
Acceleration is positive in all three graphs, so velocity increases in all three.
Topper's Solved these Questions
Similar Questions
Knowledge Check
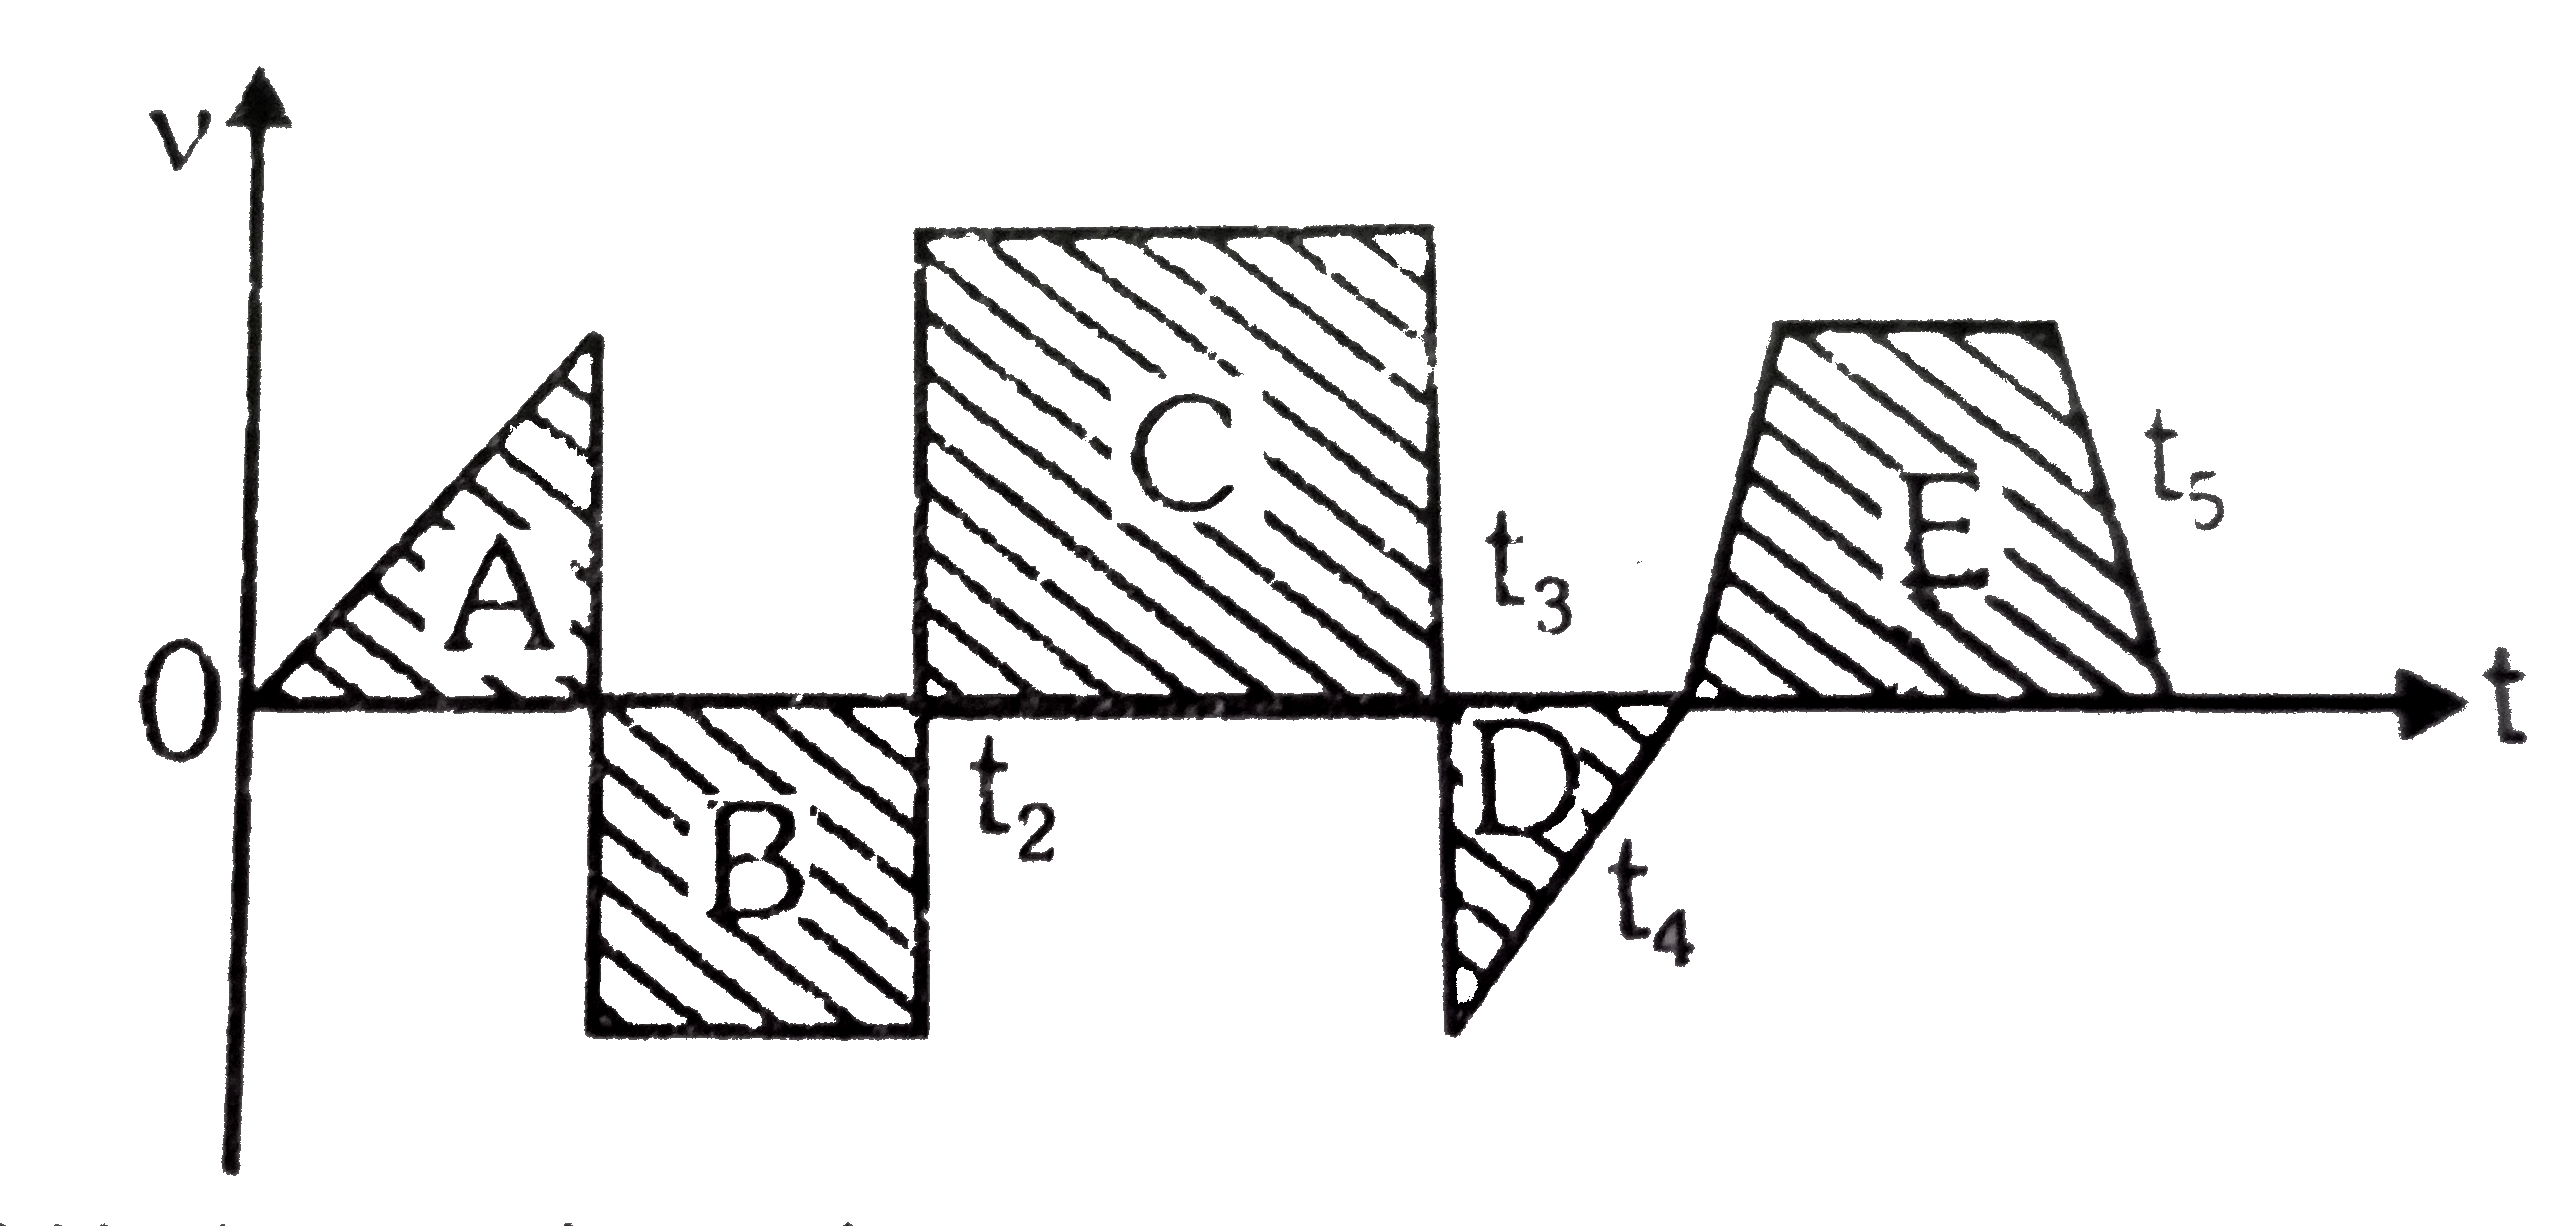
The velocity-time graph of an objects is as shown. The displacement during the interval 0 to t4 is
 AArea A+AreaB+AreaC+AreaD+AreaEBAreaA+AreaC-AreaB-AreaDCArea+AreaB+AreaC+AreaDDAreaA+AreaC+AreaE-AreaB+AreaD
Position (x) versus time (t) graph of a particle is as shown. The velocity is zero at?
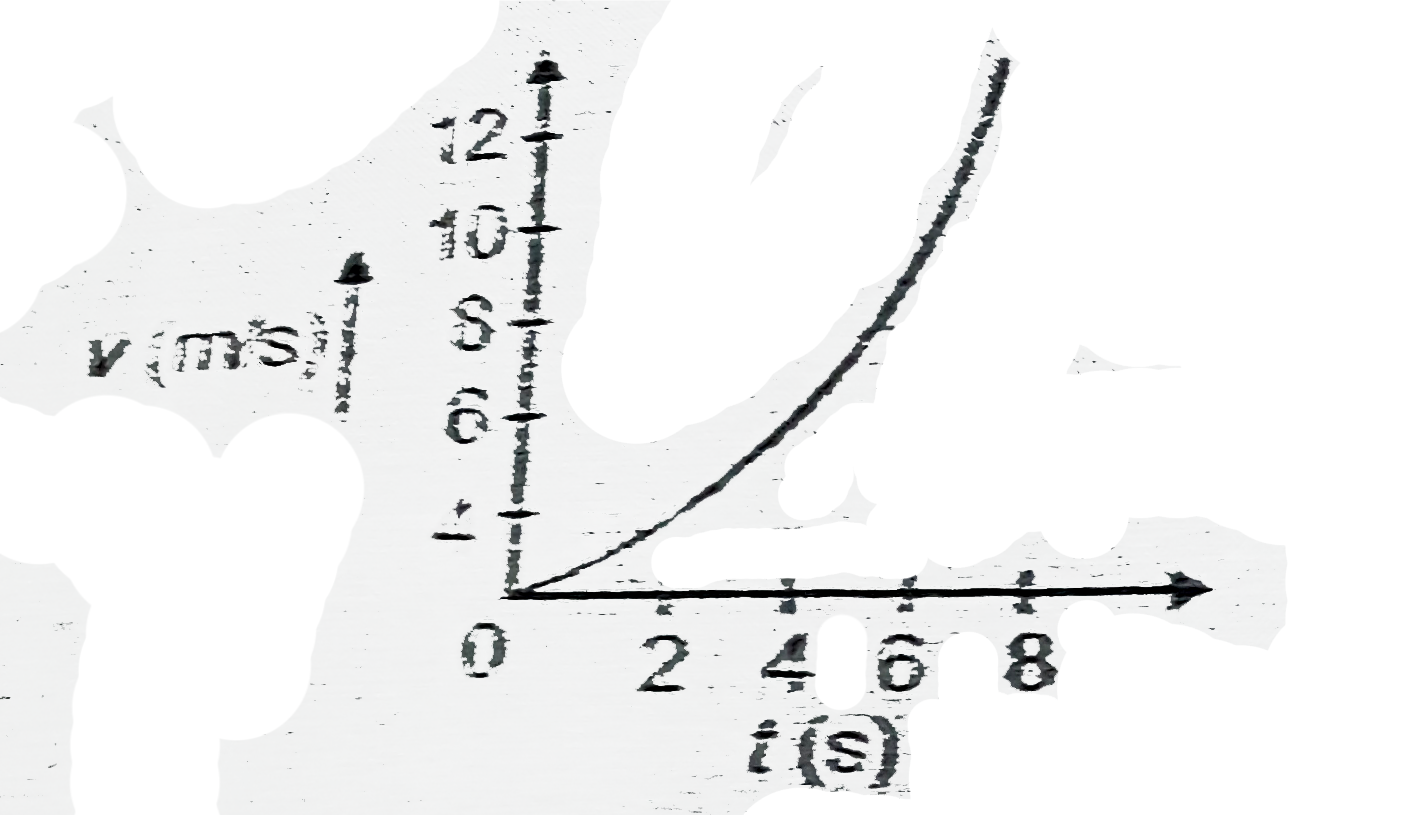
View SolutionThe velocity-time graph of an object is given below. Calculate the average acceleration of the object in the time interval of 4 s to 6 s.

View SolutionThe velocity-time graph of an object is given below. Calculate the average acceleration of the object in the time interval of 4 s to 6 s.

View SolutionThe velocity-time graph of an objects is as shown. The displacement during the interval 0 to t4 is

View SolutionDraw the velocity-time graph for an object in uniform motion. Show that the area under the velocity-time graph gives the displacement of the object in the given time interval.
View SolutionDraw the velocity-time graph of an object moving with uniform positive acceleration.
View SolutionThe relation between the acceleration and time for an object is given below. Calculate the velocity with which the object is moving at t = 1 s.
a=3t−4t2
View Solution
