Directions: The following table shows the number of bananas sold by 5 fruit sellers and the relation of
apples with bananas in 3rd column. Read the table carefully and answer the following question.

Had Apples sold by A is only 10% more than bananas sold by A, then find the ratio of the total number of
bananas sold by B, C and E to the total number of apples sold by A, D and E.
21:19
1:1
13:15
2:3
The correct Answer is:11:15
Similar Questions
Directions: The following table shows the number of bananas sold by 5 fruit sellers and the relation of apples with bananas in 3rd column. Read the table carefully and answer the following question.

The total fruits sold by B is approximately what percent of the total fruits sold by D?
View SolutionDirection: Read the Graph carefully and answer the following quesitons: The following Line graph shows the number of Fruits (Apple and Banana) sold in five different years.
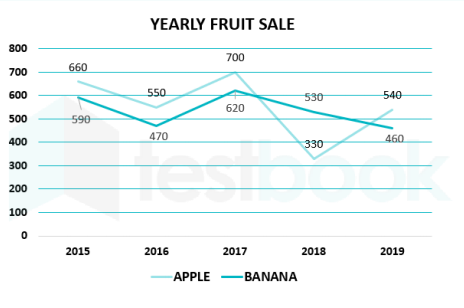
The total number of sale of banana in 2017 is what percent of the total number of sale of apple in 2017?
View SolutionDirection: The given bar graph shows the number of pens sold by two shops A & B in four consecutive months. Study the following data and answer the following questions:
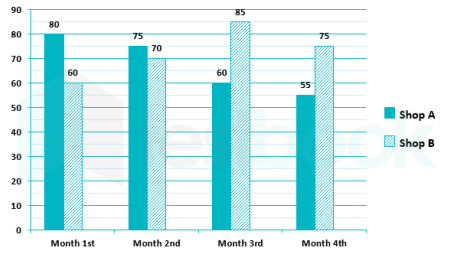
Find the ratio of the number of pens sold by shop A in 1st month to the number of pens sold by B in 3rd month.
View SolutionDirection: Read the Graph carefully and answer the following quesitons: The following Line graph shows the number of Fruits (Apple and Banana) sold in five different years.
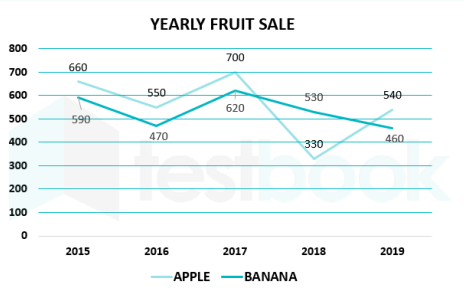
What percent more is the sale of banana to that of apple in 2018?
View SolutionBar graph given below shows pens sold by a retailor on five different days. Study the data carefully and answer the following questions.
Pen sold on different days
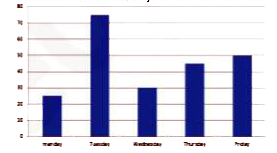
Find the difference between total number of pens sold on Monday and Tuesday together to total number of pens sold on Thursday and Friday together?
View SolutionDirection: Read the Graph carefully and answer the following quesitons: The following Line graph shows the number of Fruits (Apple and Banana) sold in five different years.
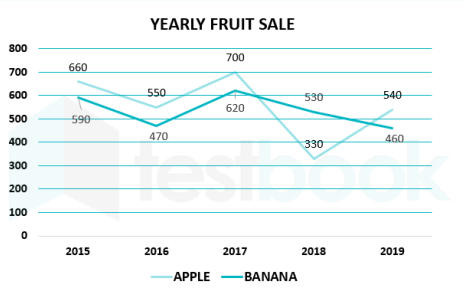
What is the overall average sale of banana?
View SolutionBar graph given below shows pens sold by a retailor on five different days. Study the data carefully and answer the following questions.
Pen sold on different days
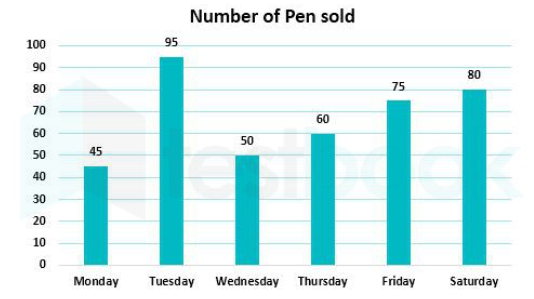
what is the average number of pens sold during a week if total number of pens sold on saturday is 25% more than total number of pens sold on Sunday .
View Solution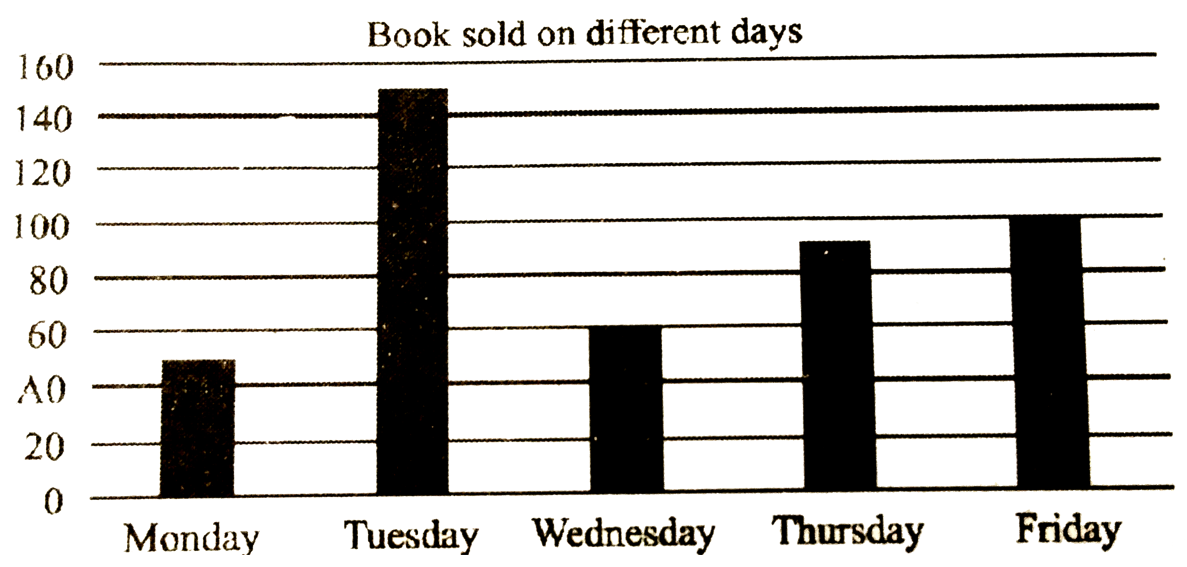
Total number of books sold on Tuesday are 25% more than total number of books sold on Sunday. Find total number of books sold on Sunday ?
View SolutionDirection: The given bar graph shows the number of pens sold by two shops A & B in four consecutive months. Study the following data and answer the following questions:
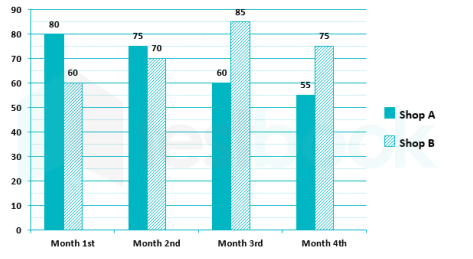
Find that the number of pens sold by shop A in 1st month is how much percent more than the number of pens sold by shop A in 3rd month.
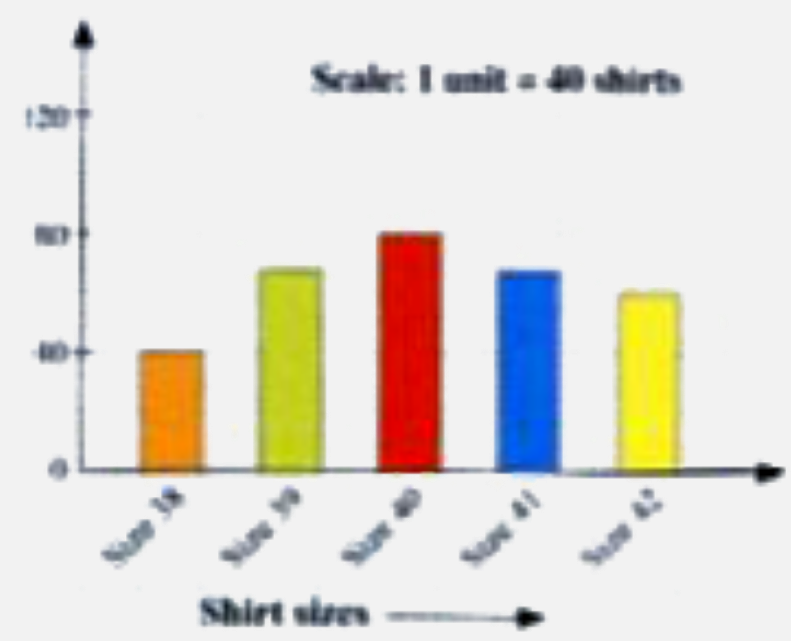
View SolutionRead the following graph and answer the following question.
Find the ratio of the number of shirts of size 38 sold to the number of shirts of size 42 sold.
View Solution
