The given pie chart represents the annual yield of certain crops in tons.
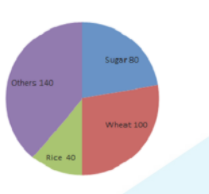 If the total production is 9000 tons, then the yield of rice is_______ tons.
3000
1000
2000
1500
Step by step video & image solution for The given pie chart represents the annual yield of certain crops in tons. If the total production is 9000 tons, then the yield of rice is_______ tons. by Maths experts to help you in doubts & scoring excellent marks in Class 14 exams.
Updated on:21/07/2023Similar Questions
The given pie chart represents the popularity of ice-cream flavours in the year 2015.
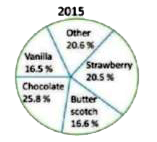
In 2015, if the total sale of chocolate flavour is for ~ 5 , 1 60 , then the total sale (in Rs) for vanilla flavour is:
View SolutionThe given pie charts represent the popularity of ice-cream flavours in the years 2005 and 2015.
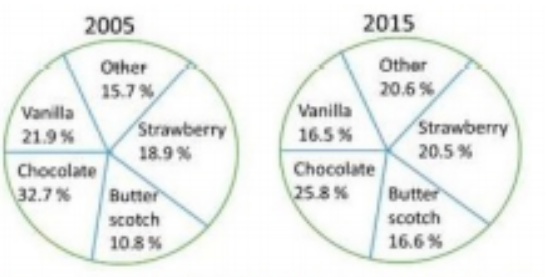
If a percentage point shift results in annual additional sales of Rs 5,000, how much (in Rs), did the combined annual strawberry and butterscotch sales increa se from 2005 ro 2015?
View Solution
Knowledge Check
The given pie-chart represents the percentage of students enrolled in five different sports. The total number of students is 2800.
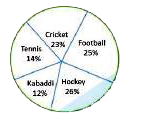
What is the average number of student enrolled in Hockey and Tennis together ?A560B580C540D460The given pie chart represents the popularity of ice-cream flavours in the year 2015.
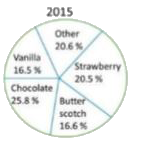
In 2015, if the total sale of vanilla flavour is for ₹ 3,300 , then total sale (in ₹) for chocolate flavour is :A₹ 5,160B₹ 4,100C₹ 4,120D₹ 3,320If the yield of rice and wheat is 9000 tonnes, then the yield of excess product of others in composition with sugarcane is
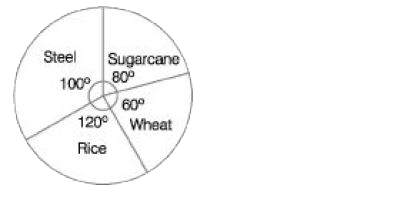 A1000 tonnesB) 2000 tonnesC3000 tonnesD4000 tonnes
The given bar graph represents the production and sales of a certain crop in quintals by the farmers F1,F2,F3 and F4.
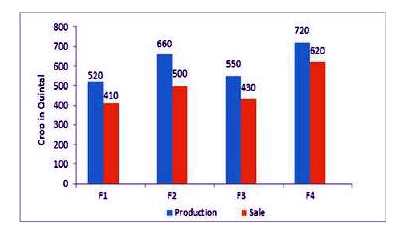
What is the ratio between the total sales and total prdouction by all farmers ?
View SolutionThe given pie charts represent the popularity of ice-cream flavours in the years 2005 and 2015.
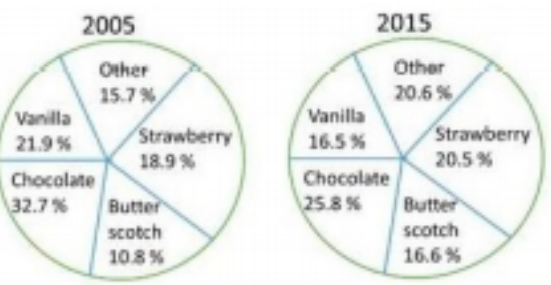
If a percentage point shift results in annual additional sales ₹ 10,000 how much (in ₹), did the combined annual strawberry and butterscotch sales increase from 2005 to 2015 ?
View SolutionThe given pie-chart represents the percentage of students enrolled in five different sports. The total number of students is 2800.
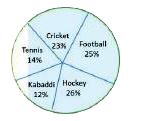
If 24 students playing cricket are shifted to Kabaddi, then find the new ratio of the number of students in Cricket to those in Kabaddi.
View SolutionThe annual agricultural production (in tonnes) of an Indian State is given in the pie chart. The total production is 9000 tonnes. Read the pie chart and answer the question.
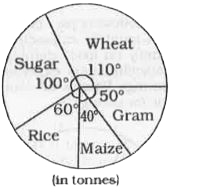
What is the annual production of wheat?
View SolutionThe given pie-chart shows the marks obtained (in degrees) by a student in different subjects. The total marks obtained by the student in the examination is 432.
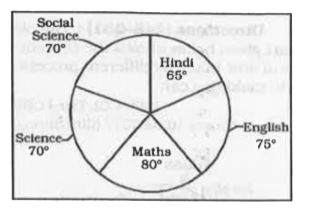
The marks obtained in Science in what percentage of the total marks?
View Solution
