The v-t graph for a particle is as shown. The distance travelled in the first seconds is :
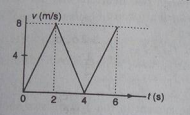
12 m
16 m
20 m
24 m
The correct Answer is:B
Similar Questions
The speed verses time graph for a particle is shown in the figure. The distance travelled (in m) by the particle during the time interval t = 0 to t = 5 s will be __________
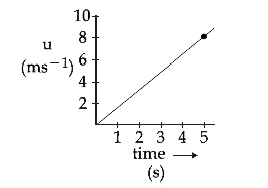
View SolutionThe speed verses time graph for a particle is shown in the figure. The distance travelled (in m) by the particle during the time interval t = 0 to t = 5 s will be __________

View Solution
Knowledge Check
The v−t graph for a particle is shown. The distance travelled in the first four seconds is:
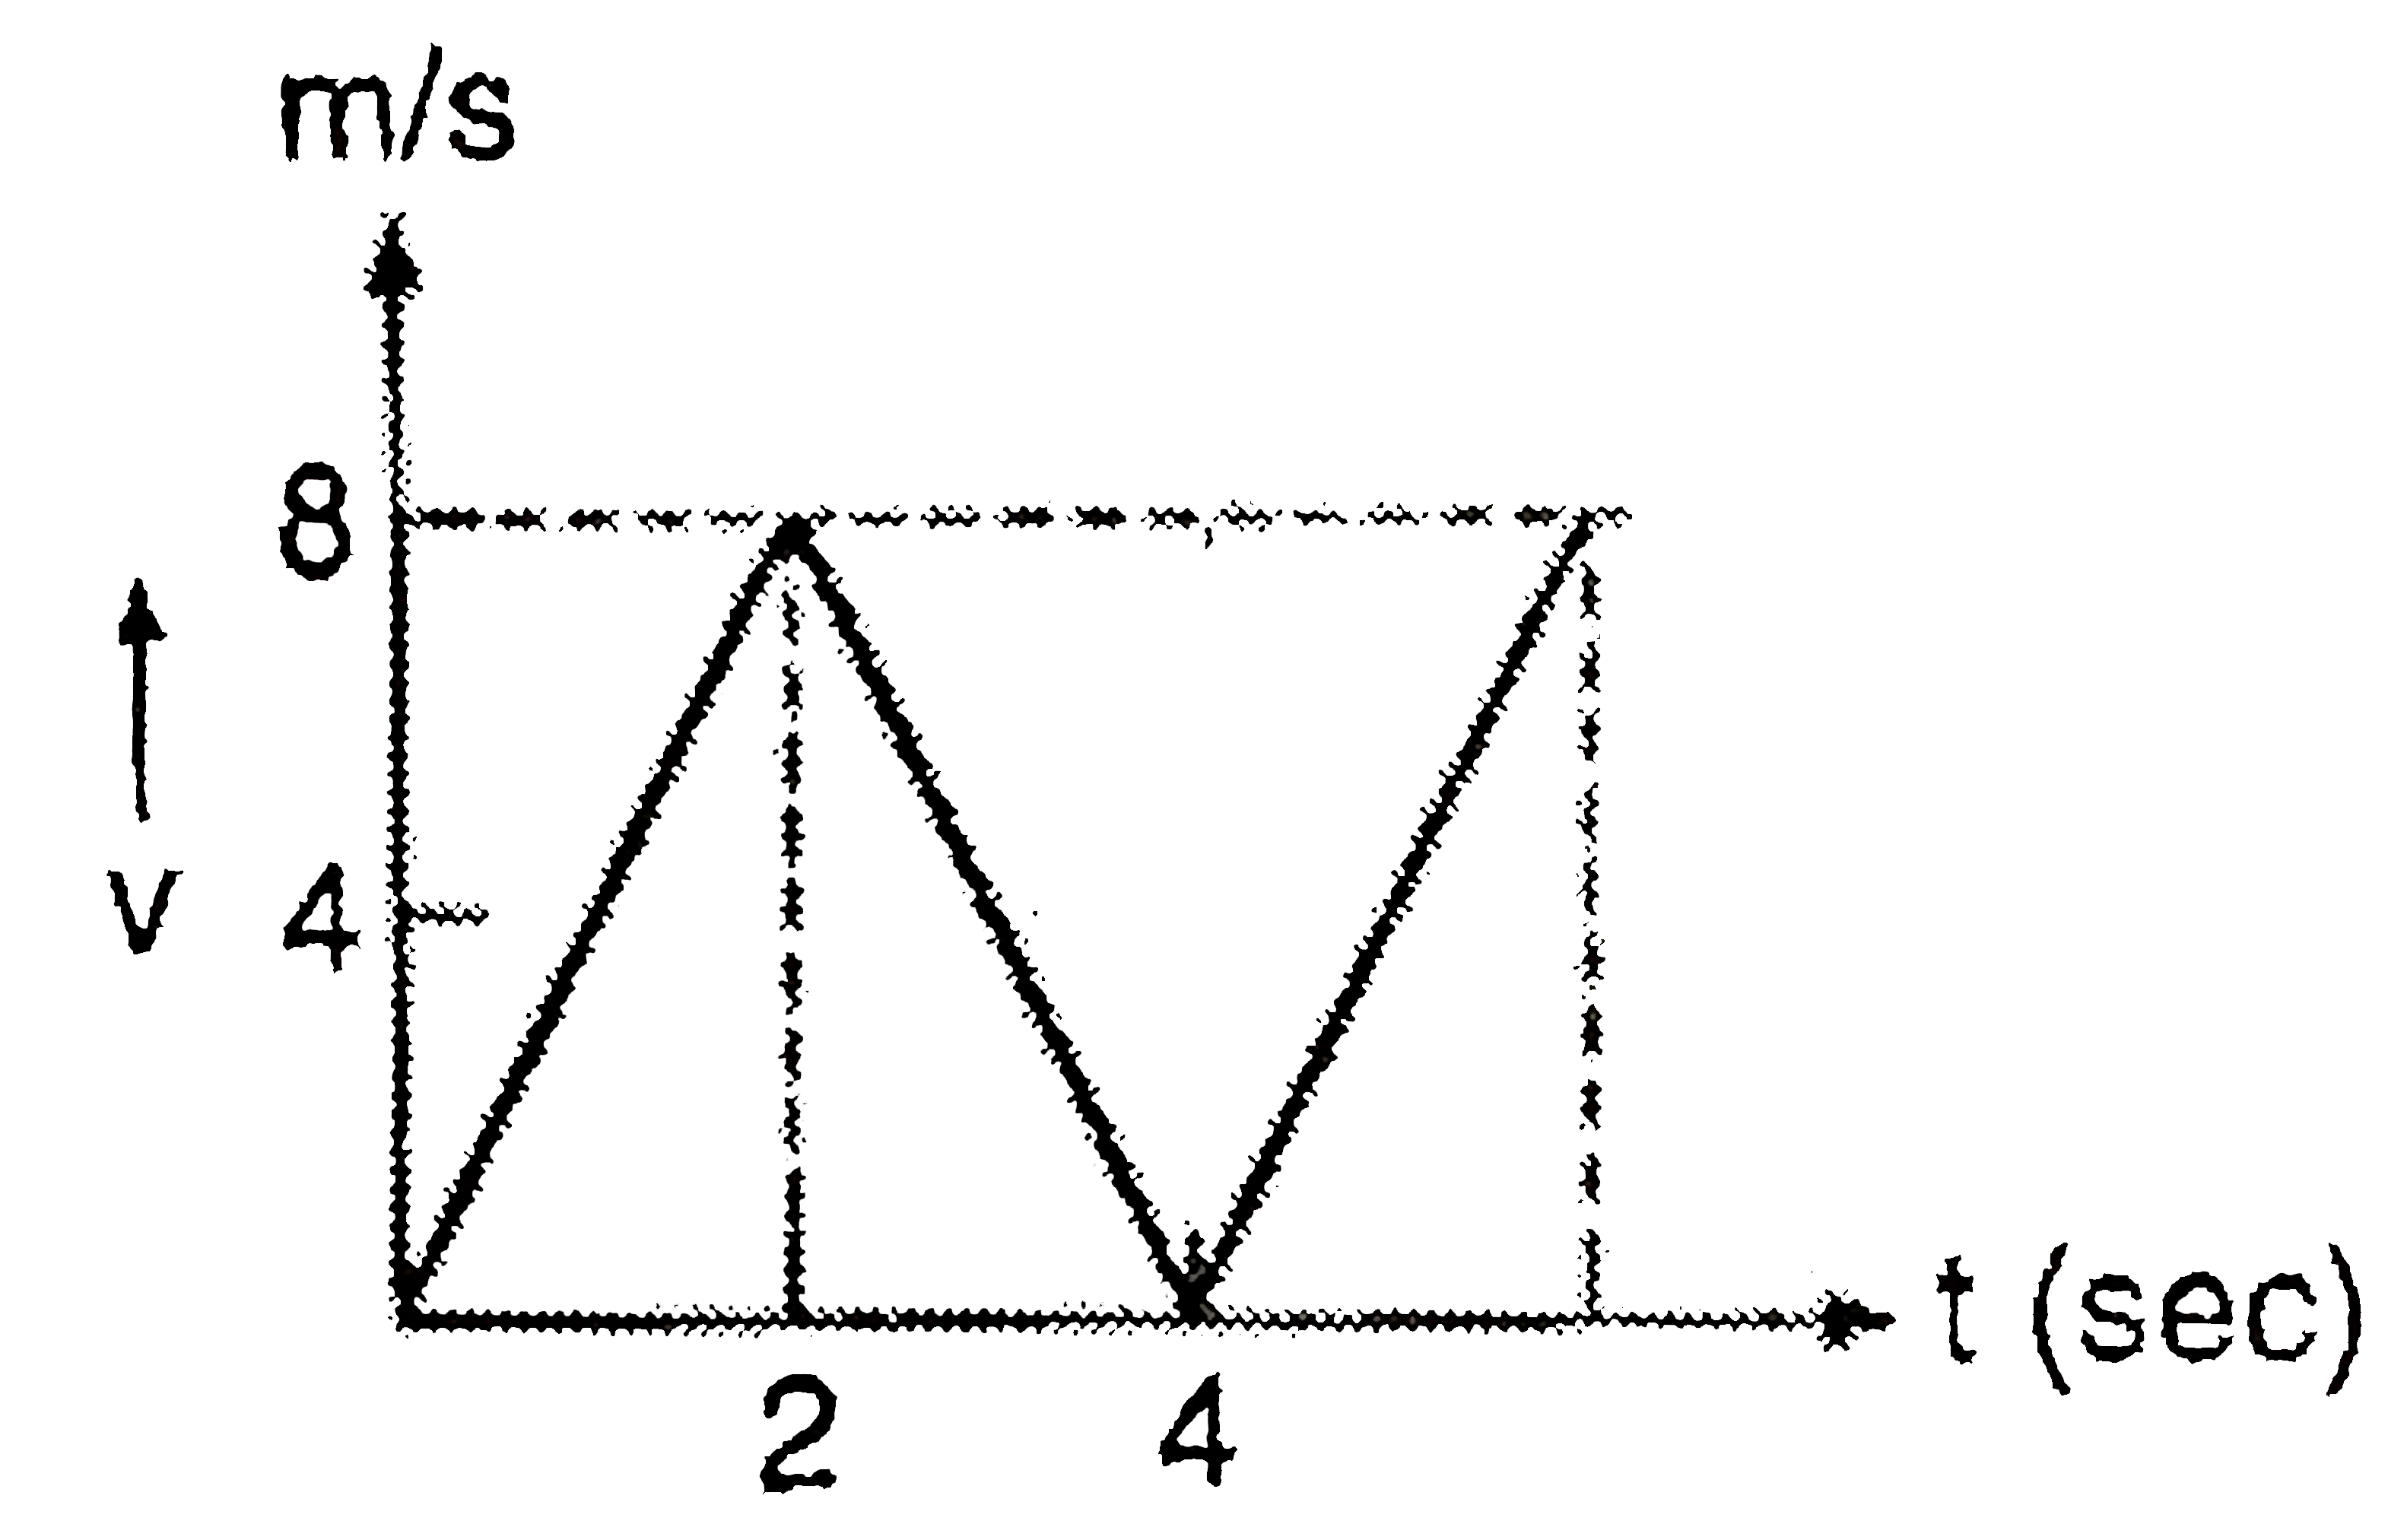 A12 mB16 mC20 mD24 m
the velocity of a particle varies with time as shown below the distance travelled by the travelled by the particle during t=2s"and" t= 6s. Is
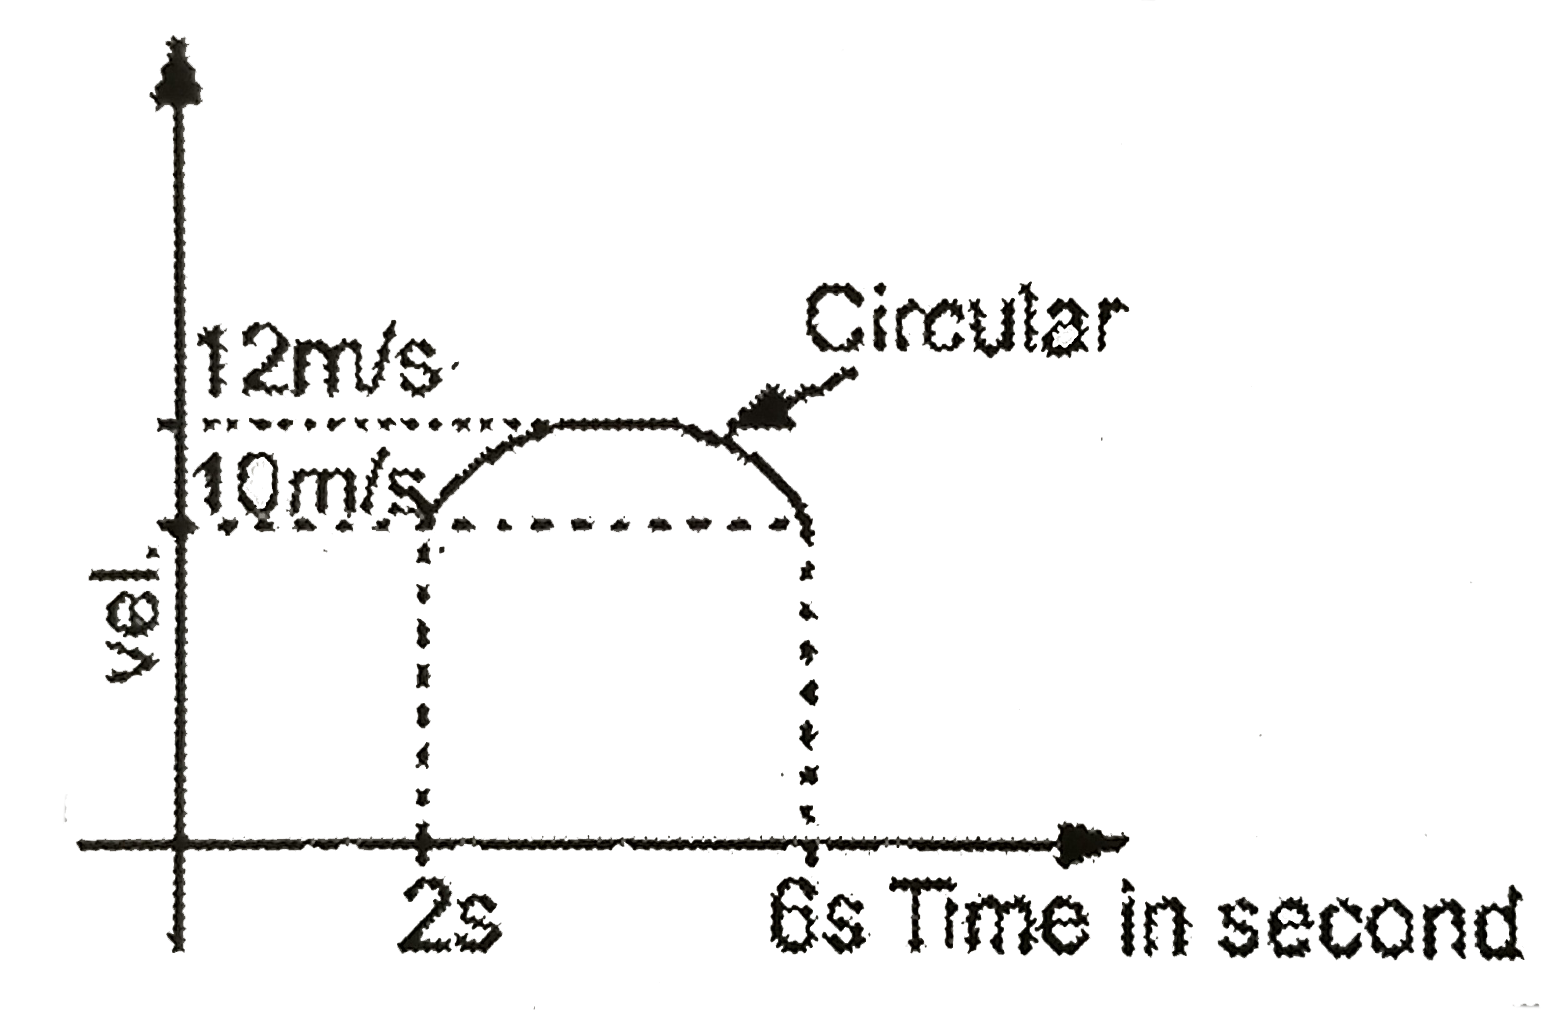 A2πmB(2π+40)mC4πmD40m
In the given v-t graph the distance travelled by the body in 5 seconds will be
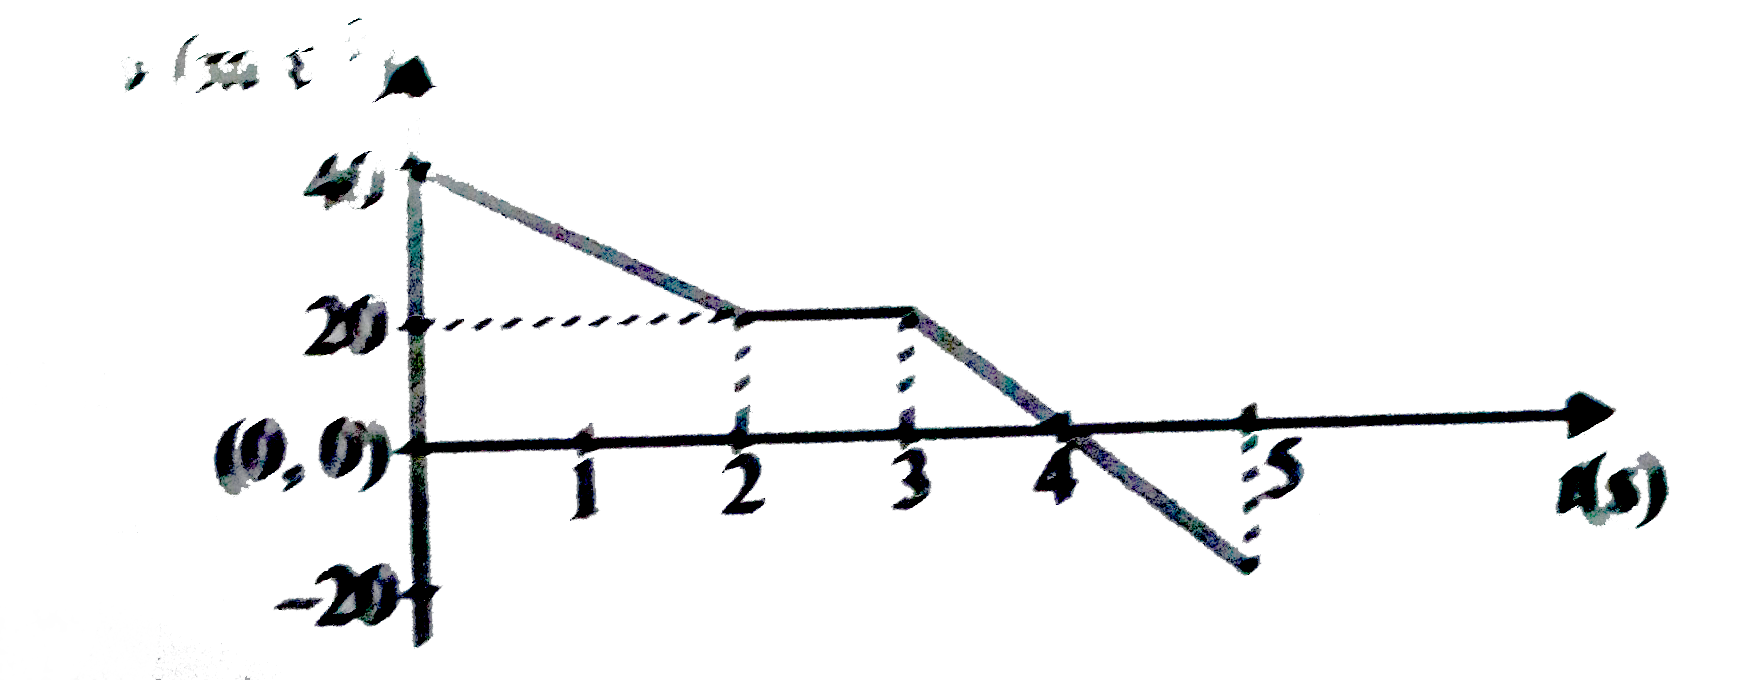 A100 mB80 mC40 mD20 m
The velocity of a particle varies with time as per the figure shown. The distance travelled by the particle in 10 seconds is ?(m/s)
View SolutionSpeed time graph of a particle shown in figure. Find distance travelled by particle in 5second.
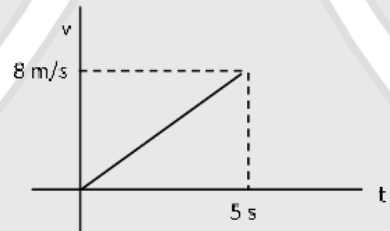
View SolutionSpeed time graph of a particle shown in figure. Find distance travelled by particle in 5second.

View Solution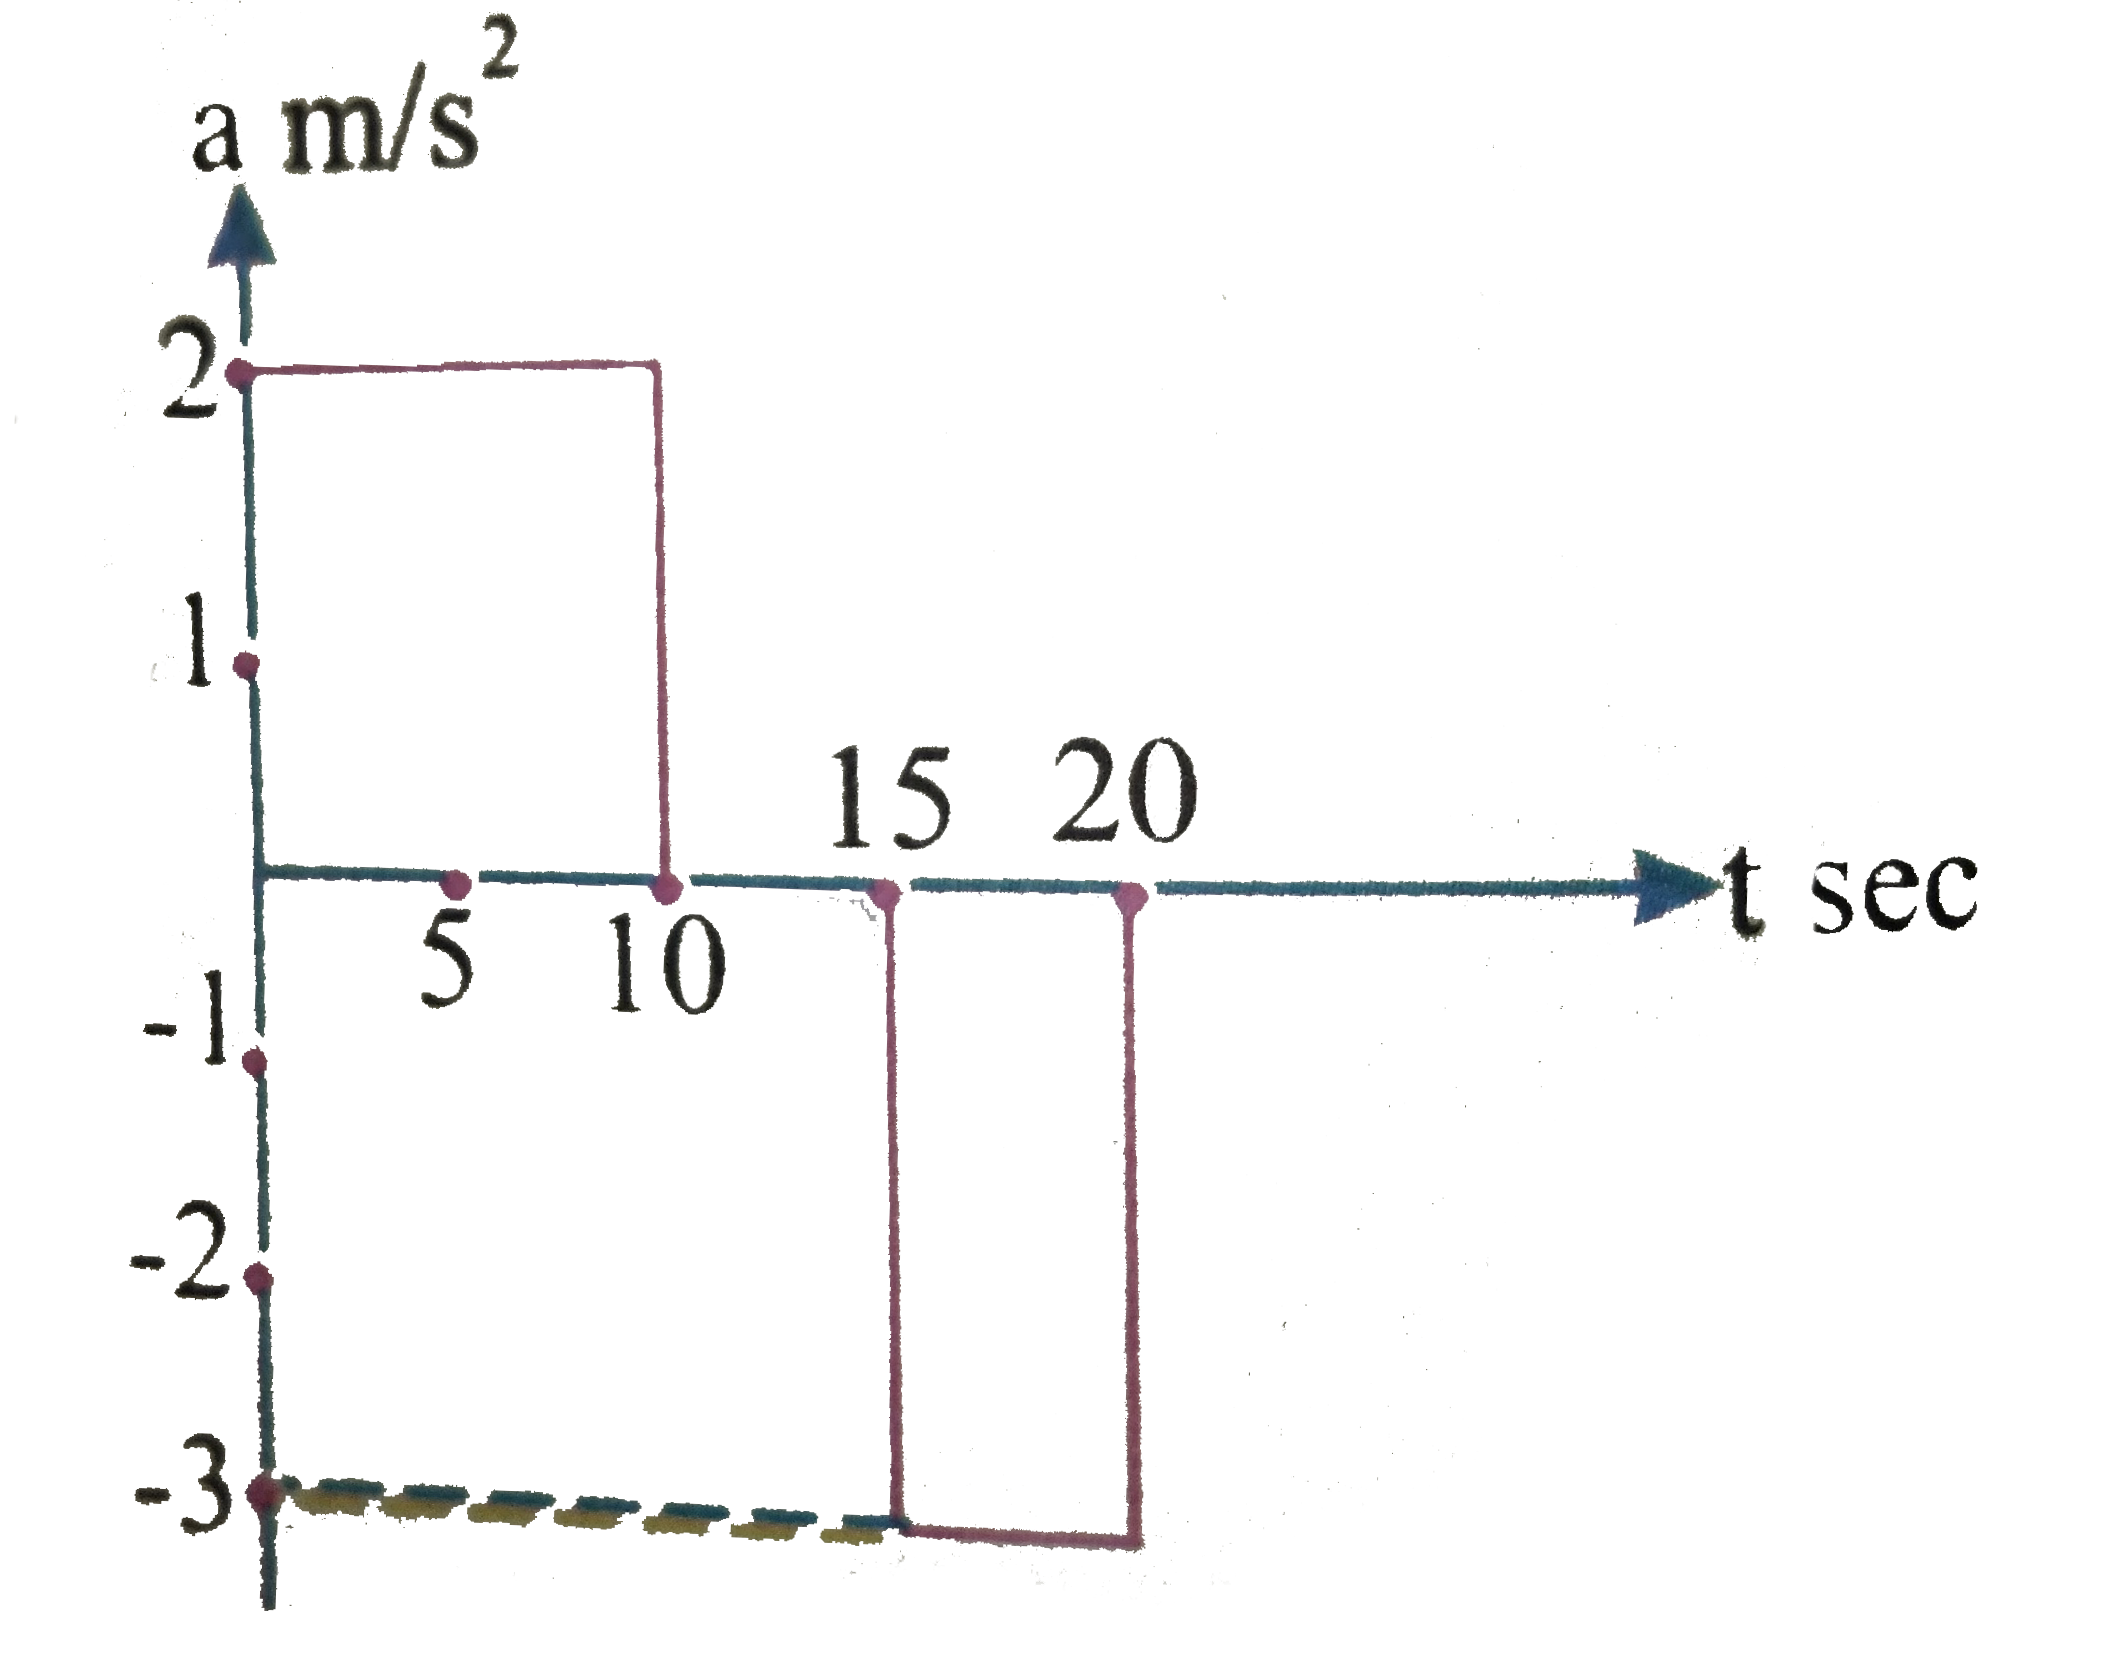
A particle starts from rest and accelerated as shown in the graph. Determine
(a). The particle's speed at t=10s and at t=20s
(b). The distance travelled in the first 20s.
View SolutionIn the given v-t graph the distance travelled by the body in 5 seconds will be

View Solution
