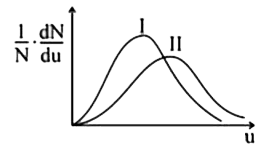
Following curves are plotted according to Maxwell distribution of molecular speed.

A
For He gas, temperature corresponding to I curve is higher than II curve.
B
At same temperature, I and II curve may represent N2andO2 gas respectively.
C
Fraction of molecules having Umps is more in curve I than curve II.
D
I and II curve may represent O2(g) at 300 K and SO2(g) at 500 K respectively.
Text Solution
The correct Answer is:C
Theory Based
|
Topper's Solved these Questions
Similar Questions
Knowledge Check
According to Maxwell Boltzmann distribution of energy
Athe fraction of molecules with most probable kinetic energy decrease at higher temperaturesBthe fraction of molecules with most probable kinetic energy increases at higher temperaturesCmost probable kinetic energy decreases at higher temperaturesDmost probable kinetic energy decreases at higher temperatures.Maxwell distribution is true when
Asystem contain single objectBsystem contains two objectsCsystem is emptyDsystem contains large number of objectsWhich of the following statement about Maxwell Boltzmann law of distribution of molecular speeds is//are correct ?.
AThe fraction of molecules having speed between c and (c+dc) (regardles of direction) is given by 4π(M2πRT)3/2c2exp(−Mc22RT)dc .BThe average speed is the arithmetic mean of the differnet speeds of all the molecules present in a given sample of the gas .CThe speed distribution curve becomes sharper and is more peaked at higher temperature as the average speed increases .DThe speed distribution function is used to determine average molecular speeds .
Explain Maxwell distribution of molecular speed with necessary graph.
View SolutionMaxwell Distribution Curves
View SolutionConsider the following statement regarding Maxwell's distribution of speeds. The correct statement(s) is/are :
View SolutionAccording to Maxwell Boltzmann distribution of energy
View SolutionConsider the following statement regarding Maxwell's distribution of speeds. The correct statement(s) is/are :
View Solution
