Graph of cut -off potential (V0) versus frequency (f) for same intensity of light for metal plates A and B are as shown in the figure below. Choose the correct statement.
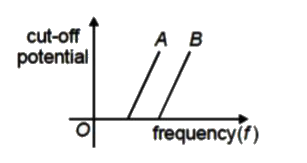
Work function of metal A is greater than work function of metal B
Work function of metal A is less than work function of metal B
Work function of metal A is equal to work function of metal B
Both line have same intercept
The correct Answer is:B
hf=hf0+eV0
∴eV0=hf−hf0
V0=hfe−hf0e
As (Intercept)B>(Intercept)A
(hf0e)B>(hf0e)A
∴ΦA<ϕB
Topper's Solved these Questions
Similar Questions
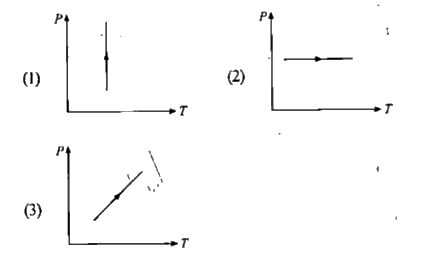
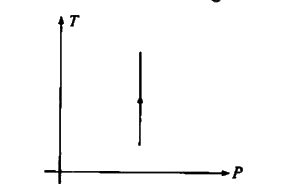
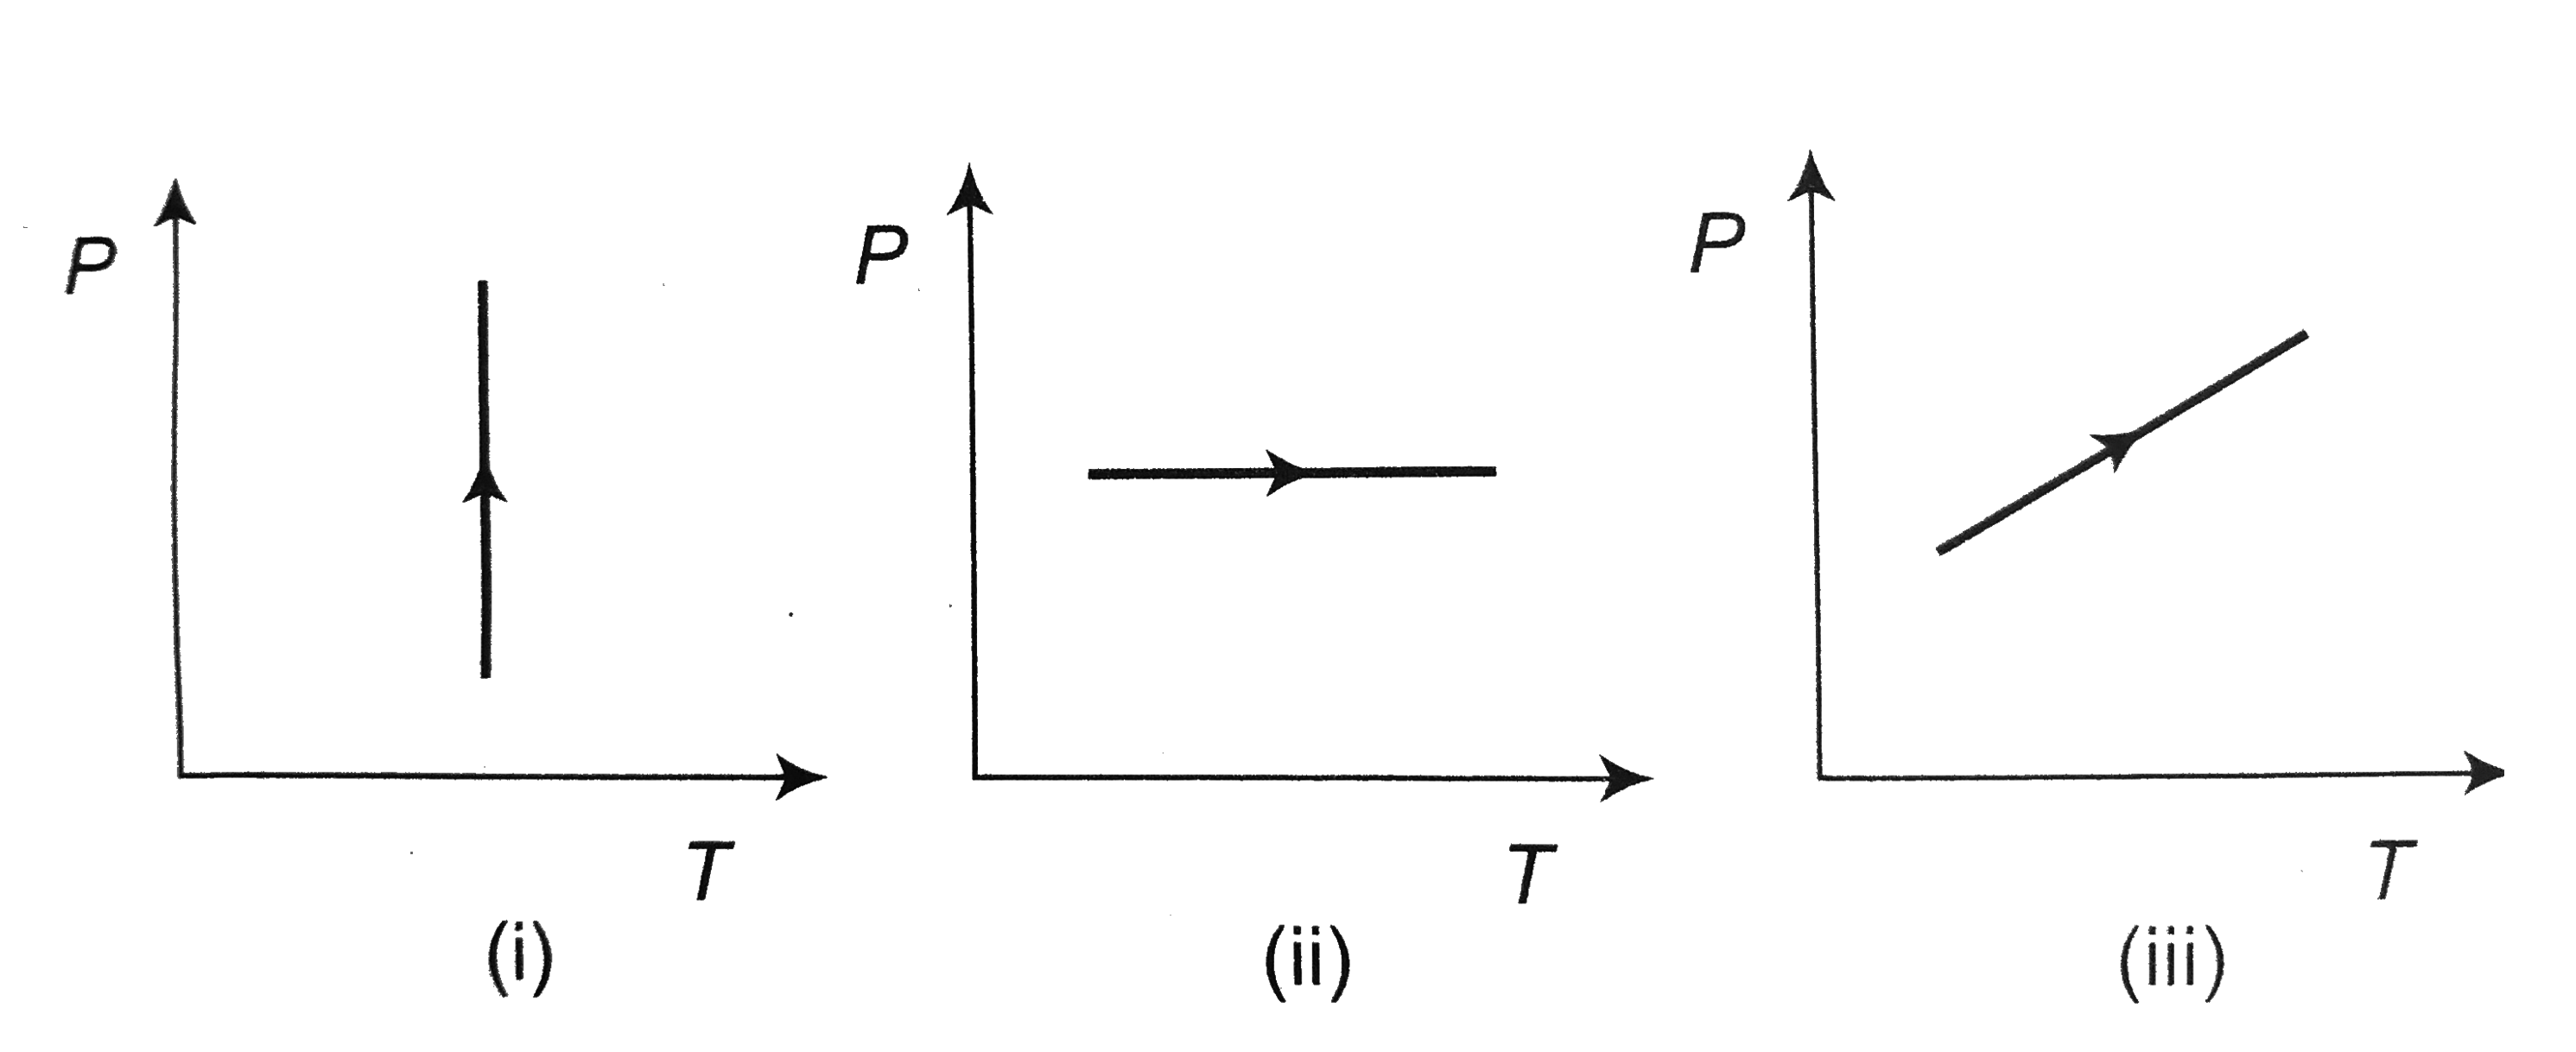
P-T graphs of an ideal gas are as shown in figures-2.42 below. Choose the wrong statement from the options given:
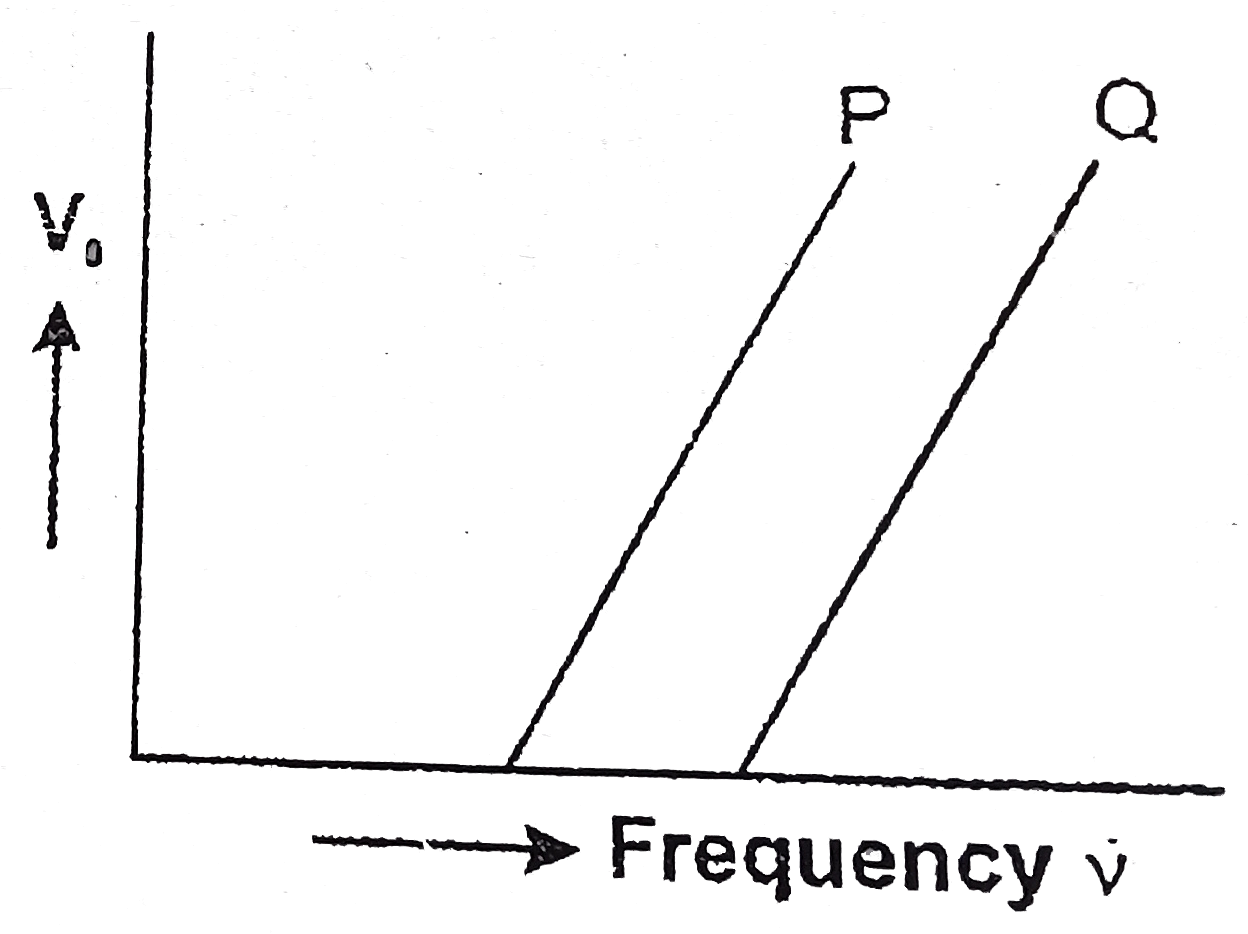
View SolutionThe graph between the stopping potential V0 and frequency v for two different metal plates P and Q are shown in the figure. Which of the metals has greater threshold wavelength and work function.
View Solution
Knowledge Check
Circuit as shown in figure below, choose the correct statement
 A(A) current in resistance R and current in inductor L.a.c. source will be in 90^(@ phase differenceBotential drop across R and potential drop across L will be in same phaseCcurrent through C and current through L will be in 90∘ phase differenceDcurrent in R and current in L will be in same phase
The velocity - time graph of two bodies A and B is shown in figure. Choose correct statement.
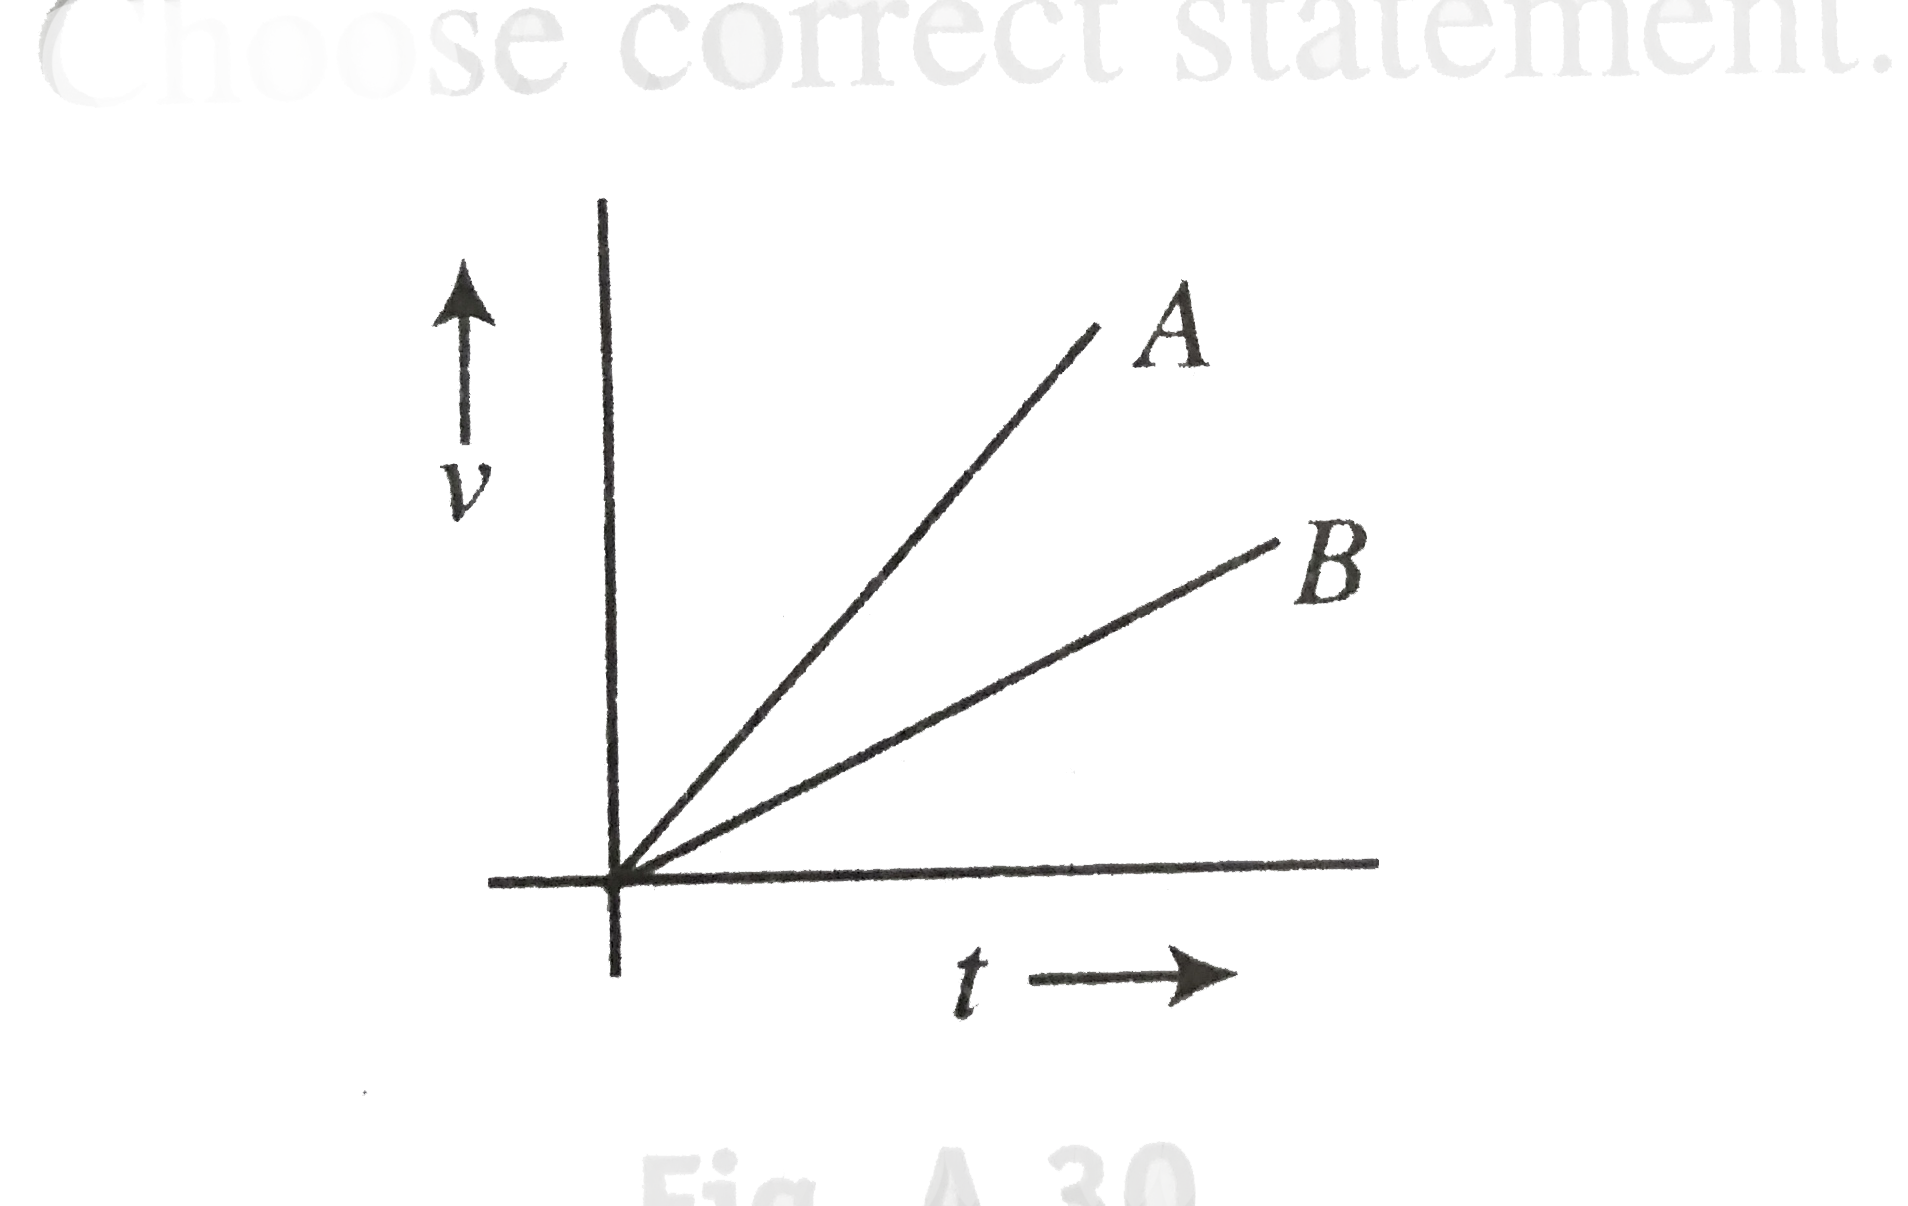 Aacceleration of Bgt acceleration of ABacceleration of A gt acceleration of BCboth are starting from same pointDA covers greater distance than B in the same time.
A graph of x verus t is shown in the figure given below. Choose correct alternatives from below.
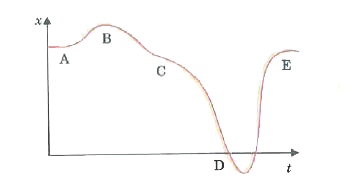 AThe particle was released from rest at t = 0 .BAt B, the acceleration a>0 .CAt C, the velocity and the acceleration vanish .DAverage velocity for the motion between A and D is positive .
Pressure versus temperature graph of an ideal gas are as shown in figure-2.39. Choose the wrong statement
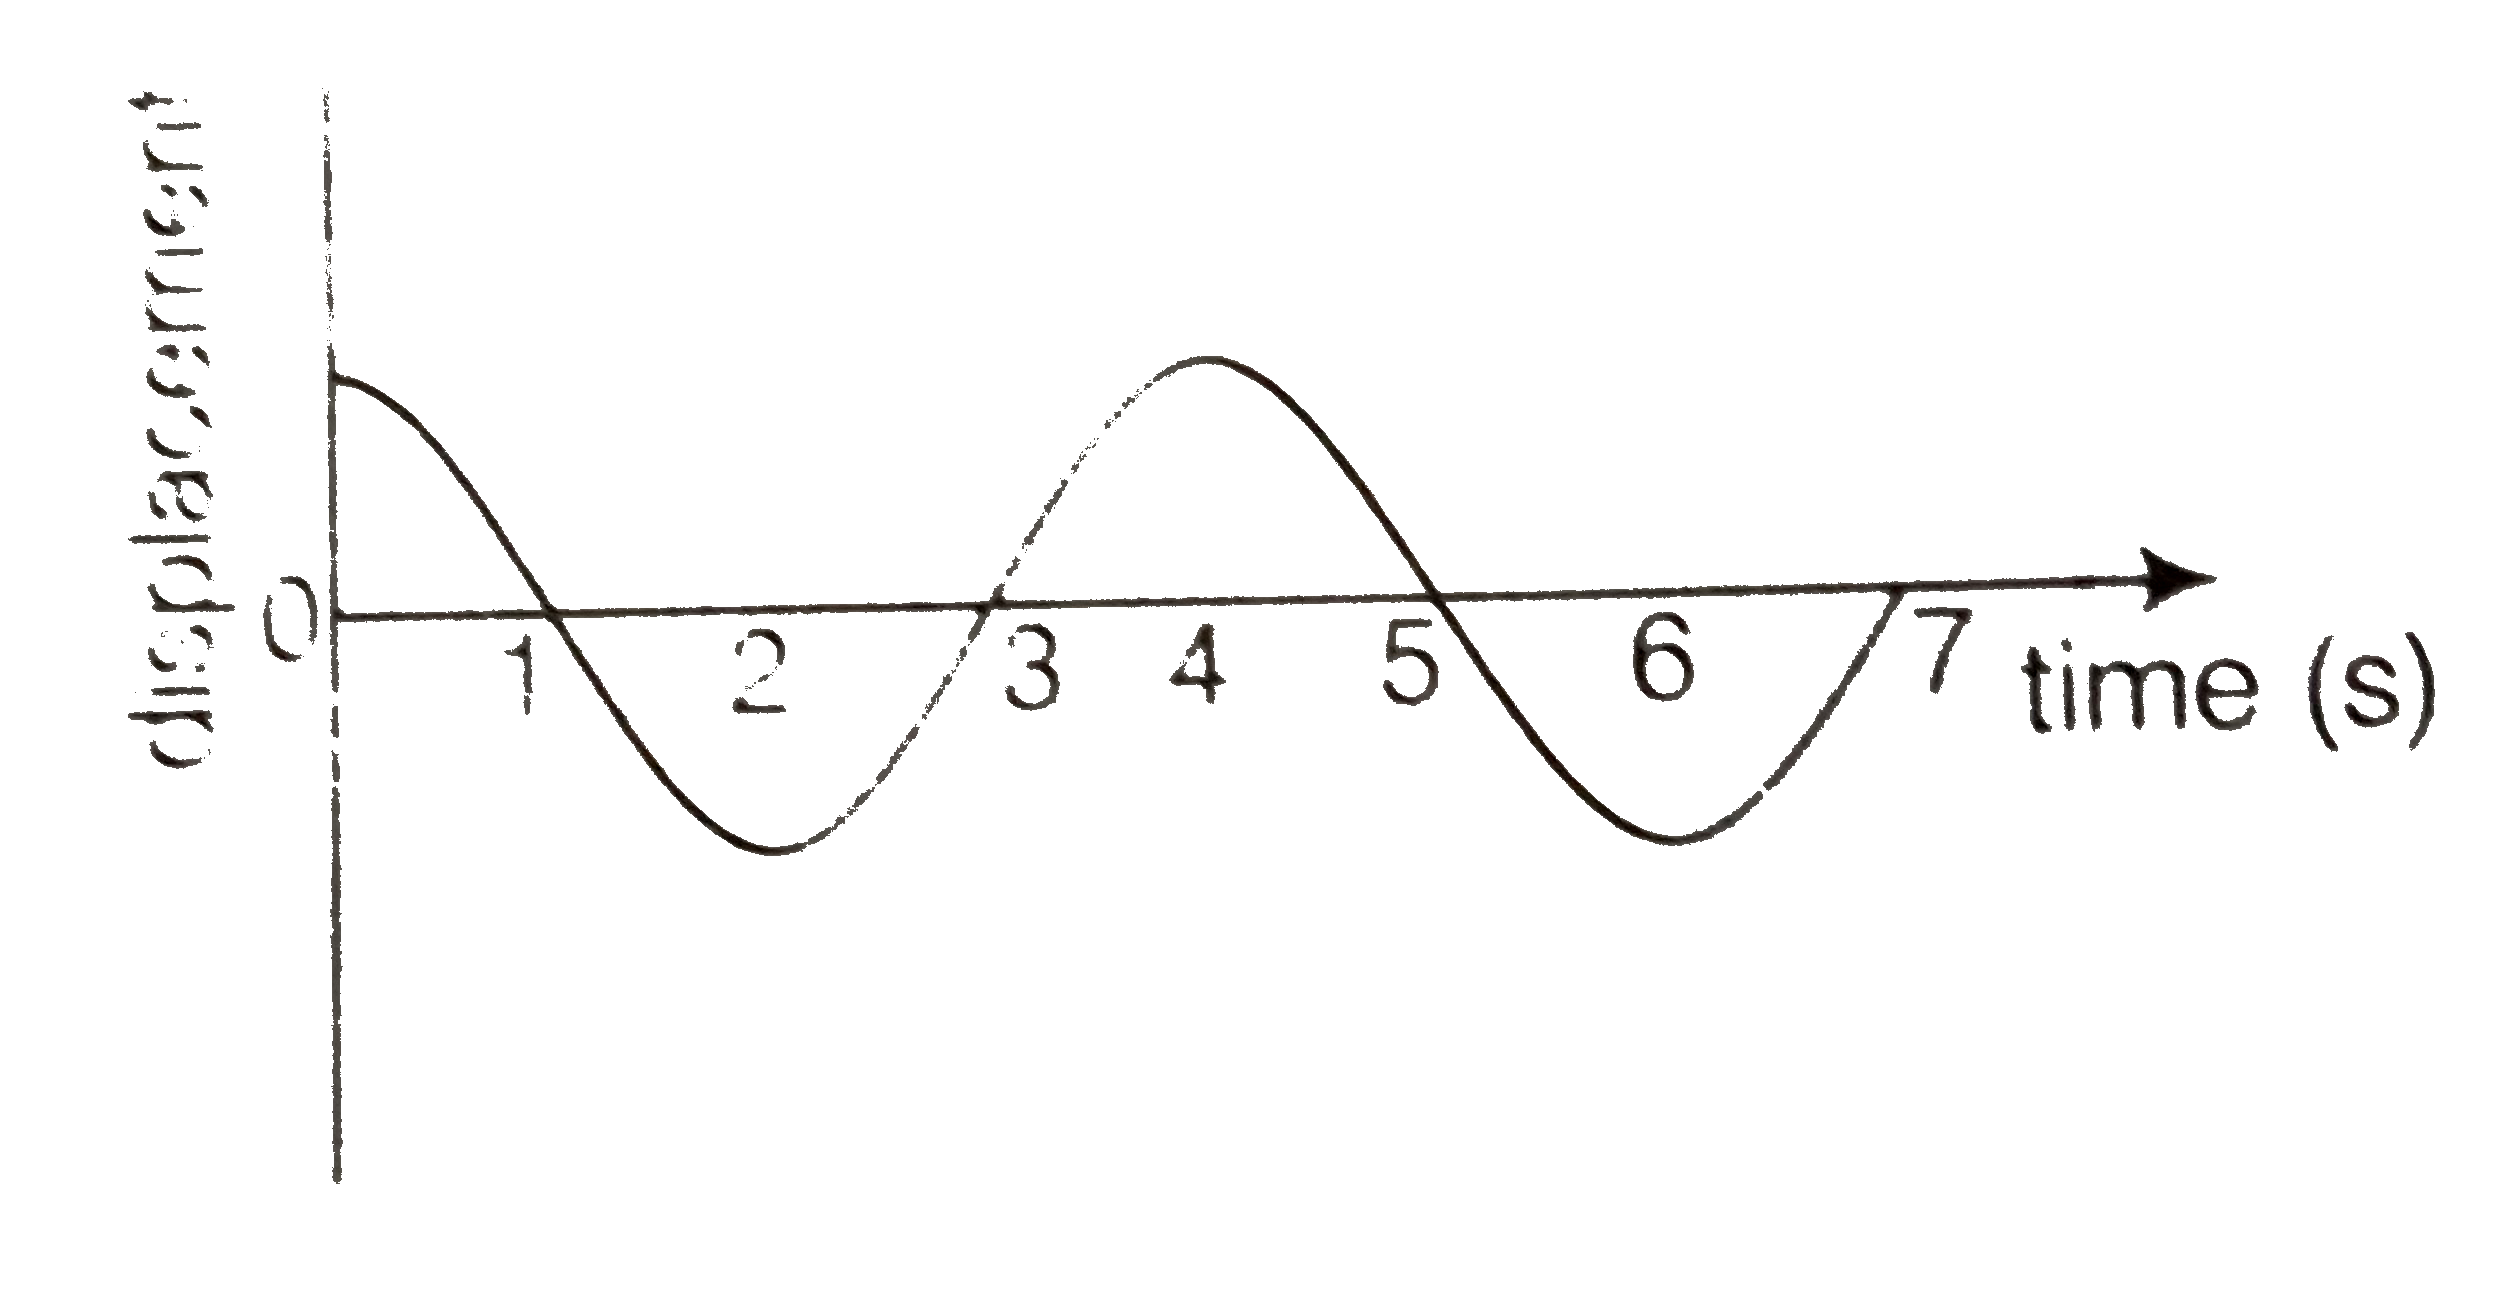
View SolutionDisplacement versus time curve for a particle executing SHM is shown in figure. Choose the correct statements.
View Solution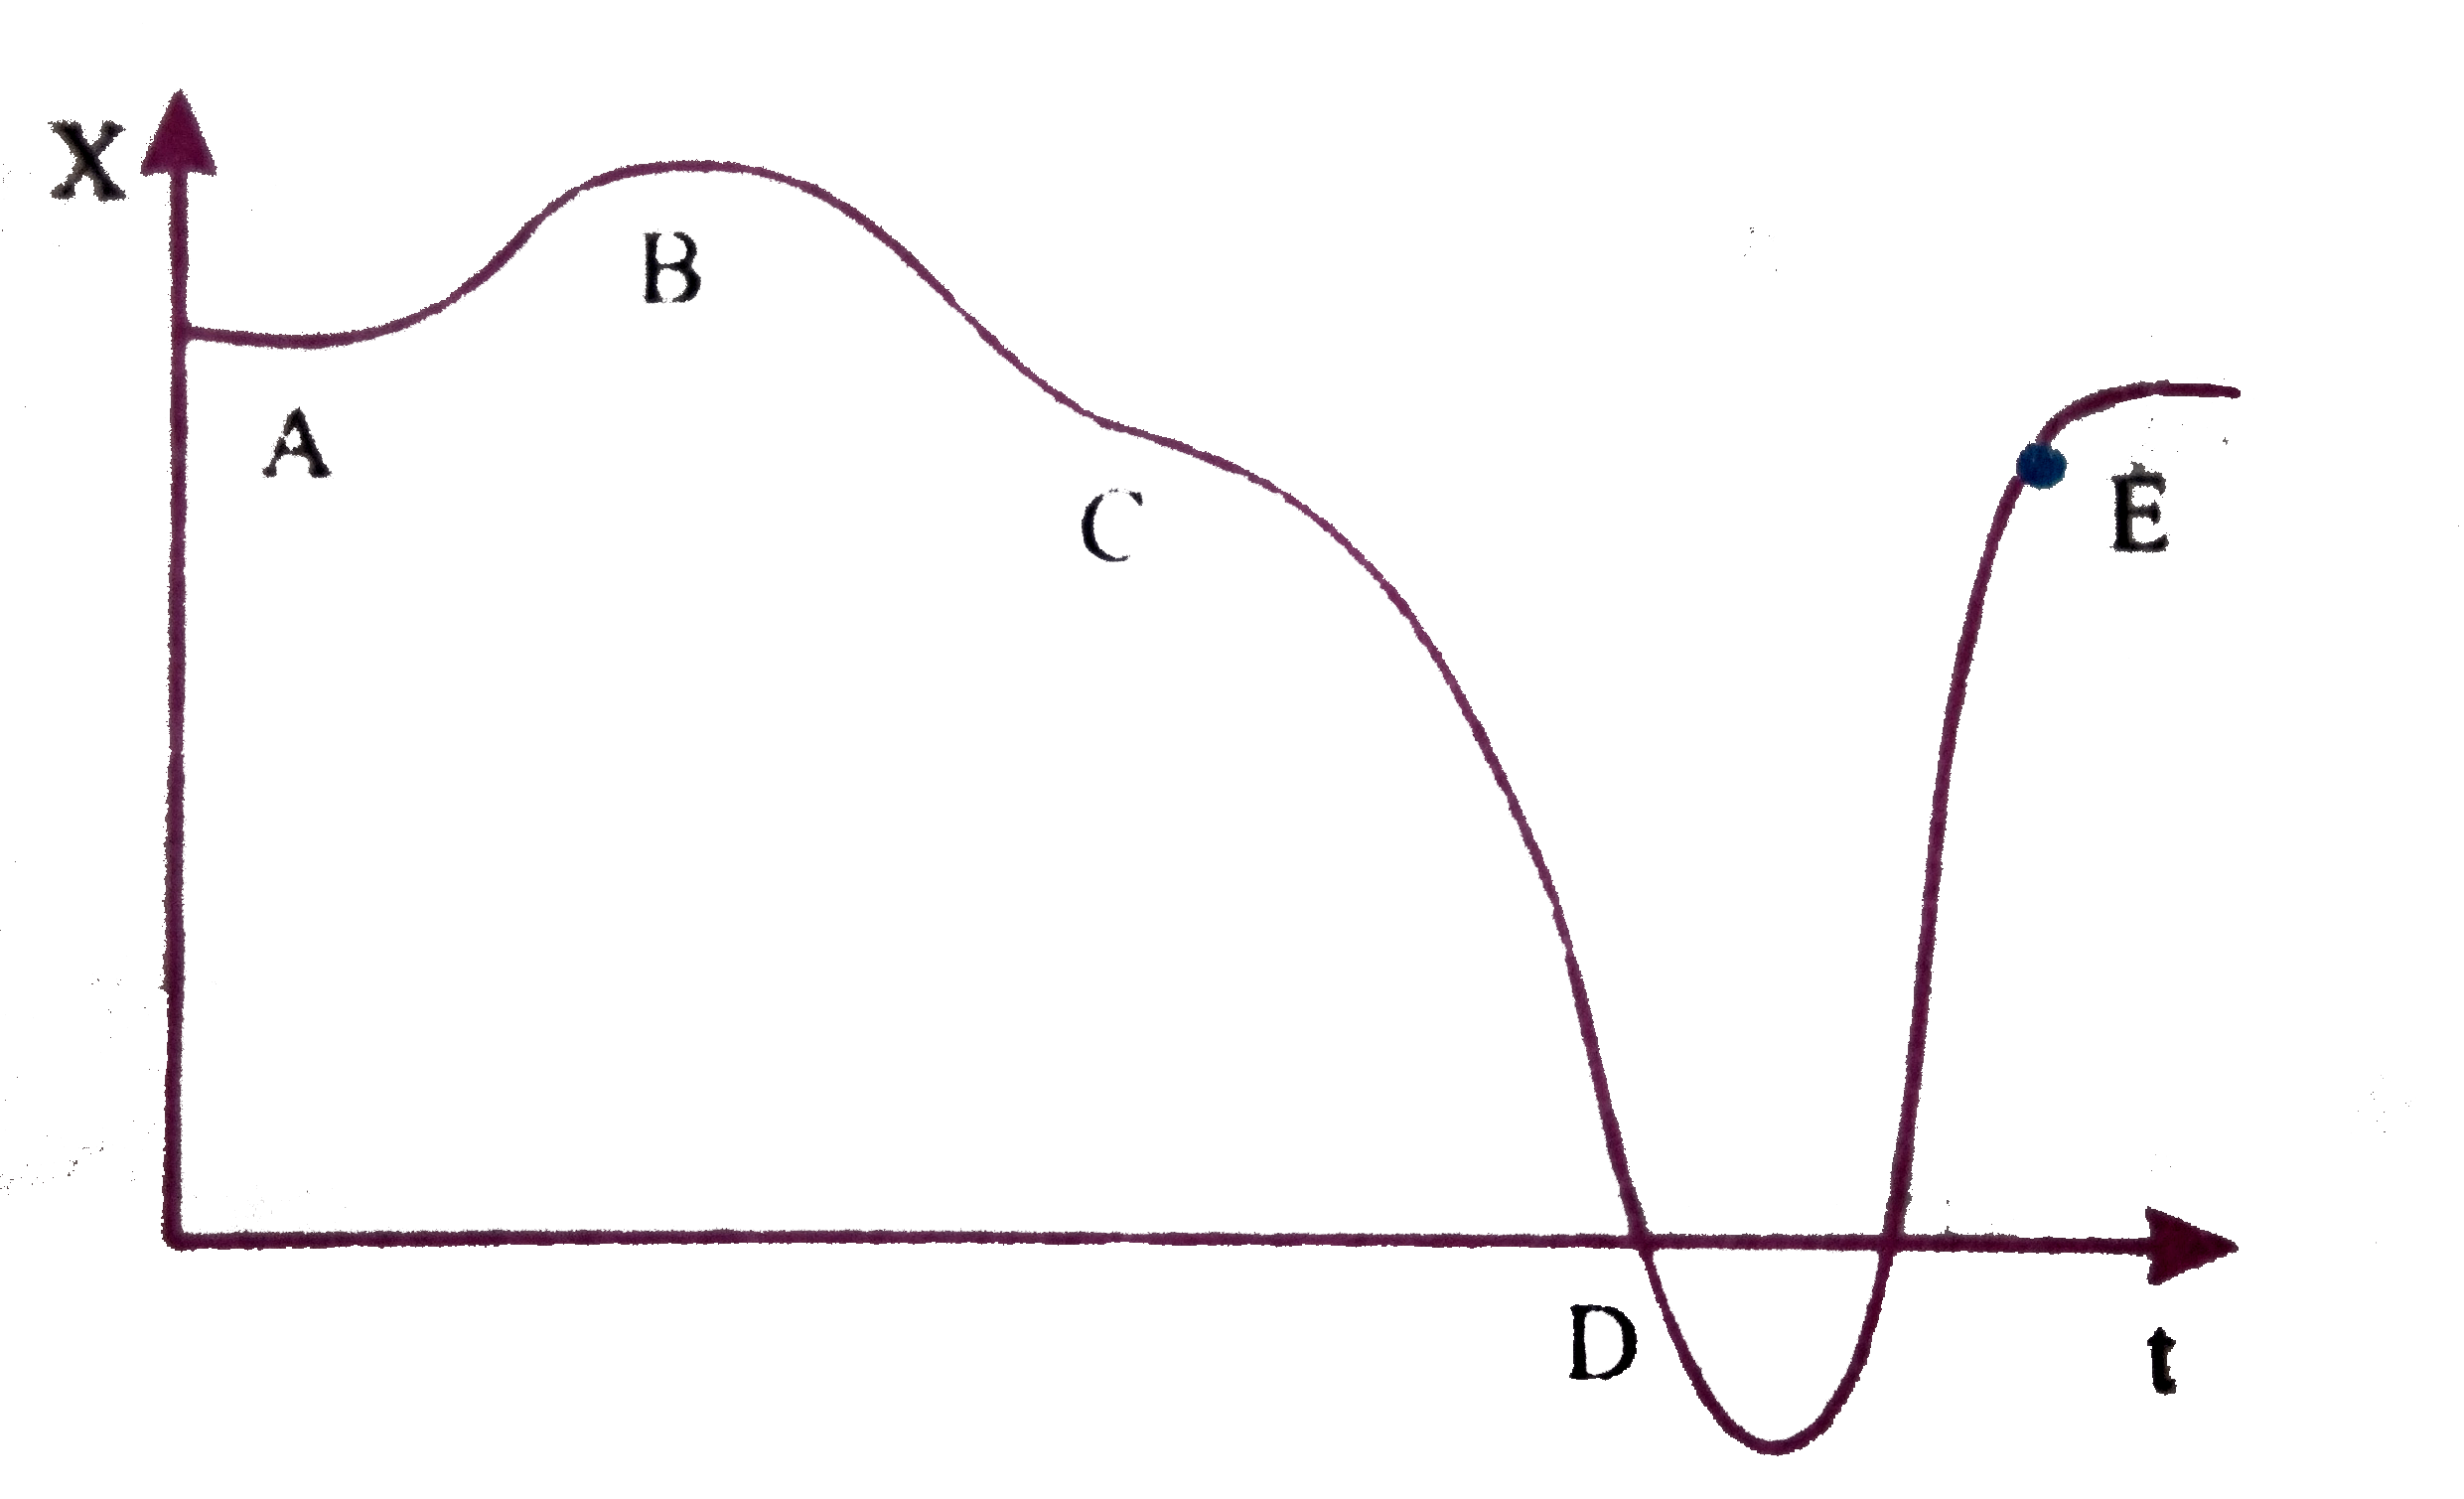
A graph of x versus t is shown in figure. Choose correct alternative from below.
View SolutionPressure versus temperature graphs of an ideal gas are as shown in figure. Choose the wrong statement
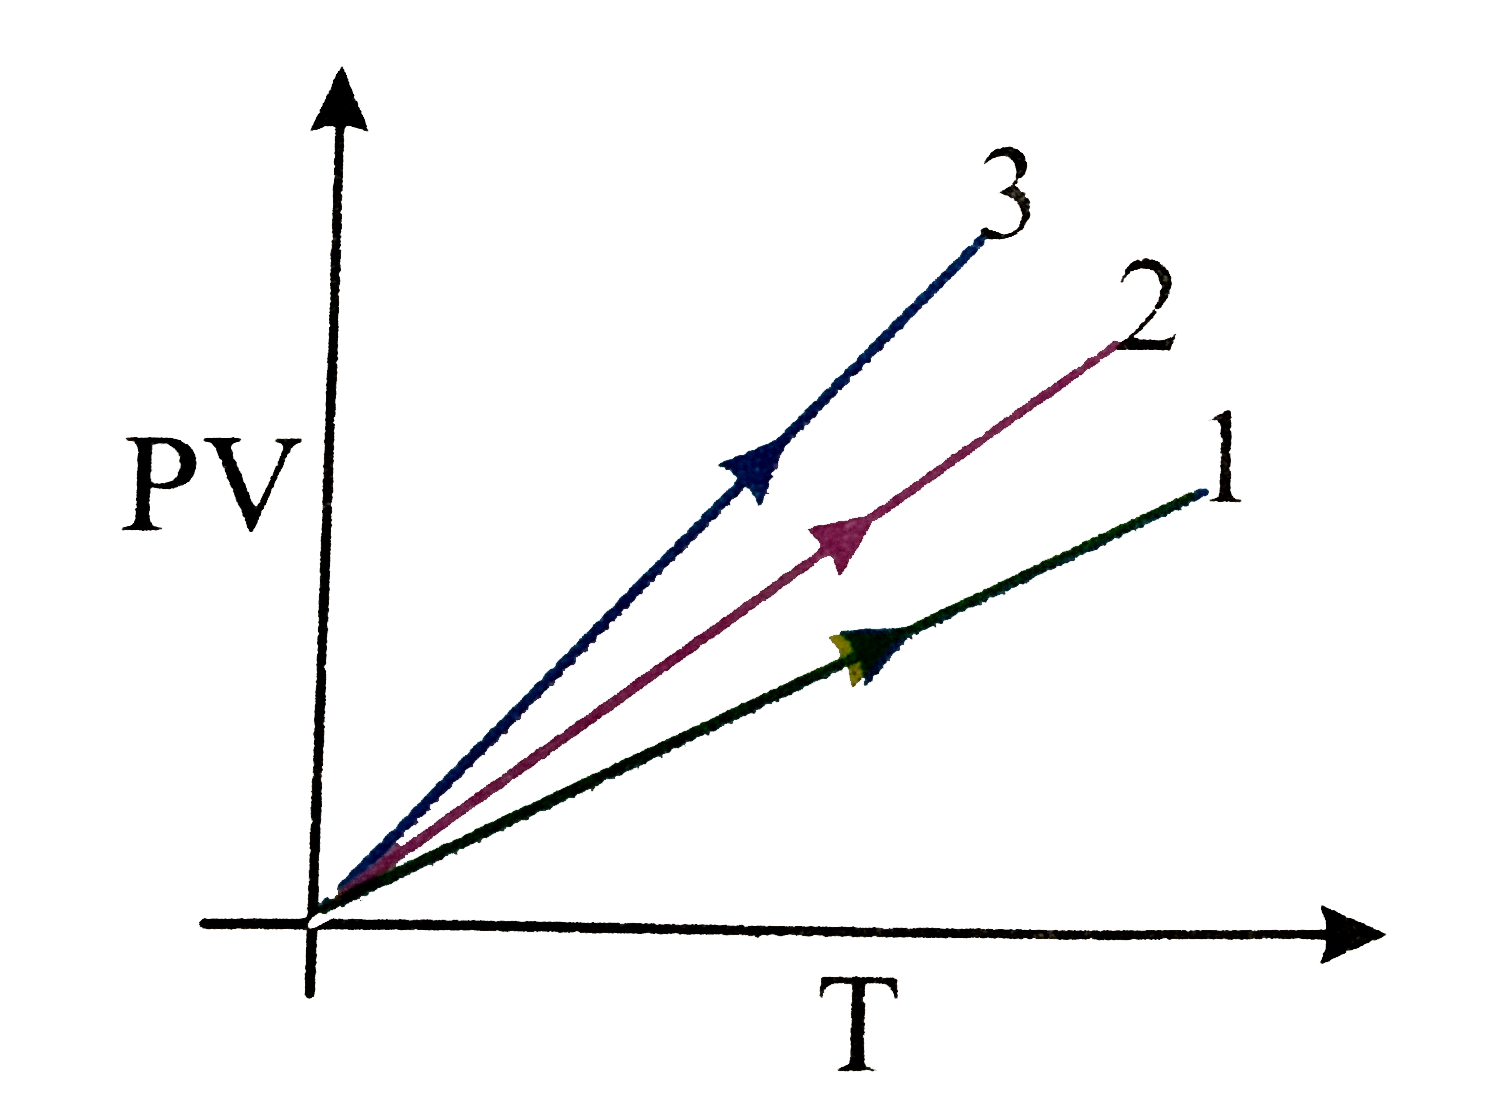
View SolutionPV versus T graph of equal masses of H2, He and CO2 is shown in figure. Choose the correct alternative?
View Solution
