P-T graph for same amount of an ideal gas is allowed to expand as shown in the figure below. Then which of the following is right?
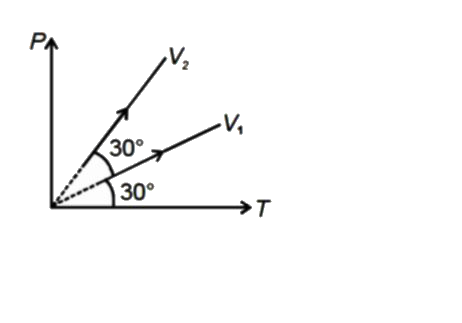
V1<V2
V1>V2
V1=V2
There is no realation between v1andV2.
The correct Answer is:B
V1>V2
Topper's Solved these Questions
Similar Questions
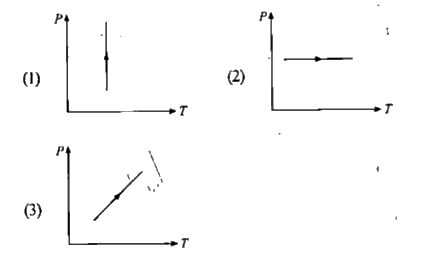
P-T graphs of an ideal gas are as shown in figures-2.42 below. Choose the wrong statement from the options given:
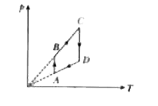
View SolutionPressure temperature (p-1) graph of n moles of an ideal gas is shown in the figure. Among the following four graphs, which are the corresponding pressure volume (p-V) and density pressure (p-p) graphs?
View Solution
Knowledge Check
If a gas is allowed to expand at constant temperature then which of the following does not hold true?
Athe kinetic energy of the gas molecules decreasesBthe kinetic energy of the gas molecules increasesCthe kinetic energy of the gas molecules increasesDCannot be predicted unless volumes of the gases are givenThe ednsity (ρ) of an ideal gas varies with temperature T as shown in figure. Then
 Athe product of P and V at A is equal to the product of P and V at BBpressure at B is greater than the pressure at ACwork done by the gas during process AB is negativeDthe change in internal energy from the A to B is zero
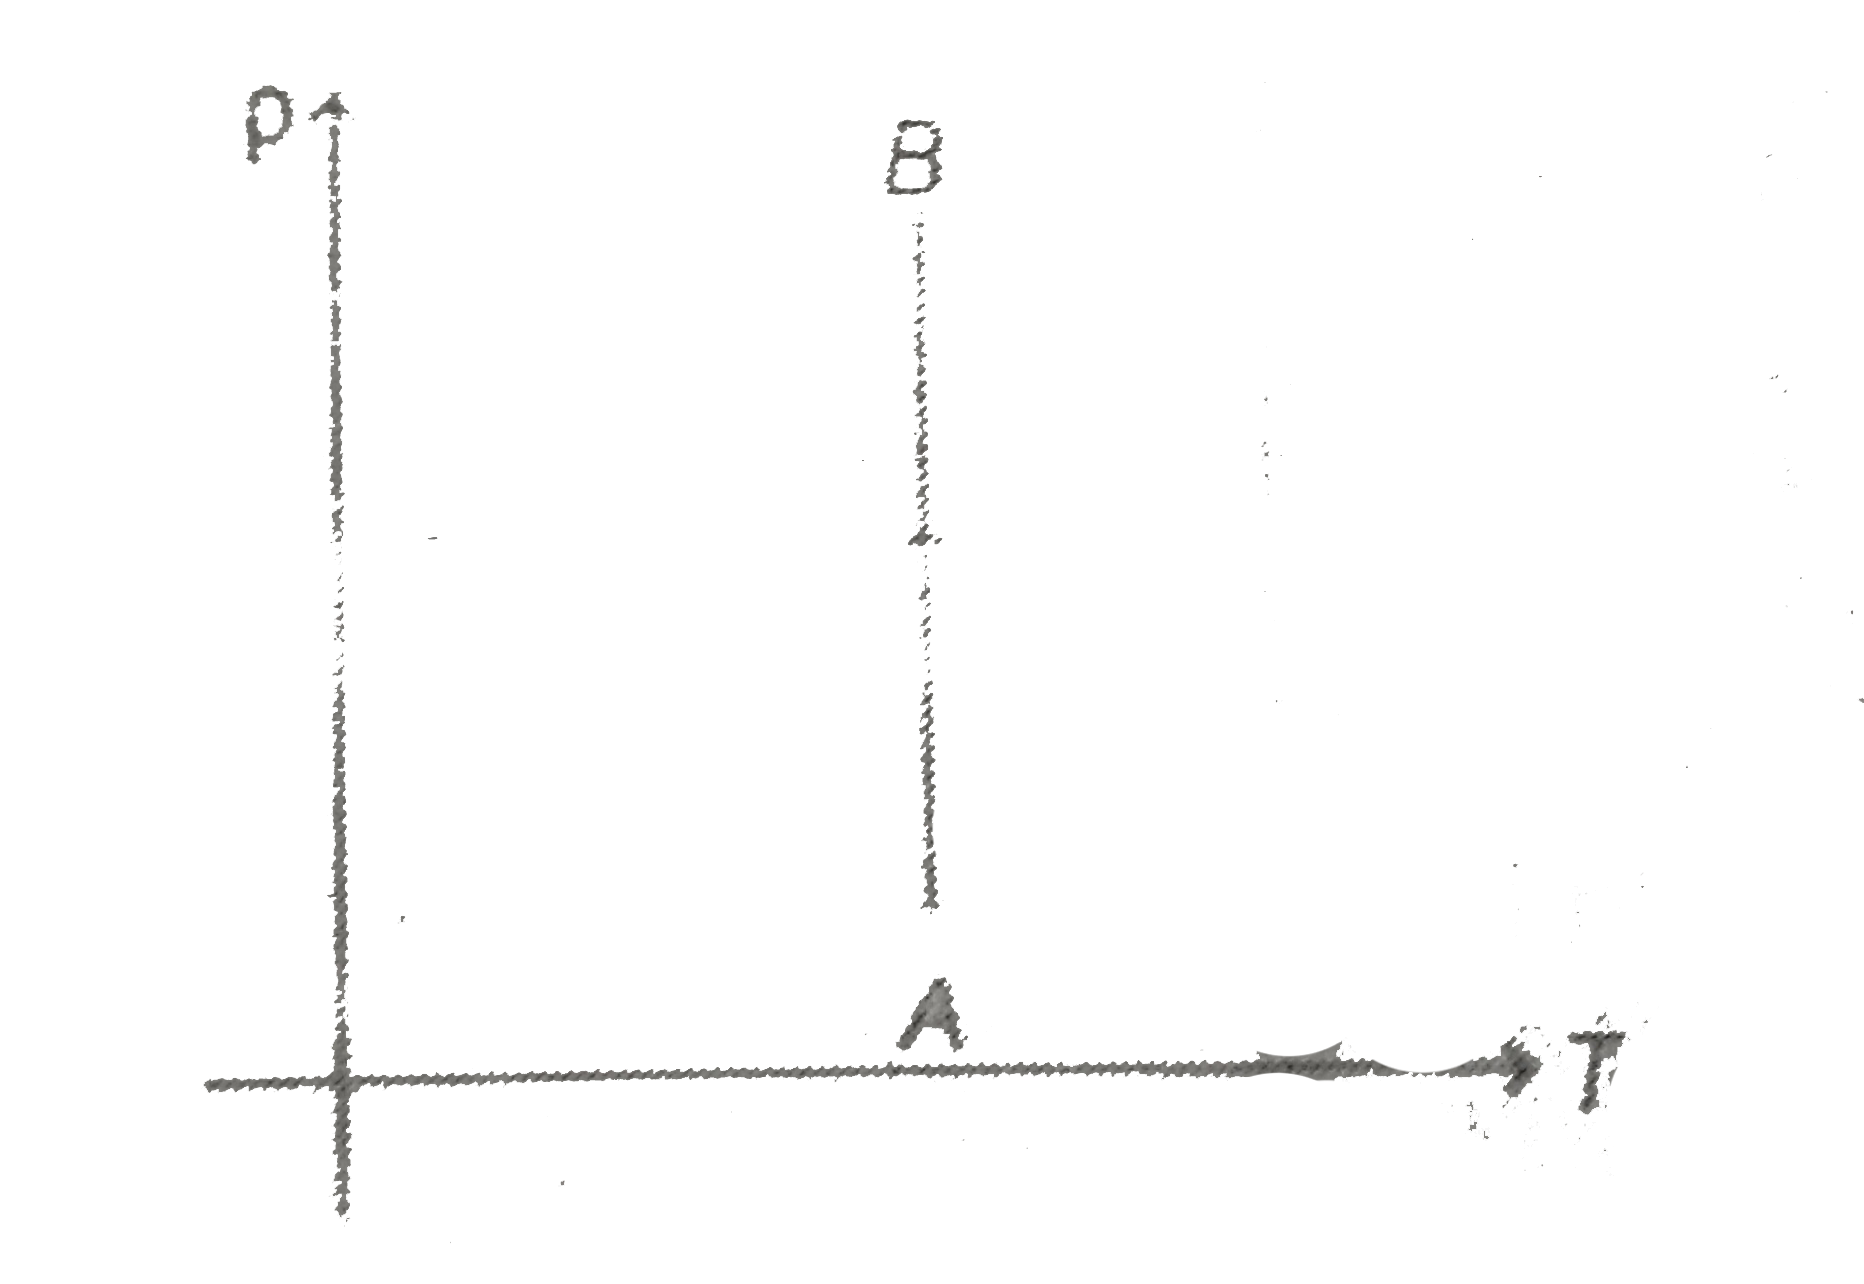
For a fixed amount of an ideal gas P us T plot is given as shown. Identify the correct option.
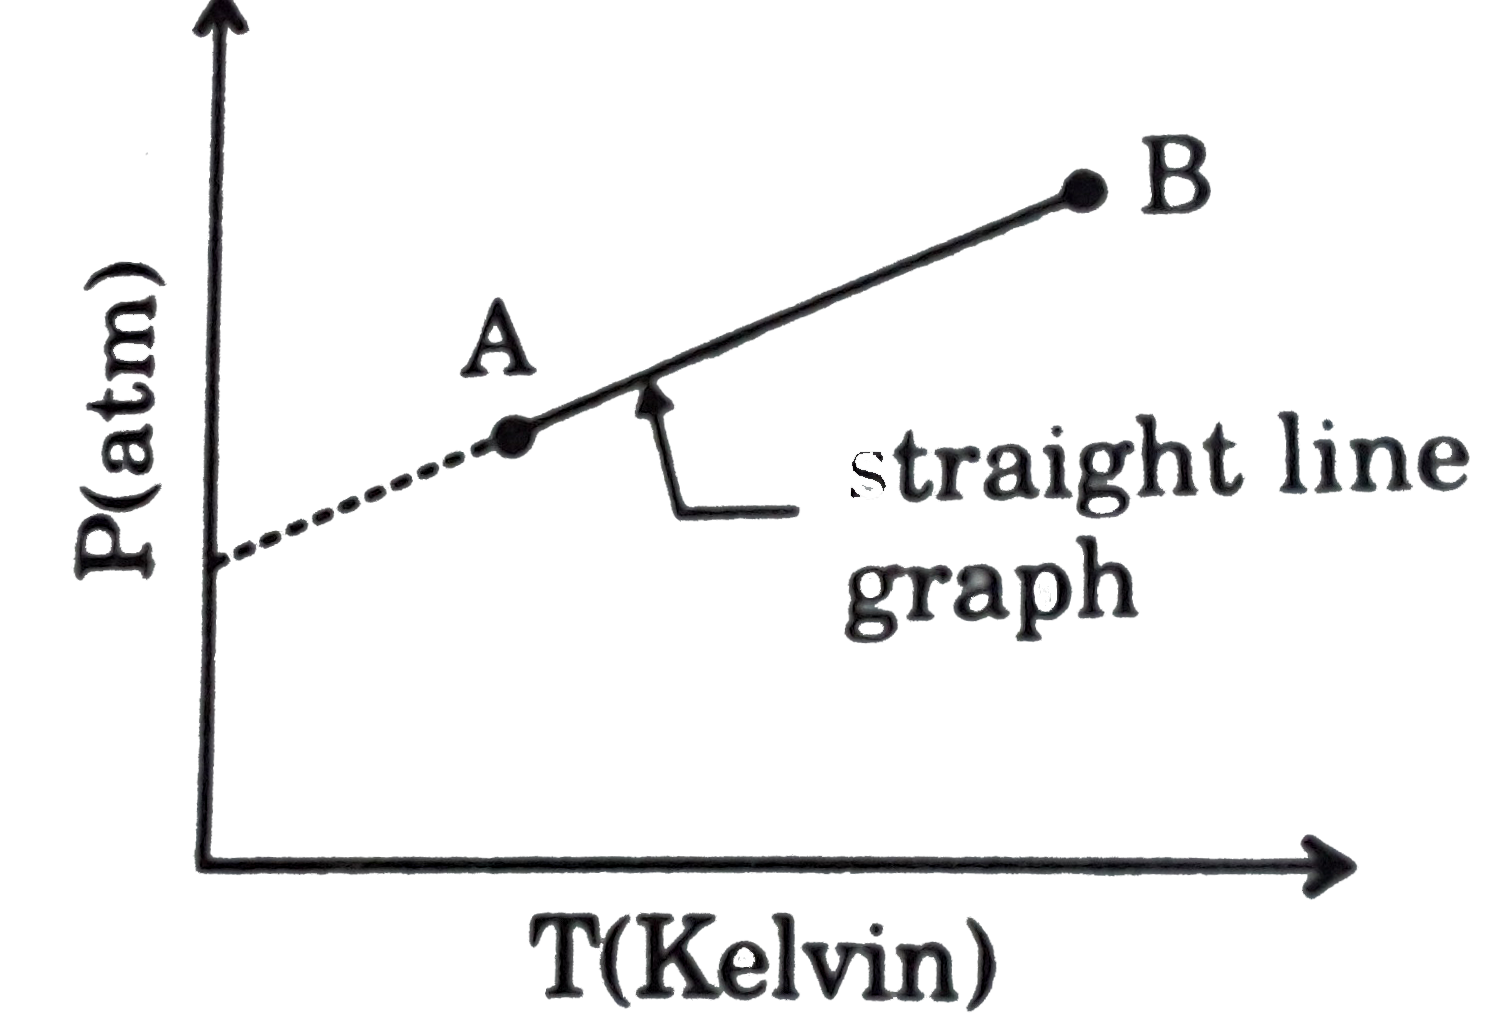 AThe change from A to B should be isochoricBVolume first increases reached maxima and then decreasesCPV=nRT is not applicableDNone of the statements are correct
The P−T graph for the given mass of an ideal gas is shown in figure. Then the volume
_E01_022_Q01.png)
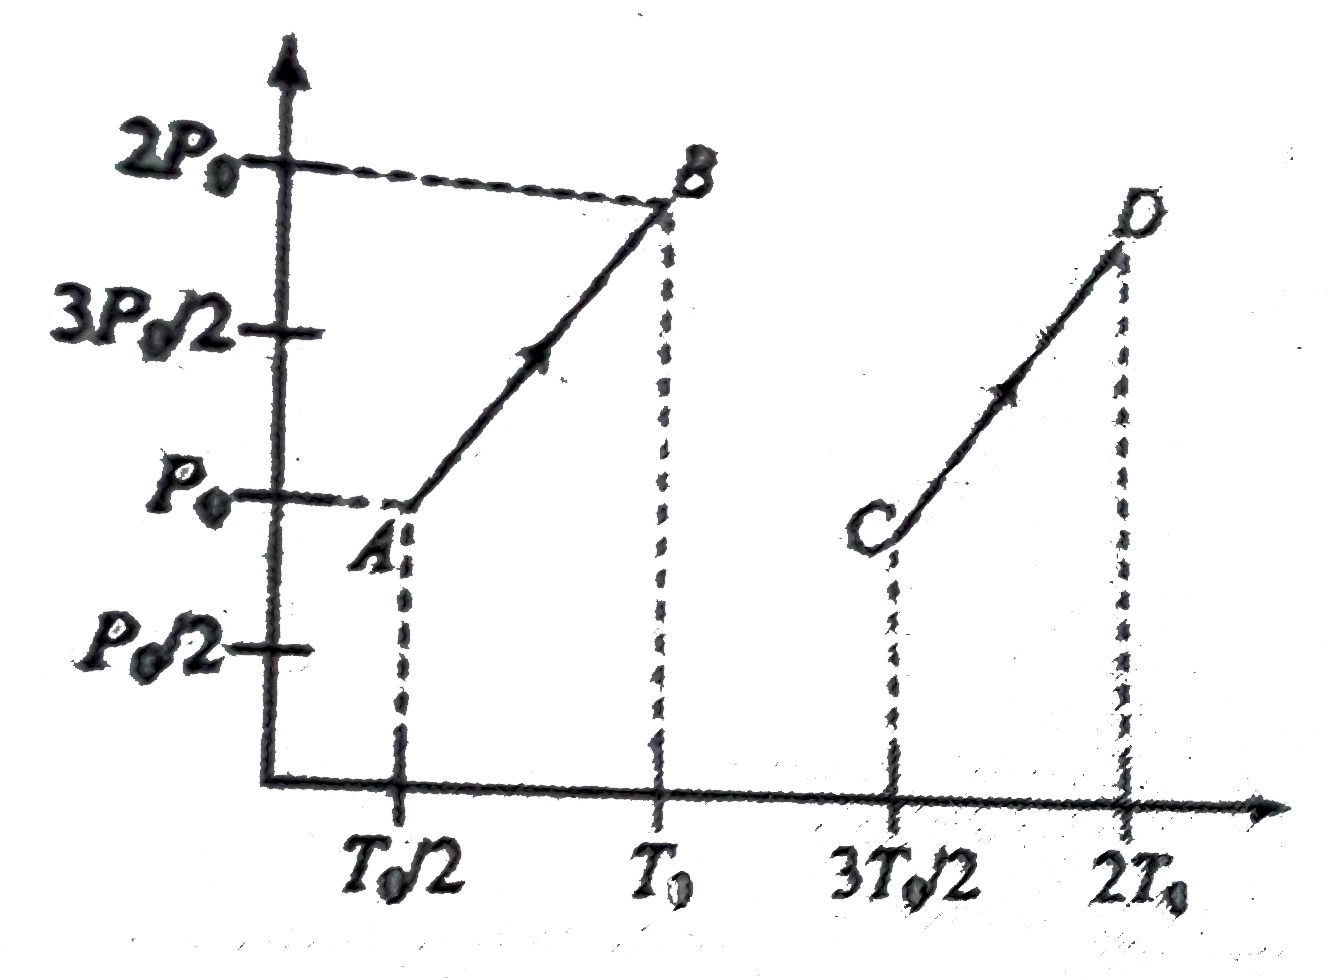
View SolutionP-T graph for same number of moles of two ideal gases are shown . Find the path along which volume decreases .
View Solution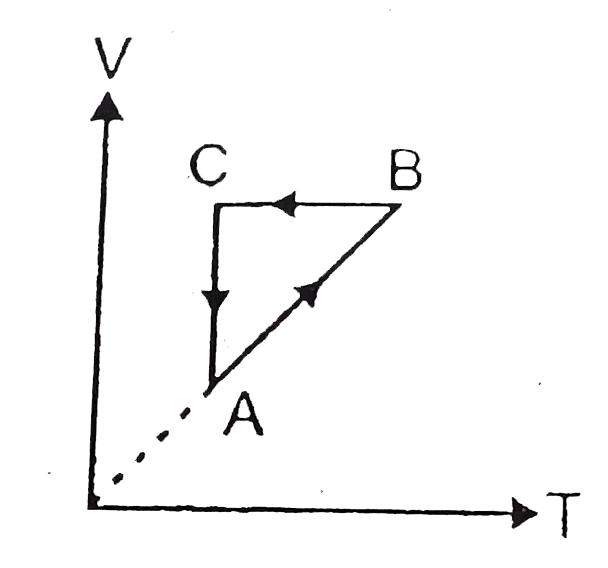
An ideal undergoes a thermodynamic cycle as shown in figure. Which of the following graphs represent the same cycle?
View SolutionFor fixed amount of an ideal gas identify the incorrect graph :
View SolutionThe process on an ideal gas, shown in figure,is <br><imga≤ocr_imageload∈g=lazysrc=https://d10lpgp6xz60nq.cloudfront.net/physics_imagesHCV_VOL2_C24_E01_027_Q01.pngwh=80%mx-autosty≤=background:white;>
View Solution
