Consider the following graph which of the above slope showes an ideal gas behaviour?
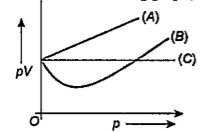
A
only A
B
only B
C
only C
D
A and B
Text Solution
The correct Answer is:C
|
Similar Questions
Knowledge Check
Which one of the following graphs correctly gives the ideal gas behaviour ?
A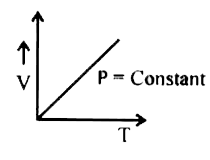 B
B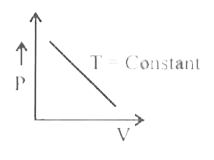 C
C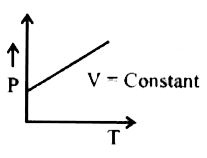 D
D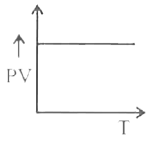
Which of the following graphs is not a straight line for an ideal gas ?
AV→TBT→PCn→1TDn→1PWhich gas shows real behaviour?
A8gO2 at STP occupies 5.6L.B1gH2 in 0.5L flask exerts a pressure of 24.63atm at 300K.C1molNH3 at 300K and 1atm occupies volume 22.4L.D5.6L of CO2 at STP is equal to 11g.
Which of the following gas always shows positive deviation from ideal gas behaviour ?
View SolutionWhich of the following graphs represent the behaviour of an ideal gas ?
View SolutionWhich of the following graphs represent the behaviour of an ideal gas ?
View SolutionA real gas show ideal behaviour at :-
View SolutionWhich of the following graphs show most significant deviation from ideal gas behaviour ?
View Solution
