The given graph shows the presence of Glucose and Galactose in the medium when Lac operon was operational.
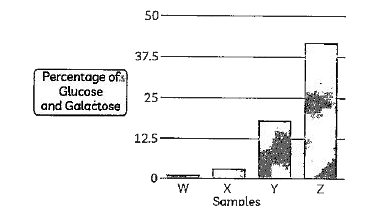
Based on the given graph, which of the samples might have an activated Gene z?
(W) and (X)
(Y) and (Z)
(Y)
(Z)
The correct Answer is:B
Sample Y and Z are showing high concentration of Glucose and Galactose. Gene z codes for the enzyme beta-galactosidase (-gal). This enzyme catalyzes the hydrolysis of lactose (disaccharide) and converts it into its monomeric units, glucose and galactose.
Topper's Solved these Questions
- SAMPLE PAPER 6Book:EDUCART PUBLICATIONChapter:SAMPLE PAPER 6Exercise:SECTION - C
Explore 12 Videos
- SAMPLE PAPER 6Book:EDUCART PUBLICATIONChapter:SAMPLE PAPER 6Exercise:SECTION - C
Explore 12 Videos
- SAMPLE PAPER 5Book:EDUCART PUBLICATIONChapter:SAMPLE PAPER 5Exercise:SECTION- C
Explore 2 Videos
- SAMPLE PAPER 7Book:EDUCART PUBLICATIONChapter:SAMPLE PAPER 7Exercise:SECTION - C
Explore 12 Videos
Similar Questions
Knowledge Check
The given double graph shows the average heights of boys and girls at specific ages. Which conclusion is supported by the graph ?
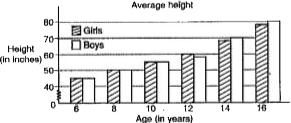 AGirls are taller than boys until the age of 14BGirls and boys grow the same amount each year.CAfter the ago of 14 , boys grow faster than girlsDBoys are always taller than girls
The given figure shows lac operon and its functioning. Select the option which correctly labels A, B, X, Y and Z
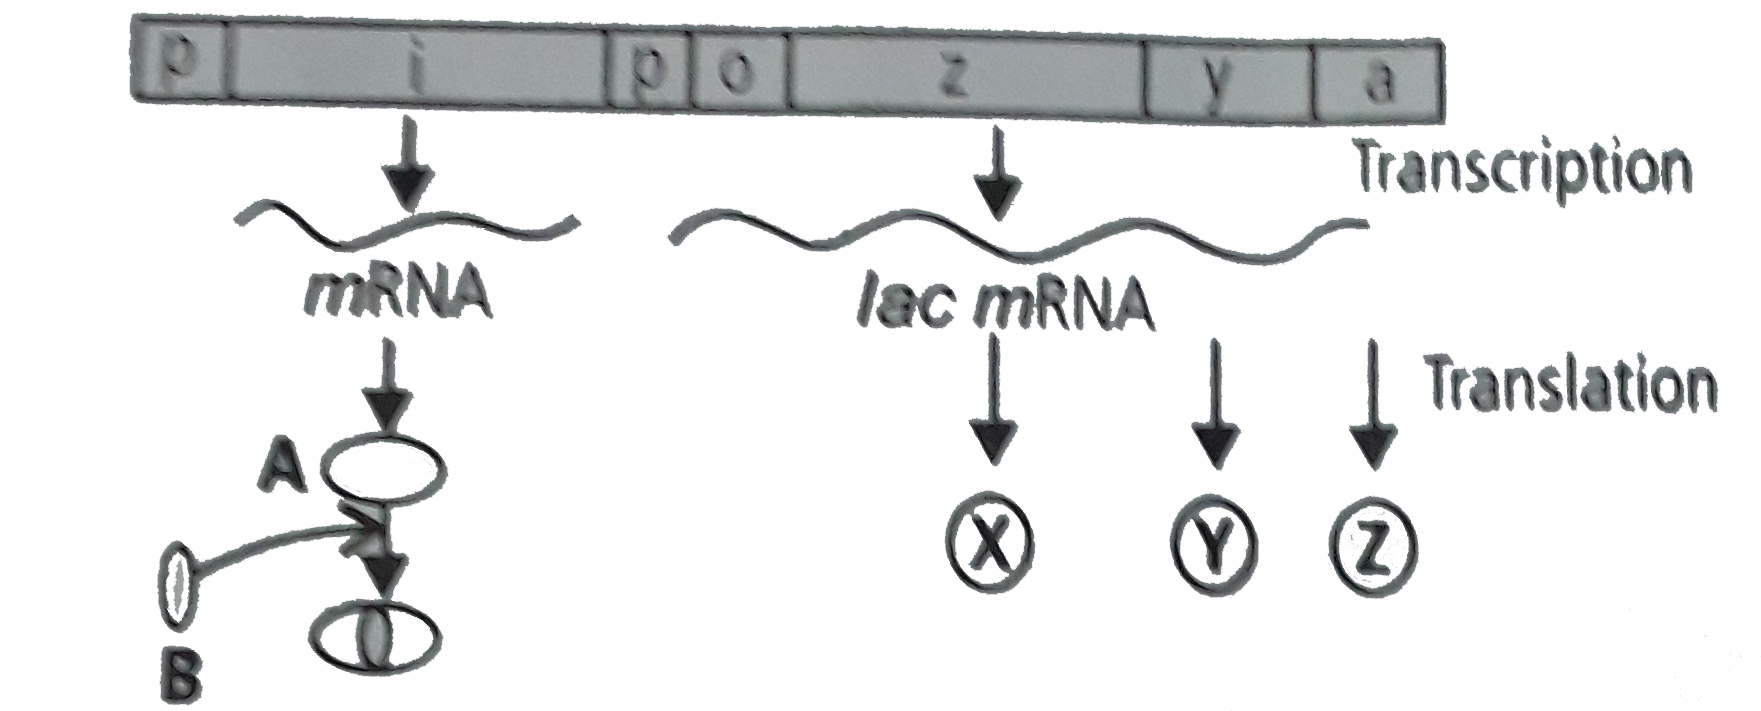 AABXYZRepressorInducerβ−galactosidasePermeaseTransacetylaseBABXYZRepressorInducerPermeaseβ−galactosidaseTransacetylaseCABXYZInducerRepressorβ−galactosidasePermeaseTransacetylaseDABXYZInducerRepressorβ−galactosidaseTransacetylasePermease
The given figure shows lac operon and its functioning. Select the option which correctly labels A, B, X, Y and Z
 AABXYZRepressorInducerβ−galactosidasePermeaseTransacetylaseBABXYZRepressorInducerPermeaseβ−galactosidaseTransacetylaseCABXYZInducerRepressorβ−galactosidasePermeaseTransacetylaseDABXYZInducerRepressorβ−galactosidaseTransacetylasePermease
The bar graph given here shows the number of jobseekers of a state in various years at different stages of education.
Study the graph carefully and answer the question based on it.
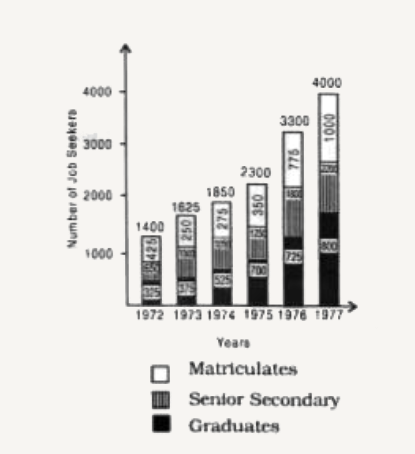
The number of job-seekers, having their qualification as Senior Secondary, in the year 1974 was :
View SolutionThe bar graph given here shows the number of jobseekers of a state in various years at different stages of education.
Study the graph carefully and answer the question based on it.
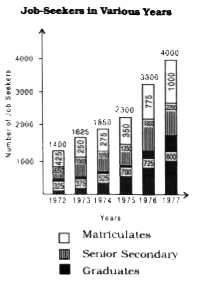
In which year, was the number of Matriculate job-seekers maximum ?
View SolutionThe given graph shows the variation of velocity with displacement. Which one of the graphs given below correctly represents the variation of acceleration with displacement ?
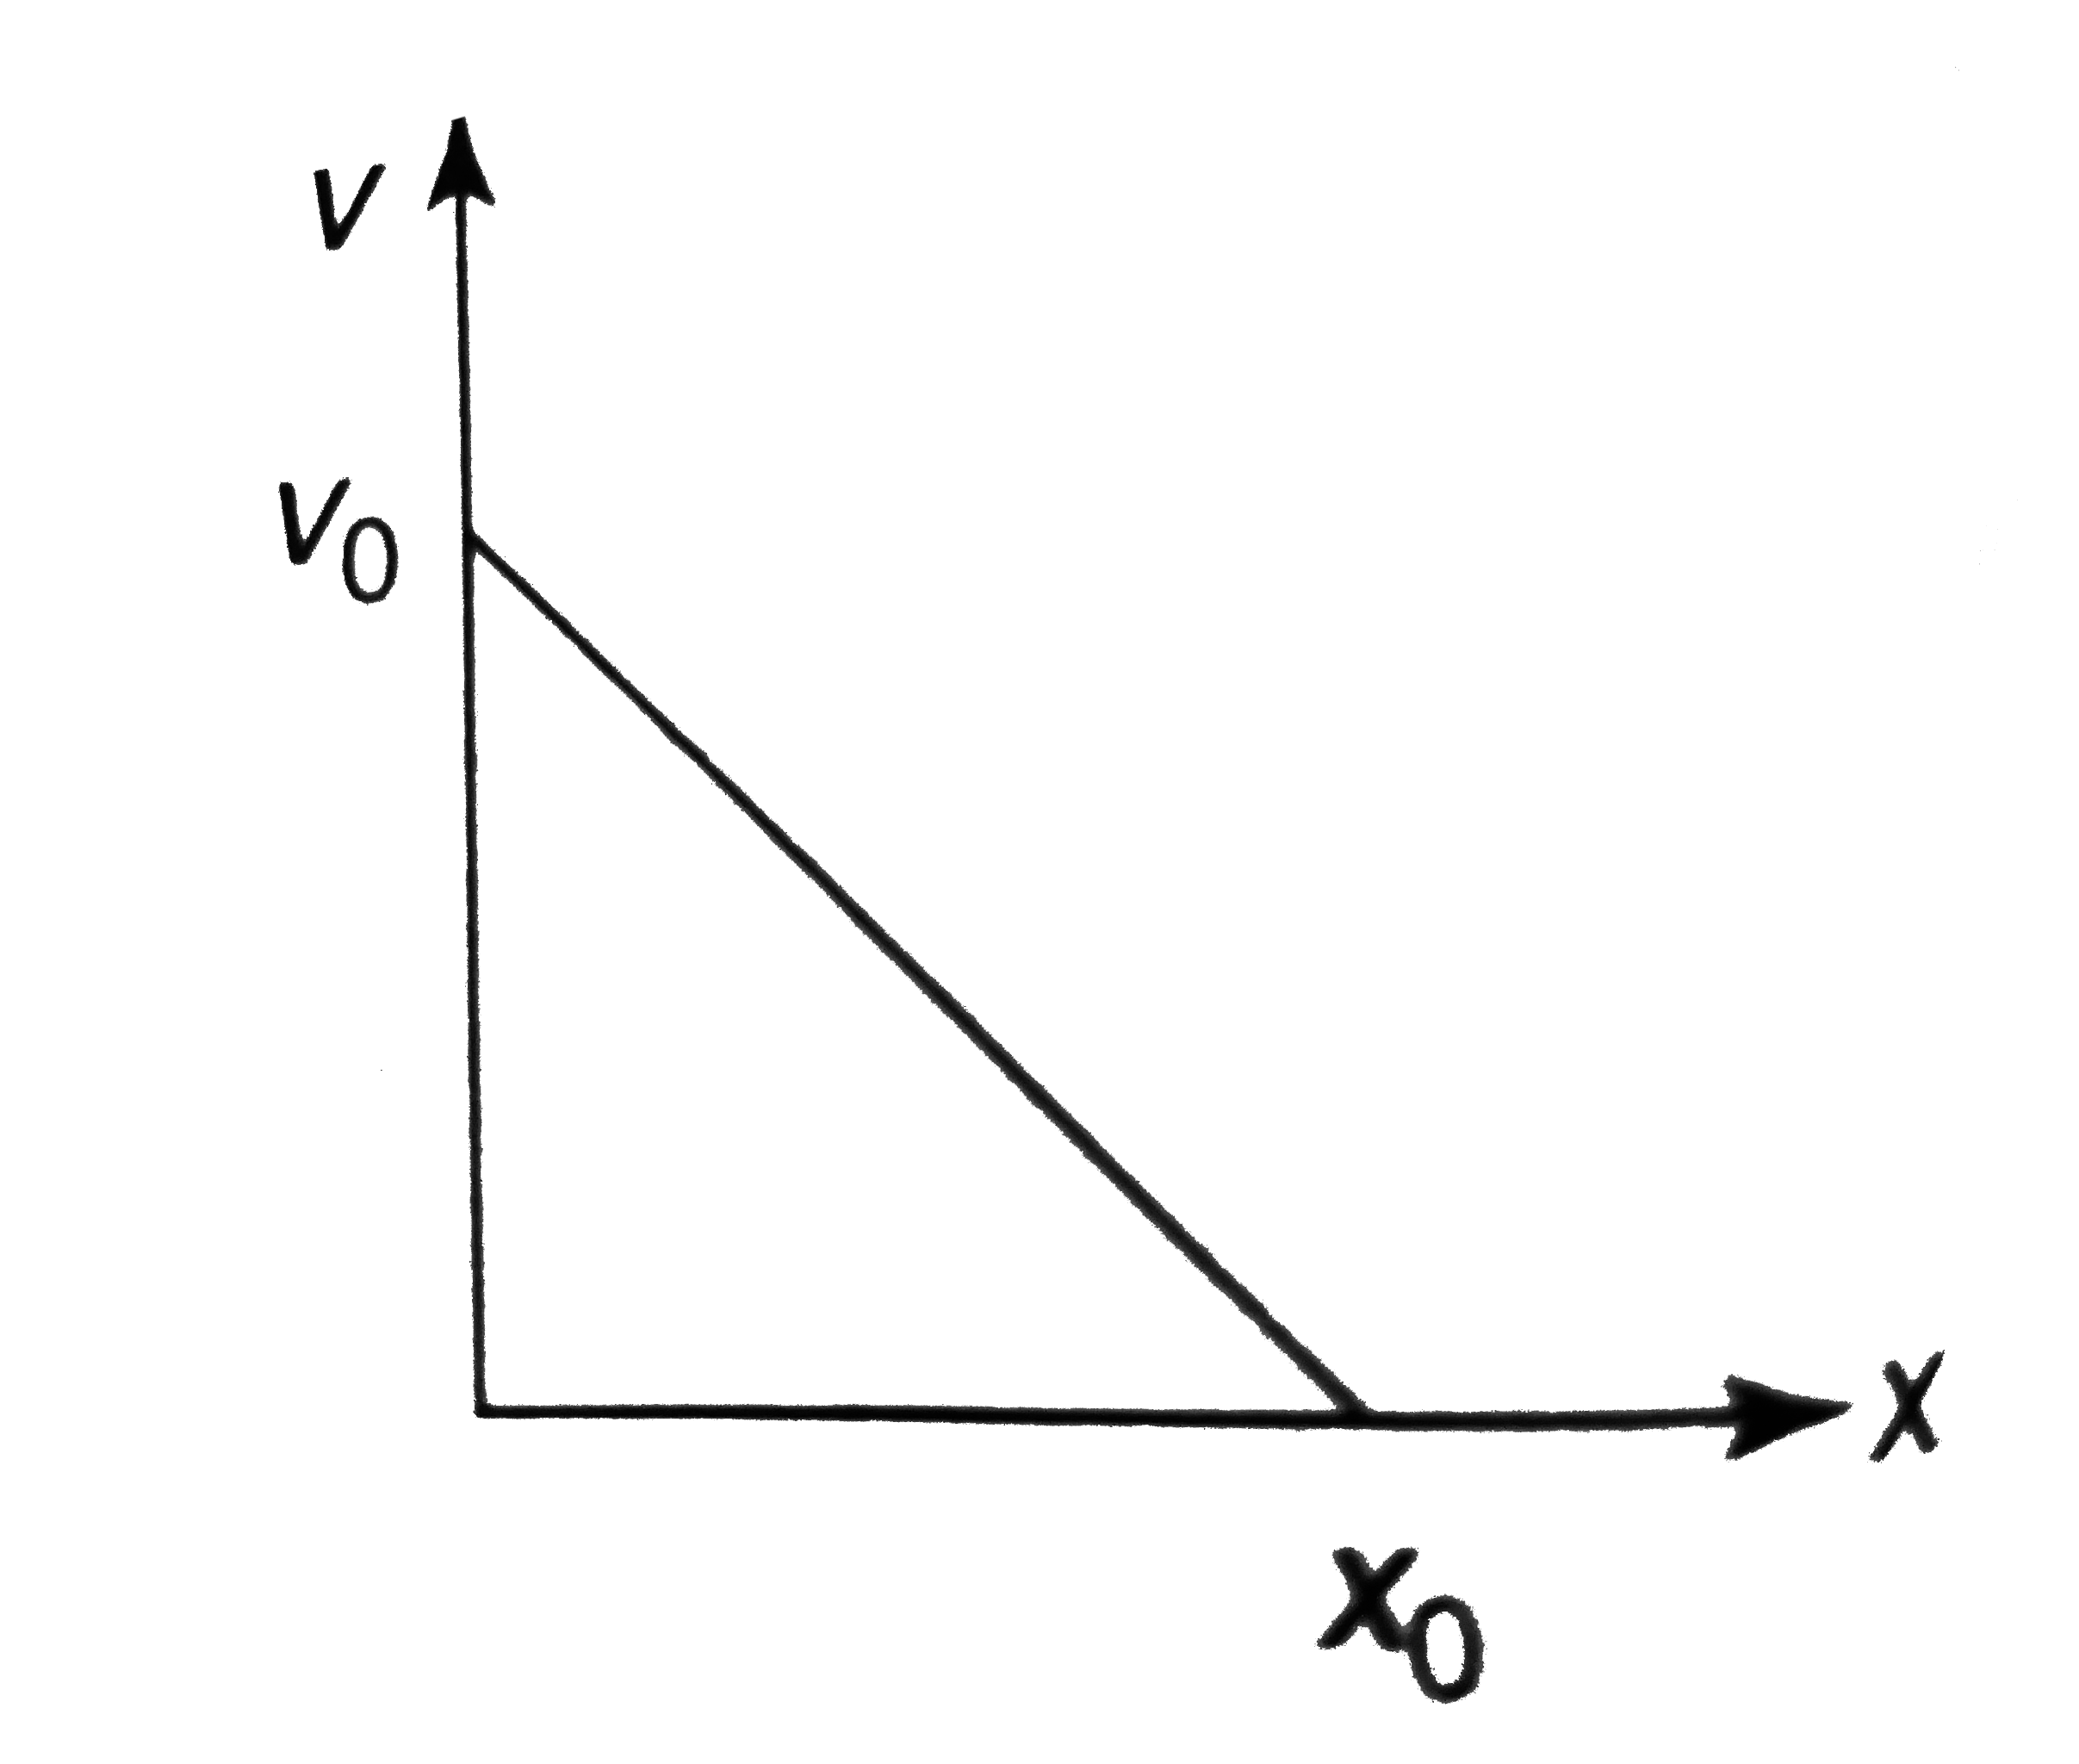
View SolutionThe given graph shows the variation of velocity with displacement. Which one of the graph given below correctly represents the variation of acceleration with displacement :-
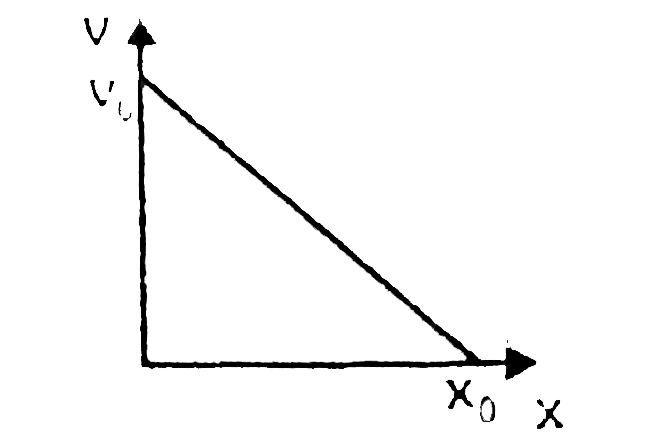
View SolutionThe given graph shows the variation of velocity with displacement. Which one of the graphs given below correctly represents the variation of acceleration with displacement ?

View Solution

