The bar graph given here shows the number of jobseekers of a state in various years at different stages of education.
Study the graph carefully and answer the question based on it.
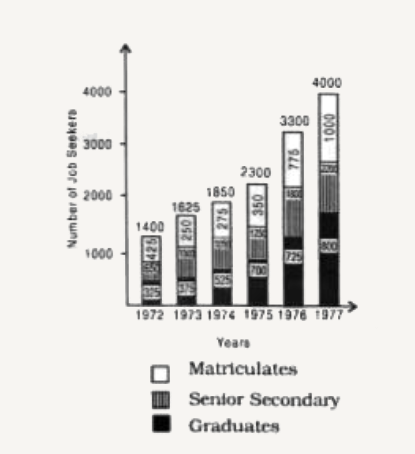
The number of job-seekers, having their qualification as Senior Secondary, in the year 1974 was :
525
800
1050
1875
The correct Answer is:B
Step by step video & image solution for The bar graph given here shows the number of jobseekers of a state in various years at different stages of education. Study the graph carefully and answer the question based on it. The number of job-seekers, having their qualification as Senior Secondary, in the year 1974 was : by Maths experts to help you in doubts & scoring excellent marks in Class 14 exams.
Updated on:21/07/2023Topper's Solved these Questions
- STATISTICS AND DATA INTERPRETATIONBOOK - KIRAN PUBLICATIONCHAPTER - STATISTICS AND DATA INTERPRETATIONEXERCISE - TYPE-IV
182 Videos
- STATISTICS AND DATA INTERPRETATIONBOOK - KIRAN PUBLICATIONCHAPTER - STATISTICS AND DATA INTERPRETATIONEXERCISE - TYPE-V
38 Videos
- STATISTICS AND DATA INTERPRETATIONBOOK - KIRAN PUBLICATIONCHAPTER - STATISTICS AND DATA INTERPRETATIONEXERCISE - TYPE-II
131 Videos
- SIMPLIFICATIONBOOK - KIRAN PUBLICATIONCHAPTER - SIMPLIFICATIONEXERCISE - TEST YOURSELF
25 Videos
- TIME AND DISTANCEBOOK - KIRAN PUBLICATIONCHAPTER - TIME AND DISTANCEEXERCISE - Type -XI
74 Videos
Similar Questions
The bar graph given here shows the number of jobseekers of a state in various years at different stages of education.
Study the graph carefully and answer the question based on it.
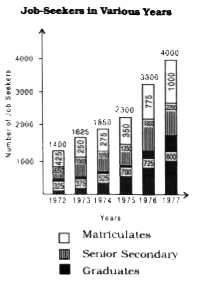
In which year, was the number of Matriculate job-seekers maximum ?
View SolutionThe bar graph given here shows the number of jobseekers of a state in various years at different stages of education.
Study the graph carefully and answer the question based on it.
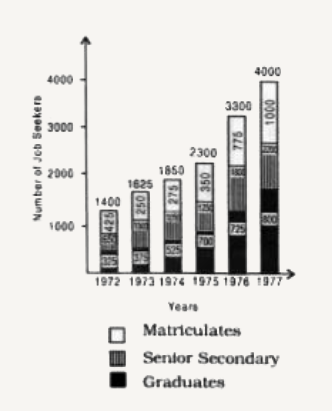
In which year was the number of Graduate job-seekers the same as that of Senior Secondary job-seekers ?
View Solution
Knowledge Check
The bar graph, given here, shows the number of tickets sold by 6 students A, B, C, D, E and F during a fair. Observe the graph and answer questions based on it.
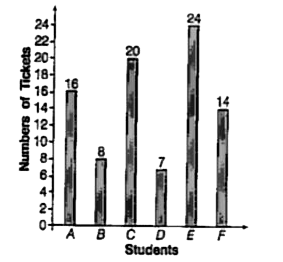
The least number of tickets were sold byABBFCADDThe circle graph given here shows the spendings of a country on various sports during a particular year, study the graph carefully and answer the questions given below it.
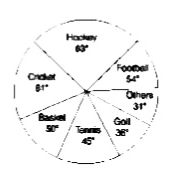
How much per cent more is spent on Hockey than that on golf?A27%B35%C37.5%D75%Study the following graph carefully and answer the questions that follow
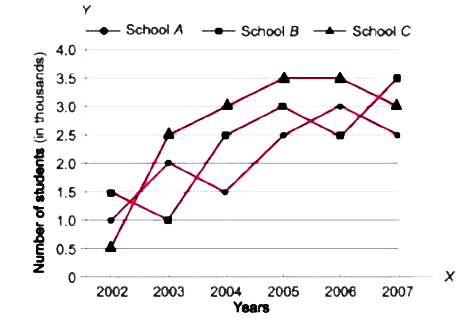
What was the average number of students in all schools together in the year 2006 ?A30000B9000C3000D6000
The bar graph given here shows the number of jobseekers of a state in various years at different stages of education.
Study the graph carefully and answer the question based on it.

In comaprison to the year 1973, how many more job-seekers in all, were there in the year 1977?
View SolutionRead the following graph carefully and answer the questions given below:
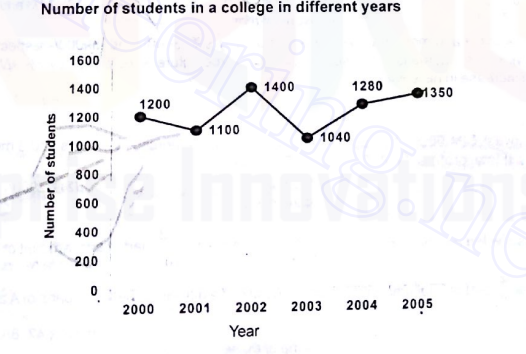
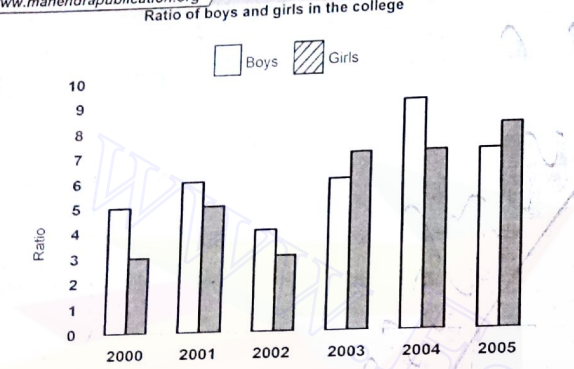
In which two years the number of girls is equal ?
View SolutionThe bar graph, given here, shows the number of tickets sold by 6 students A, B, C, D, E and F during a fair. Observe the graph and answer questions based on it.
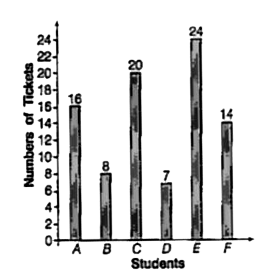
Total number of tickets sold by A, B and C is
View SolutionThe circle - graph given here shows the spendings of a country on various sports during a prticular year. Study the graph carefully and answer the questions given below It .
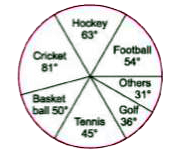
How much percent more is spent on Hockey than that on Golf?
View SolutionThe circle graph given here shows the spendings of a country on various sports during a particular year, study the graph carefully and answer the questions given below it.
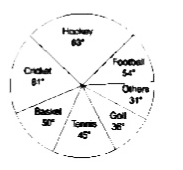
What per cent of the total spendings is spent on tennis ?
View Solution
