The bar graph given here shows the number of jobseekers of a state in various years at different stages of education.
Study the graph carefully and answer the question based on it.
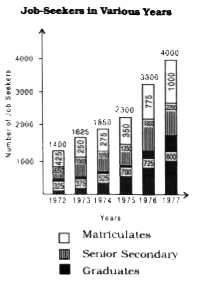
In which year, was the number of Matriculate job-seekers maximum ?
1973
1975
1972
1977
The correct Answer is:D
Step by step video & image solution for The bar graph given here shows the number of jobseekers of a state in various years at different stages of education. Study the graph carefully and answer the question based on it. In which year, was the number of Matriculate job-seekers maximum ? by Maths experts to help you in doubts & scoring excellent marks in Class 14 exams.
Topper's Solved these Questions
- BOOK - KIRAN PUBLICATIONCHAPTER - STATISTICS AND DATA INTERPRETATIONEXERCISE - TYPE-IV182videos
STATISTICS AND DATA INTERPRETATION
- BOOK - KIRAN PUBLICATIONCHAPTER - STATISTICS AND DATA INTERPRETATIONEXERCISE - TYPE-V38videos
STATISTICS AND DATA INTERPRETATION
- BOOK - KIRAN PUBLICATIONCHAPTER - STATISTICS AND DATA INTERPRETATIONEXERCISE - TYPE-II131videos
STATISTICS AND DATA INTERPRETATION
- BOOK - KIRAN PUBLICATIONCHAPTER - SIMPLIFICATIONEXERCISE - TEST YOURSELF25videos
SIMPLIFICATION
- BOOK - KIRAN PUBLICATIONCHAPTER - TIME AND DISTANCEEXERCISE - Type -XI74videos
TIME AND DISTANCE
Similar Questions
The bar graph given here shows the number of jobseekers of a state in various years at different stages of education.
Study the graph carefully and answer the question based on it.
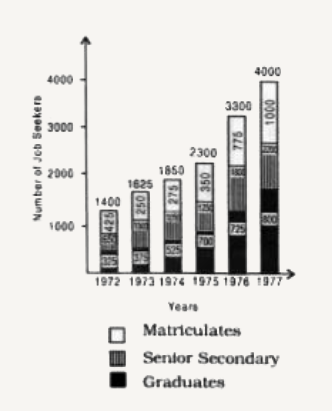
In which year was the number of Graduate job-seekers the same as that of Senior Secondary job-seekers ?View SolutionThe bar graph given here shows the number of jobseekers of a state in various years at different stages of education.
Study the graph carefully and answer the question based on it.

In comaprison to the year 1973, how many more job-seekers in all, were there in the year 1977?View Solution
Knowledge Check
- Question 1 - Select One
Study the graph and answer the questions.
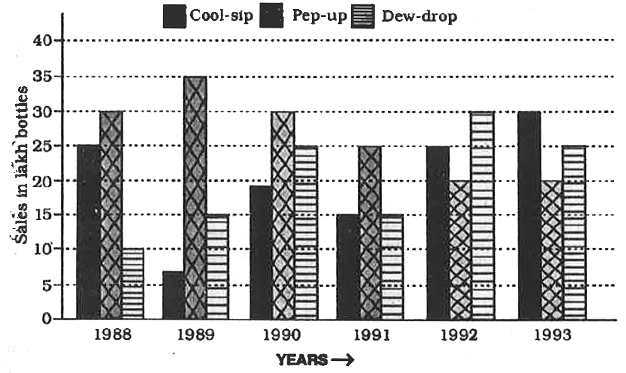
In which year sale of Drew-drop is maximum ?A1998B1992C1989D1993 - Question 2 - Select One
Study the following graph carefully and answer the questions given below
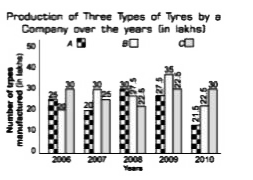
In which of the following years, was the percentage production of B type to C type the maximum?A2008B2009C2010D2007 - Question 3 - Select One
The circle graph given here shows the spendings of a country on various sports during a particular year, study the graph carefully and answer the questions given below it.
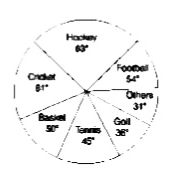
How much per cent more is spent on Hockey than that on golf?A27%B35%C37.5%D75%
The bar graph given here shows the number of jobseekers of a state in various years at different stages of education.
Study the graph carefully and answer the question based on it.
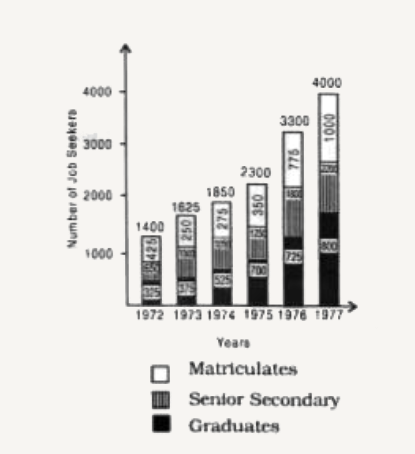
The number of job-seekers, having their qualification as Senior Secondary, in the year 1974 was :View SolutionRead the following graph carefully and answer the questions given below:
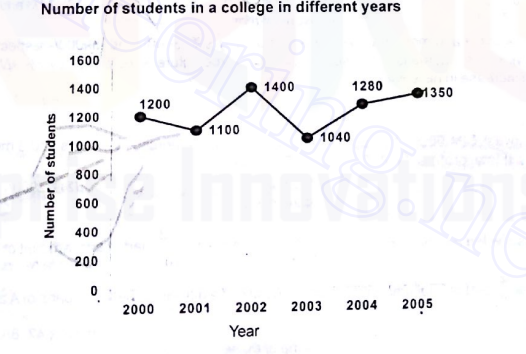
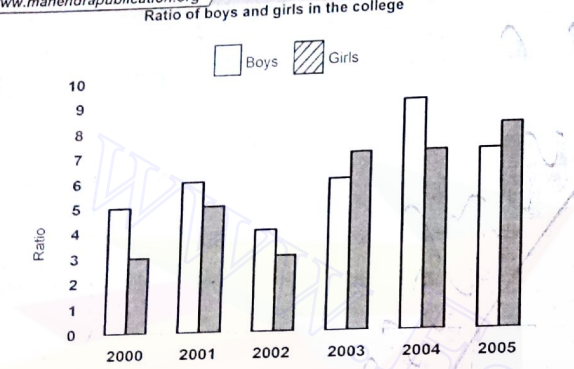
In which two years the number of girls is equal ?View SolutionStudy the graph and answer the questions.
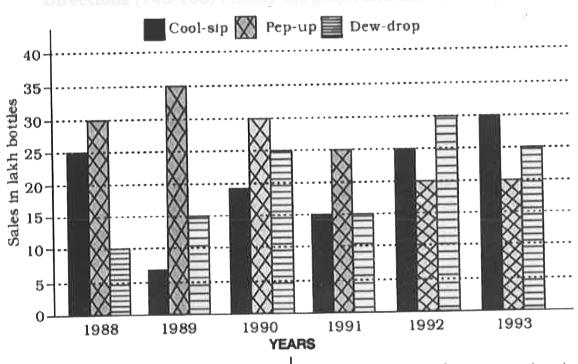
In which year sale of Dew -drop is maximum ?View SolutionRead the bar graph given below and answer the following questions:
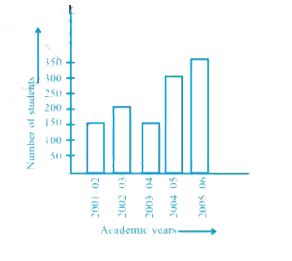
In which year is the number of students maximum?View SolutionFollowing graph shows the income of a company in six different years. Study the graph , carefully and answer the questions that follow.
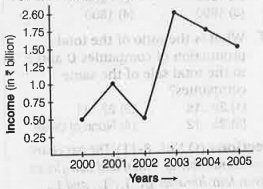
In which year income of the company is the highest?View Solution

