Temperature#!#Pressure#!#Volume#!#Variations
Step by step video solution for Temperature#!#Pressure#!#Volume#!#Variations by Chemistry experts to help you in doubts & scoring excellent marks in Class 11 exams.
Updated on:21/07/2023Similar Questions
The variation of pressure with volume of the gas at different temperatures can be graphically represented as shown in figure. On the basis of this graph answer the following questions. How will the volume of a gas change if its pressure is increased at constant temperature?
View SolutionAt a given volume and temperature, the pressure of a gas ……….. .
View SolutionThe variation of pressure with volume of the gas at different temperatures can be graphically represented as shown in figure. On the basis of this graph answer the following question. (i) How will the volume of a gas change if its pressure is increased at constant temperature ? (ii) At a constant pressure, how will the volume of a gas change if the temperature is increased from 200 K to 400 K ?
View SolutionIf we consider the pressure and volume of a gas at a specific temperature we find that the increase in pressure leads to decrease in volume and if the pressure is reduced, the volume will increase. Thus, the pressure and volume of a gas at a given temperature are not in direct variation.
View SolutionThomas Andrew measured variation of the volume with pressure of "____________" at different constant temperatures.
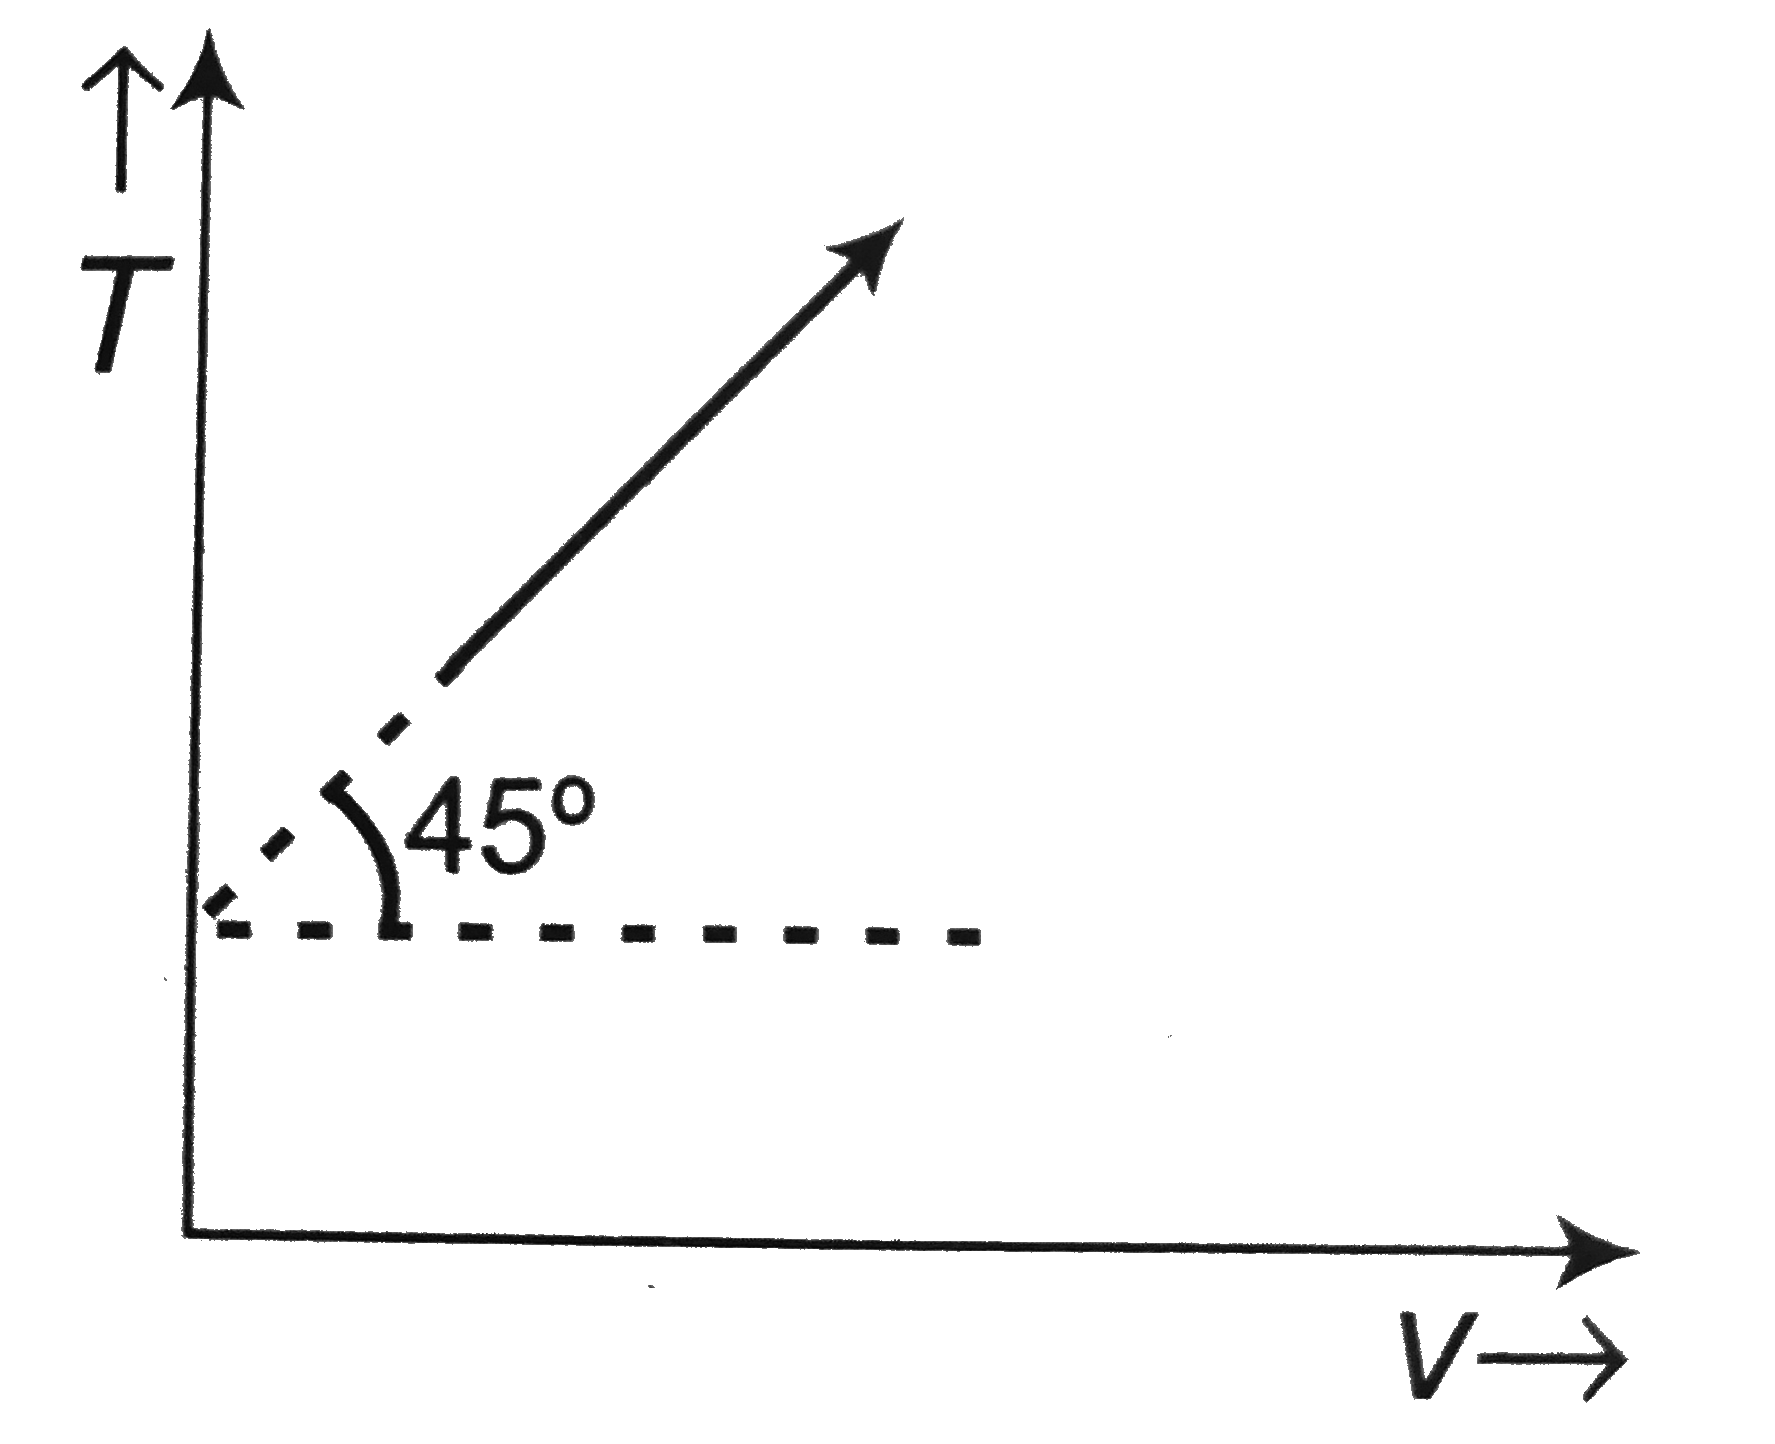
View SolutionThe given curve represents the variation of temperature as a function of volume for one mole of an ideal gas. Which of the following curves best represents the variation of pressure as a function of volume?

View SolutionVariation OF compressibility factor with temperature || Liquefaction OF gases & andrew's isotherms,critical temperature,pressure & volume
View SolutionDraw a graph showing the variation of volume (v) with temperature ( t^@C ) at constant pressure for a fixed mass of a gas and indicate the absolute zero temperature on the graph.
View Solution
