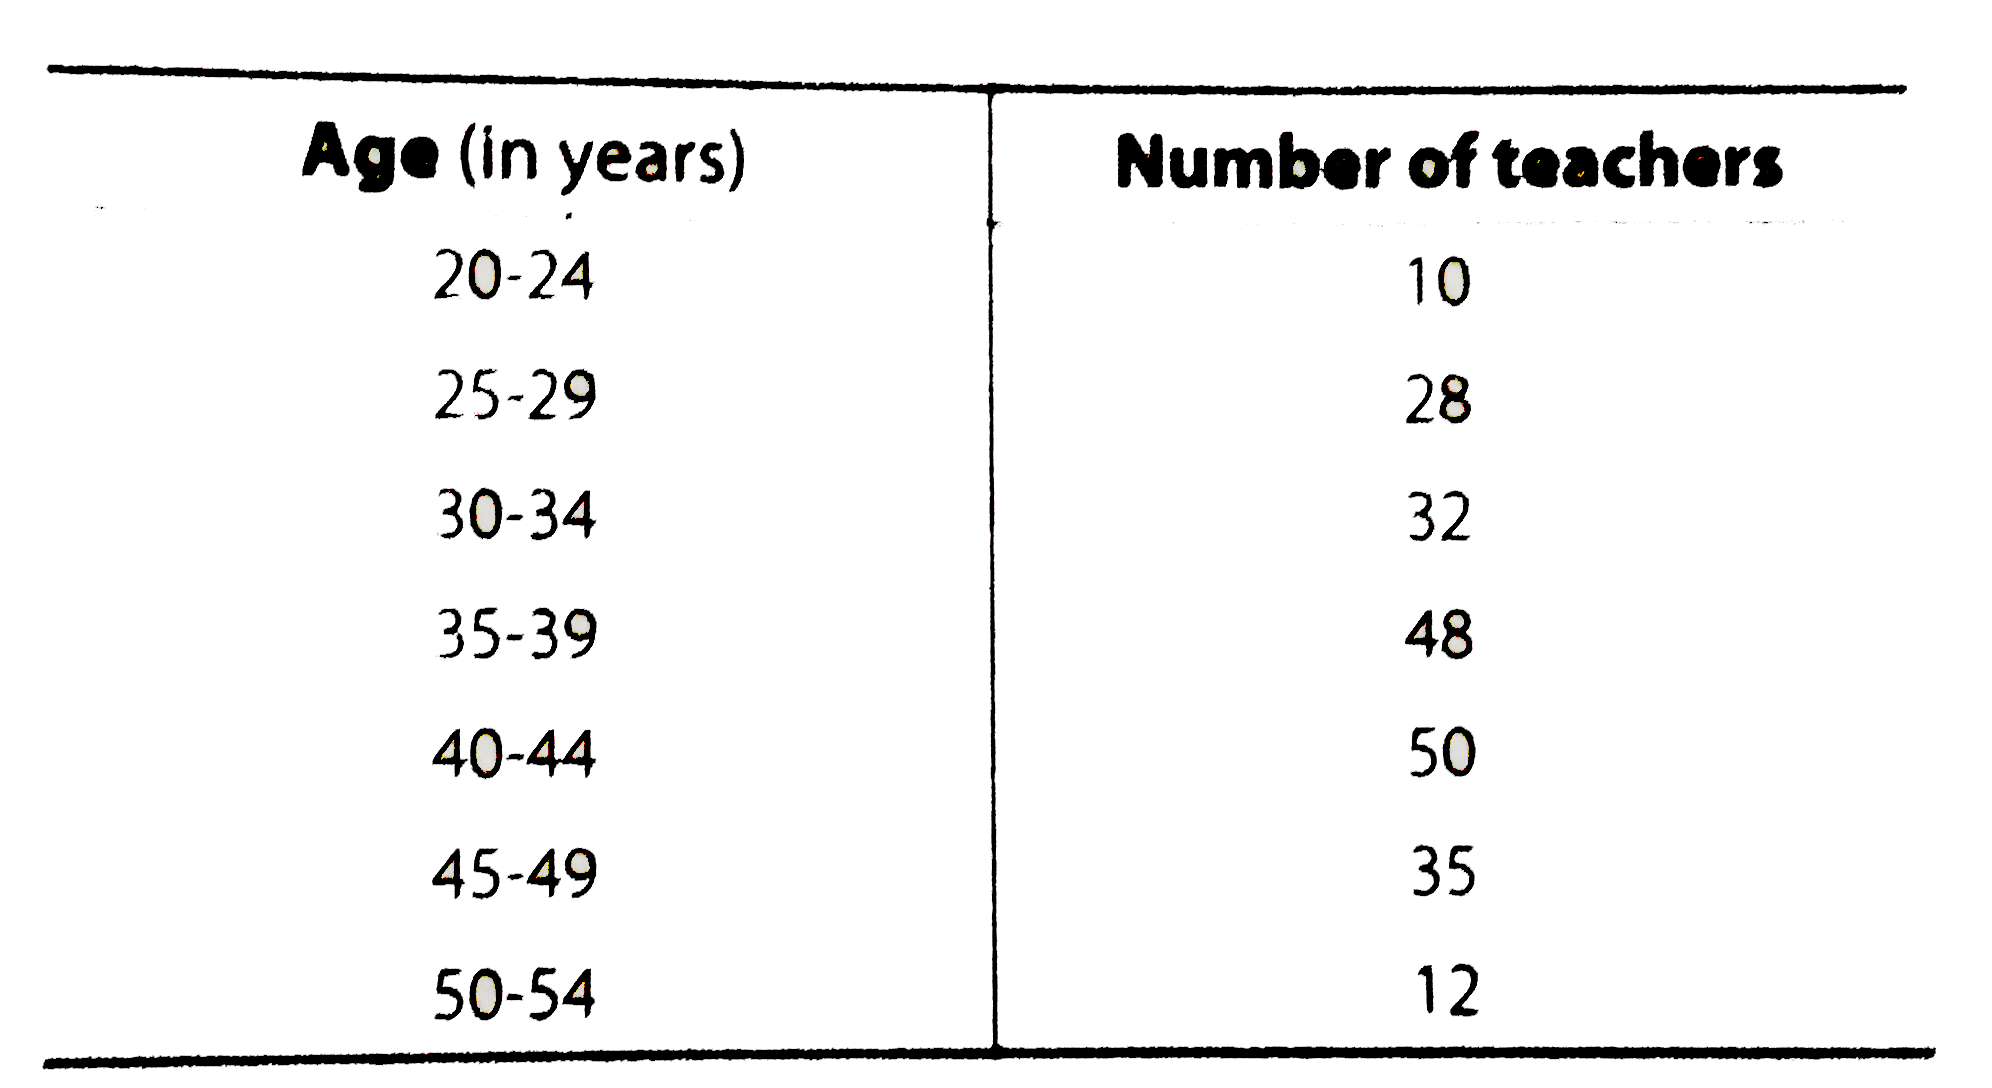
Question stimulus:-
A histogram has 7 bars of varying heights. The fifth bar represents the maximum frequencies. The range of this frequency distribution table can be classified as
A
Average
B
Below average
C
Above average
D
Extreme
Text Solution
The correct Answer is:D
|
Similar Questions
Knowledge Check
In statistics, the bar graph of a frequency distribution is called
AhistogramBfrequency polygonCcumulative frequencyDgraphIn statistics, the bar graph of a frequency distribution is called
AhistogramBfrequency polygonCcumulative frequencyDgraphTo draw a histogram to represent the following frequency distribution.
Class Interval 5−1010−1515−2525−4545−75
Frequency 6 12 10 8 15
The adjusted frequency for the class 25−45 isA6B5C3D2
Represent the following frequency distribution by means of a histogram.

View SolutionDraw a histogram and frequency polygen to represent the following frequency distribution :
View SolutionDraw a histogram to represent the following grouped frequency distribution.

View SolutionTo draw a histogram to represent the following frequency distribution.
The adjusted frequency for the class 25-45 is
View SolutionThe histogram below represents the scores obtained by 25 students in a Mathematics mental test. Use the data to,
(i) Frame a frequency distribution table
(ii) To calculate mean
View Solution


