Study the following Pie chart showing the number of cold drinks of a shopkeeper sold in a year:
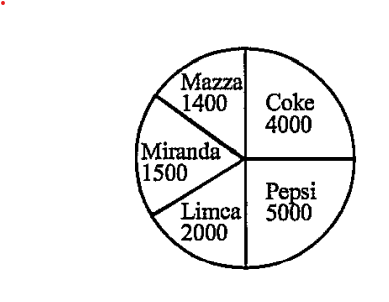
Which cold drink sale is twice as that of Limca?
Coke
Mazza
Miranda
Pepsi
Step by step video, text & image solution for Study the following Pie chart showing the number of cold drinks of a shopkeeper sold in a year: Which cold drink sale is twice as that of Limca? by Maths experts to help you in doubts & scoring excellent marks in Class 14 exams.
Updated on:21/07/2023Similar Questions
The following bar graph represents the number of cold drink bottles sold by a shopkeeper on six consecutive days.
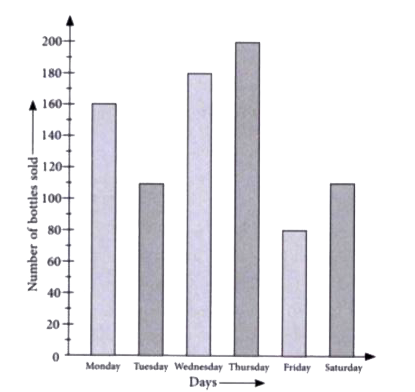
On which two days same number of bottles were sold?
View SolutionThe following bar graph represents the number of cold drink bottles sold by a shopkeeper on six consecutive days.
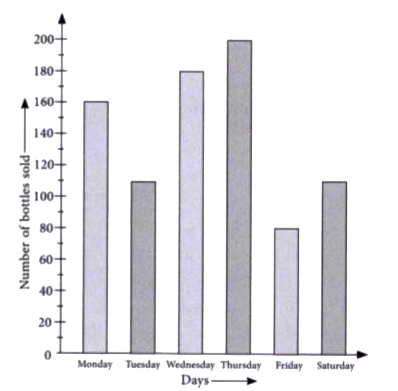
Find the total number of cold drink bottles sold in six days.
View Solution
Knowledge Check
Study the following Pie chart showing the number of cold drinks a shopkeeper sold in a year:
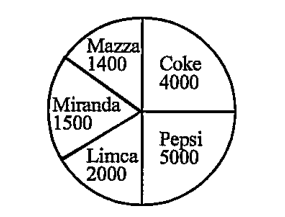
Choices not given-check original source. Which is the highest selling cold drink?A7000B5000C2000D10000The following pie-chart shows the study-time of different subjects of a student in a day. Study the pie-chart and answer the following questions
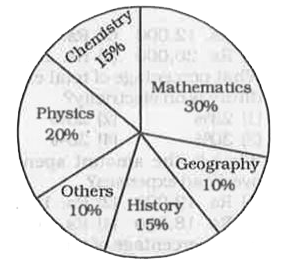
If the student studied 10 hours in a day, then he / she studied mathematics forA3 hoursB103 hoursC13 hoursD310 hoursThe following pie-chart shows the study-time of different subjects of a student in a day. Study the pie-chart and answer the following questions
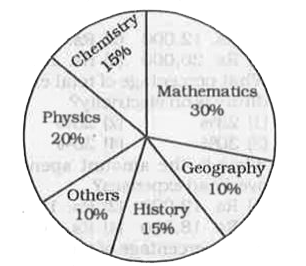
If the student studied chemistry for 3 hours, then he / she studied geography forA1 hourB2 hoursC1 hour and 30 minutesD2 hours and 30 minutes
The following bar graph represents the number of cold drink bottles sold by a shopkeeper on six consecutive days.
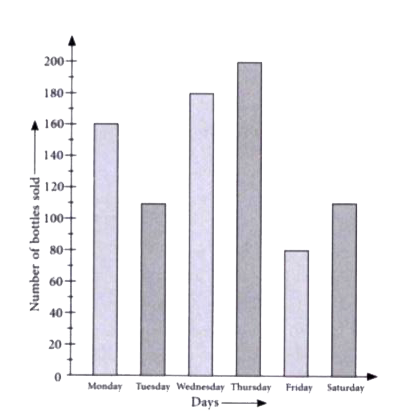
On which day minimum number of bottles were sold?
View SolutionStudy the pie chart and answer the question
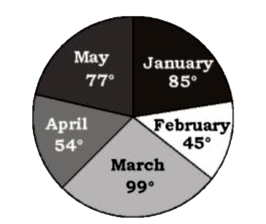
The total number of computers sold in February and April is what percentage more than the number of computers sold in May
View SolutionIn the given figure , which number represents cold drink which is black and sweet ?
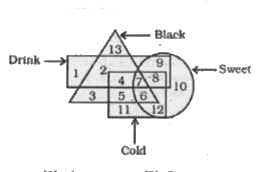
View SolutionDirections: Study the Pie chart and answer the following question. The pie chart is showing the percentage of different types of shirts sold by five different stores namely A, B, C, D and E.
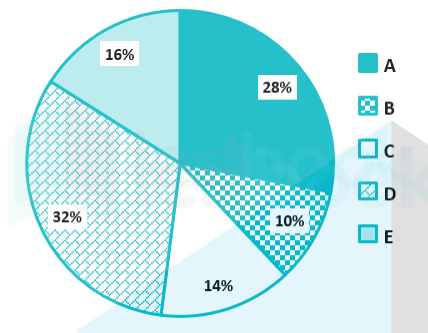
If the difference in shirt sold by store C and store D is 1800. Find the number of shirts sold by store D.
View SolutionStudy the following Pie-Chart carefully to answer the questions given below.
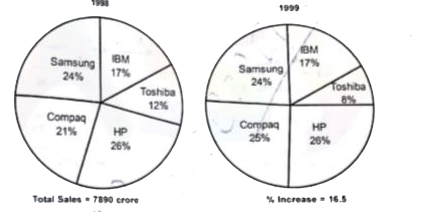
What is the ratio between the Compaq sales in 1998 and that of IBM in 1999 ?
View Solution
