The intercepts and slope of graph of log K∘pVs1T are :
ΔG0,ΔH∘
ΔG∘2.303R,ΔH∘2.303R
ΔS∘2.303R,−ΔH∘2.303R
ΔH∘2.3003R,ΔS∘
The correct Answer is:C
To find the intercepts and slope of the graph of log Kp versus 1T, we can follow these steps:
Step 1: Understand the relationship between Gibbs Free Energy and Equilibrium Constant
The Gibbs free energy change (ΔG0) for a reaction is related to the equilibrium constant (K) by the equation:
ΔG0=−RTlnK
where R is the universal gas constant and T is the temperature in Kelvin.
Step 2: Relate Gibbs Free Energy to Enthalpy and Entropy
We also have the relation:
ΔG0=ΔH0−TΔS0
where ΔH0 is the change in enthalpy and ΔS0 is the change in entropy.
Step 3: Combine the equations
Setting the two expressions for ΔG0 equal to each other gives:
−RTlnK=ΔH0−TΔS0
Step 4: Rearranging the equation
Rearranging this equation, we can express lnK:
lnK=−ΔH0RT+ΔS0R
Step 5: Convert natural logarithm to base 10 logarithm
To convert from natural logarithm to base 10 logarithm, we use the conversion:
lnK=logK⋅2.303
Thus, we can write:
logK=−ΔH02.303R⋅1T+ΔS02.303R
Step 6: Identify the slope and intercept
This equation is in the form of y=mx+c, where:
- y=logK
- x=1T
- The slope m=−ΔH02.303R
- The y-intercept c=ΔS02.303R
Conclusion
Thus, the slope of the graph of logKp versus 1T is −ΔH02.303R and the y-intercept is ΔS02.303R.
The Gibbs free energy change (ΔG0) for a reaction is related to the equilibrium constant (K) by the equation:
ΔG0=−RTlnK
where R is the universal gas constant and T is the temperature in Kelvin.
We also have the relation:
ΔG0=ΔH0−TΔS0
where ΔH0 is the change in enthalpy and ΔS0 is the change in entropy.
Setting the two expressions for ΔG0 equal to each other gives:
−RTlnK=ΔH0−TΔS0
Rearranging this equation, we can express lnK:
lnK=−ΔH0RT+ΔS0R
To convert from natural logarithm to base 10 logarithm, we use the conversion:
lnK=logK⋅2.303
Thus, we can write:
logK=−ΔH02.303R⋅1T+ΔS02.303R
This equation is in the form of y=mx+c, where:
- y=logK
- x=1T
- The slope m=−ΔH02.303R
- The y-intercept c=ΔS02.303R
Thus, the slope of the graph of logKp versus 1T is −ΔH02.303R and the y-intercept is ΔS02.303R.
Similar Questions
Knowledge Check
- Question 1 - Select One
According to Arrhenius equation rate constant k is equal to Ae−Ea/RT. Which of the following option. Represents the graph of ln k us 1T?
A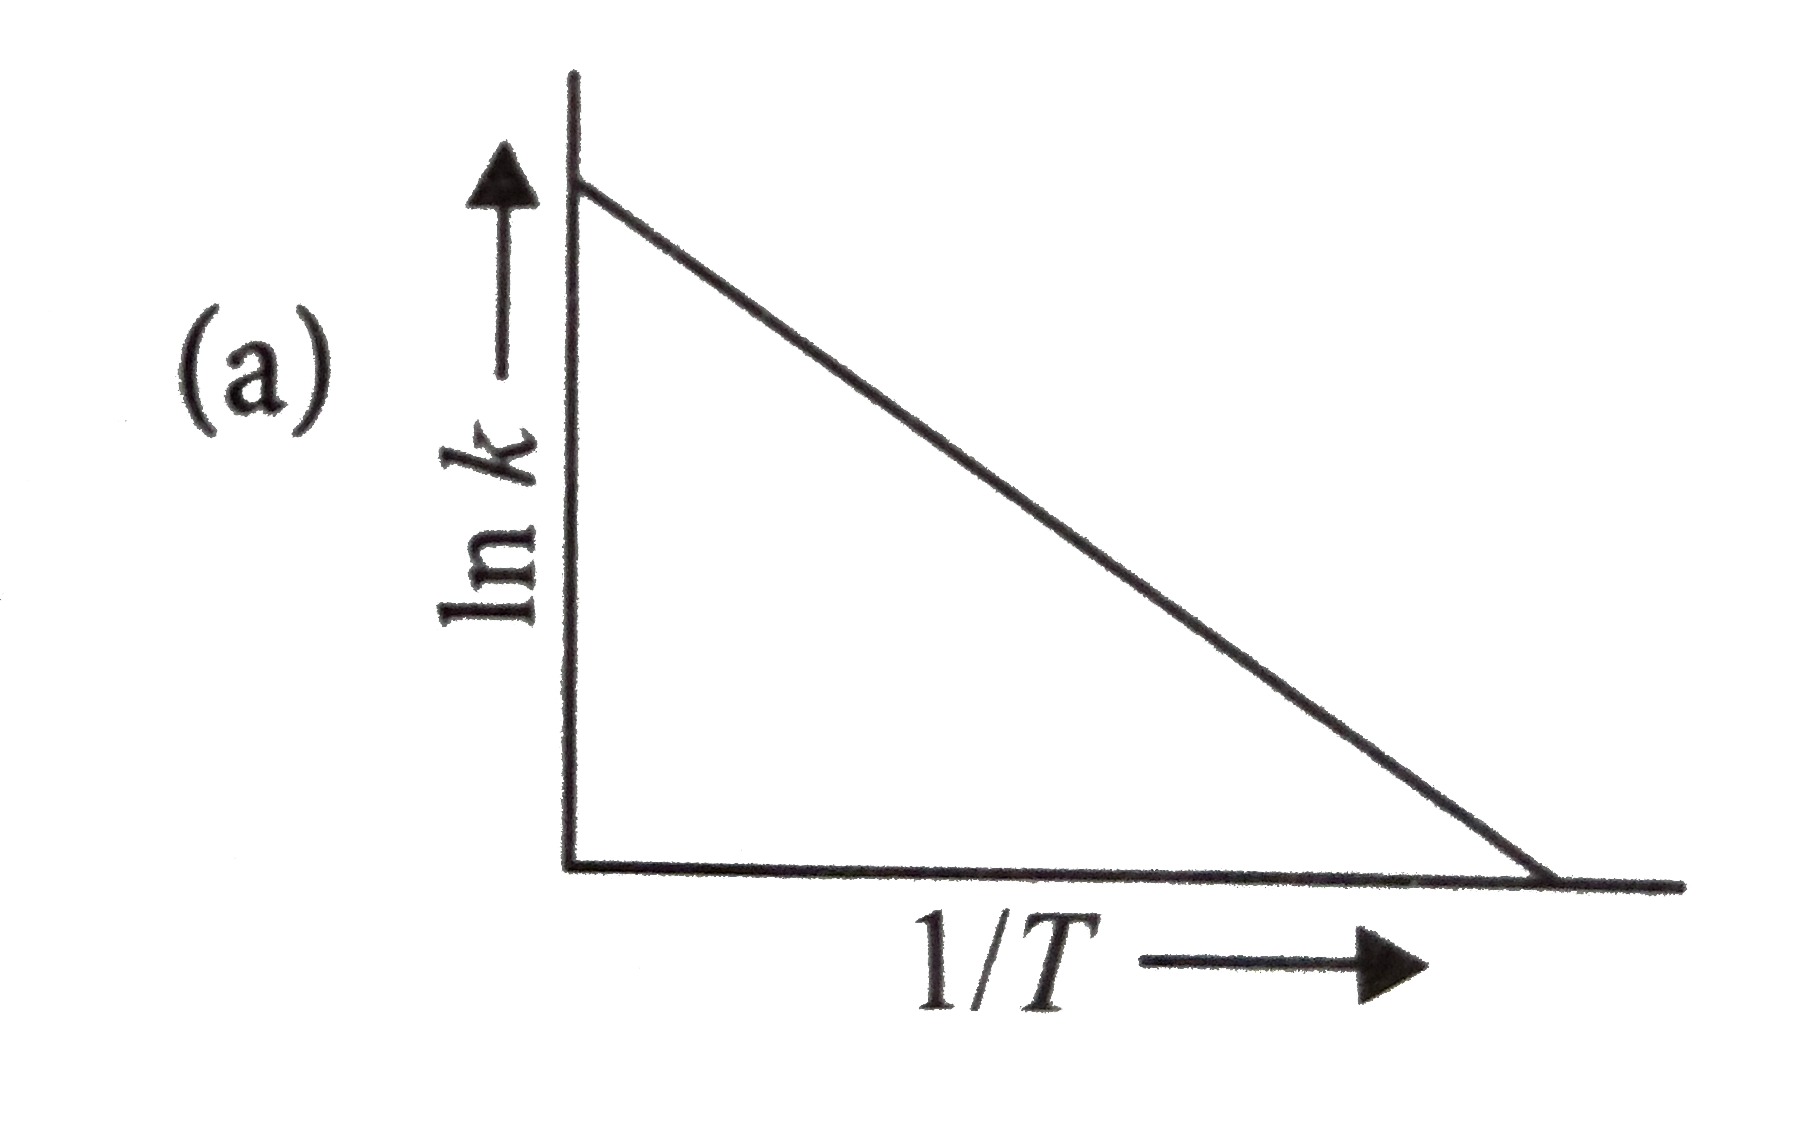 B
B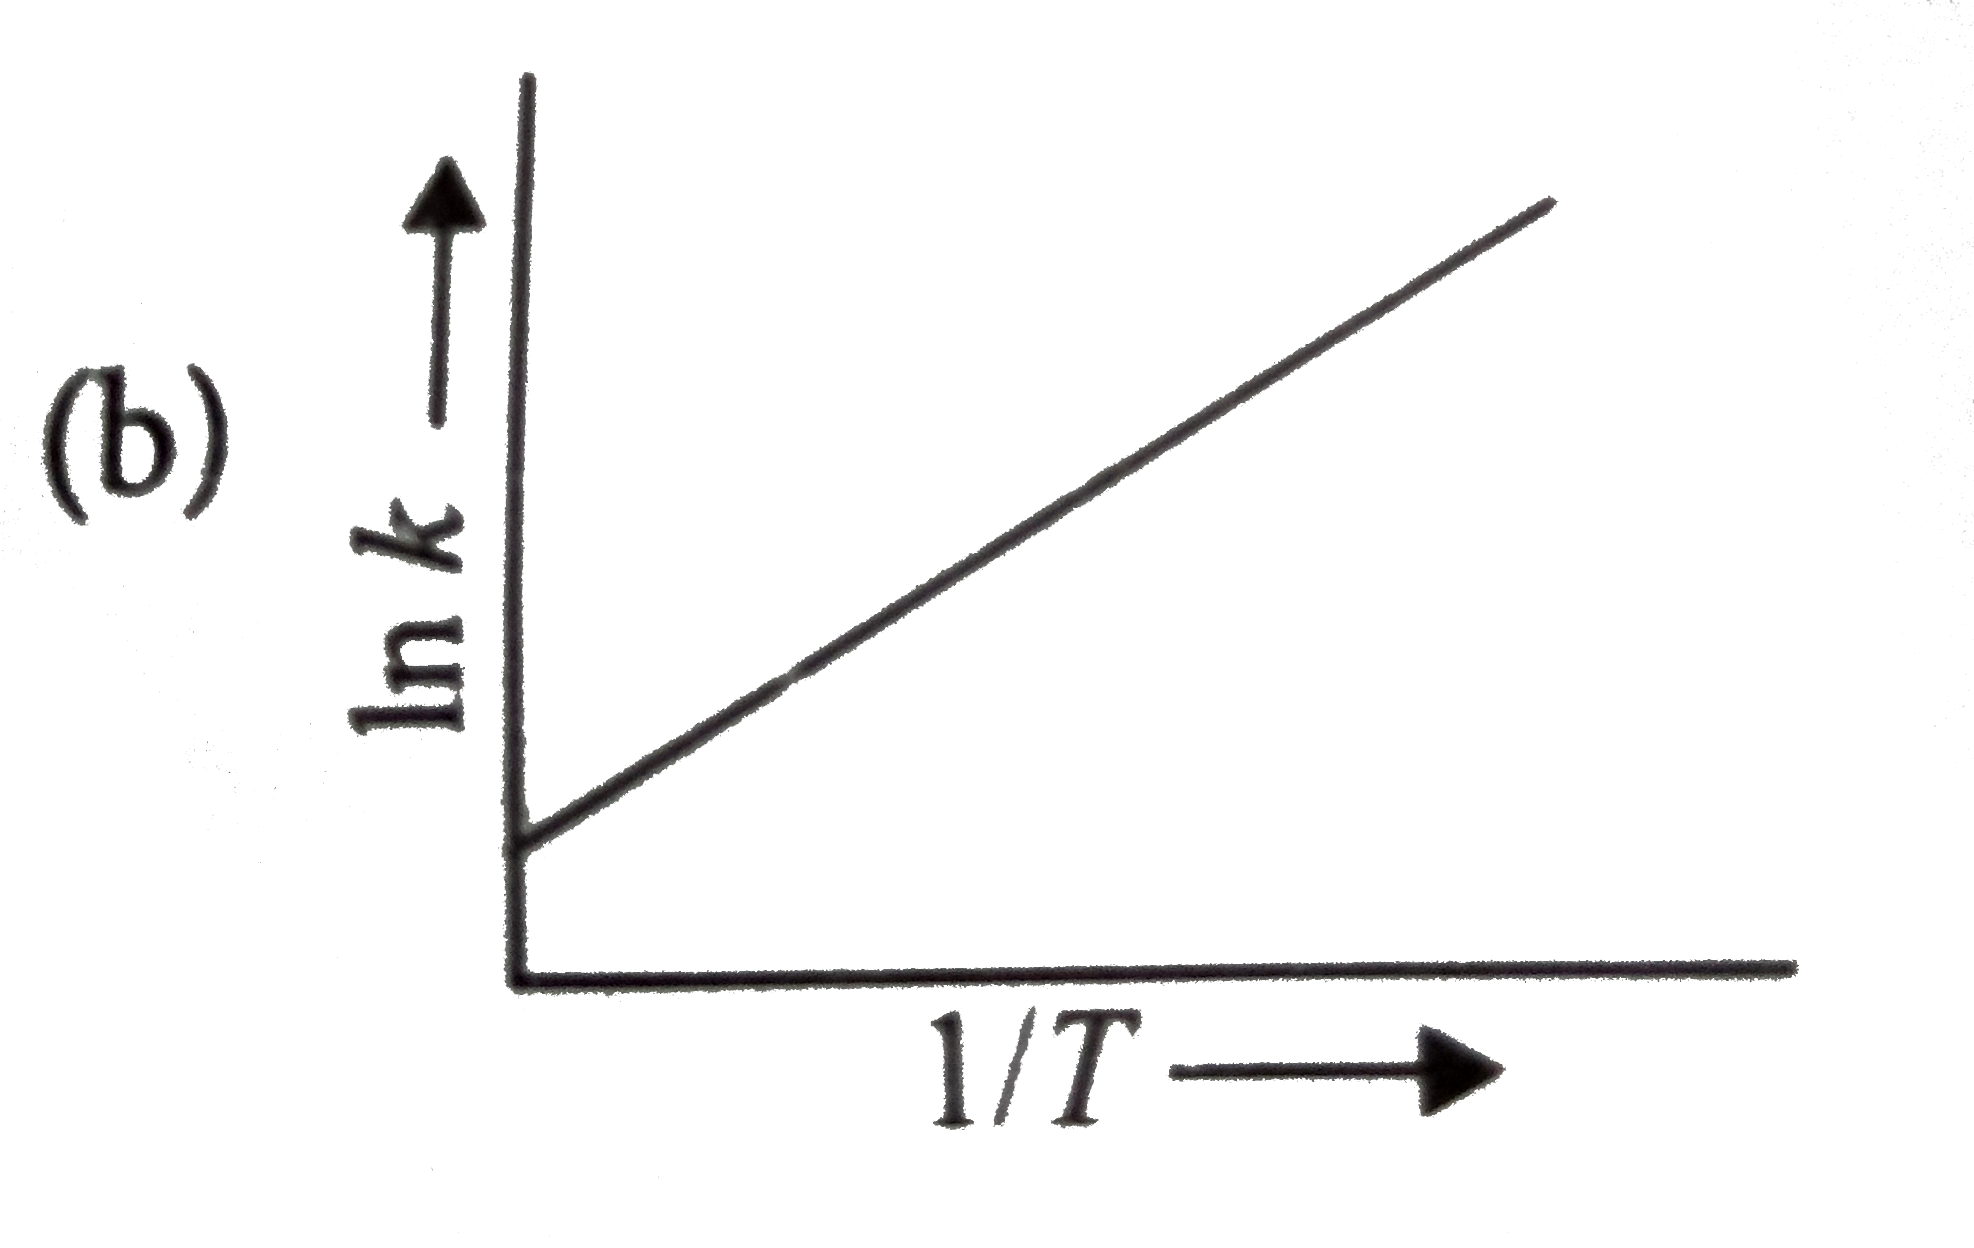 C
C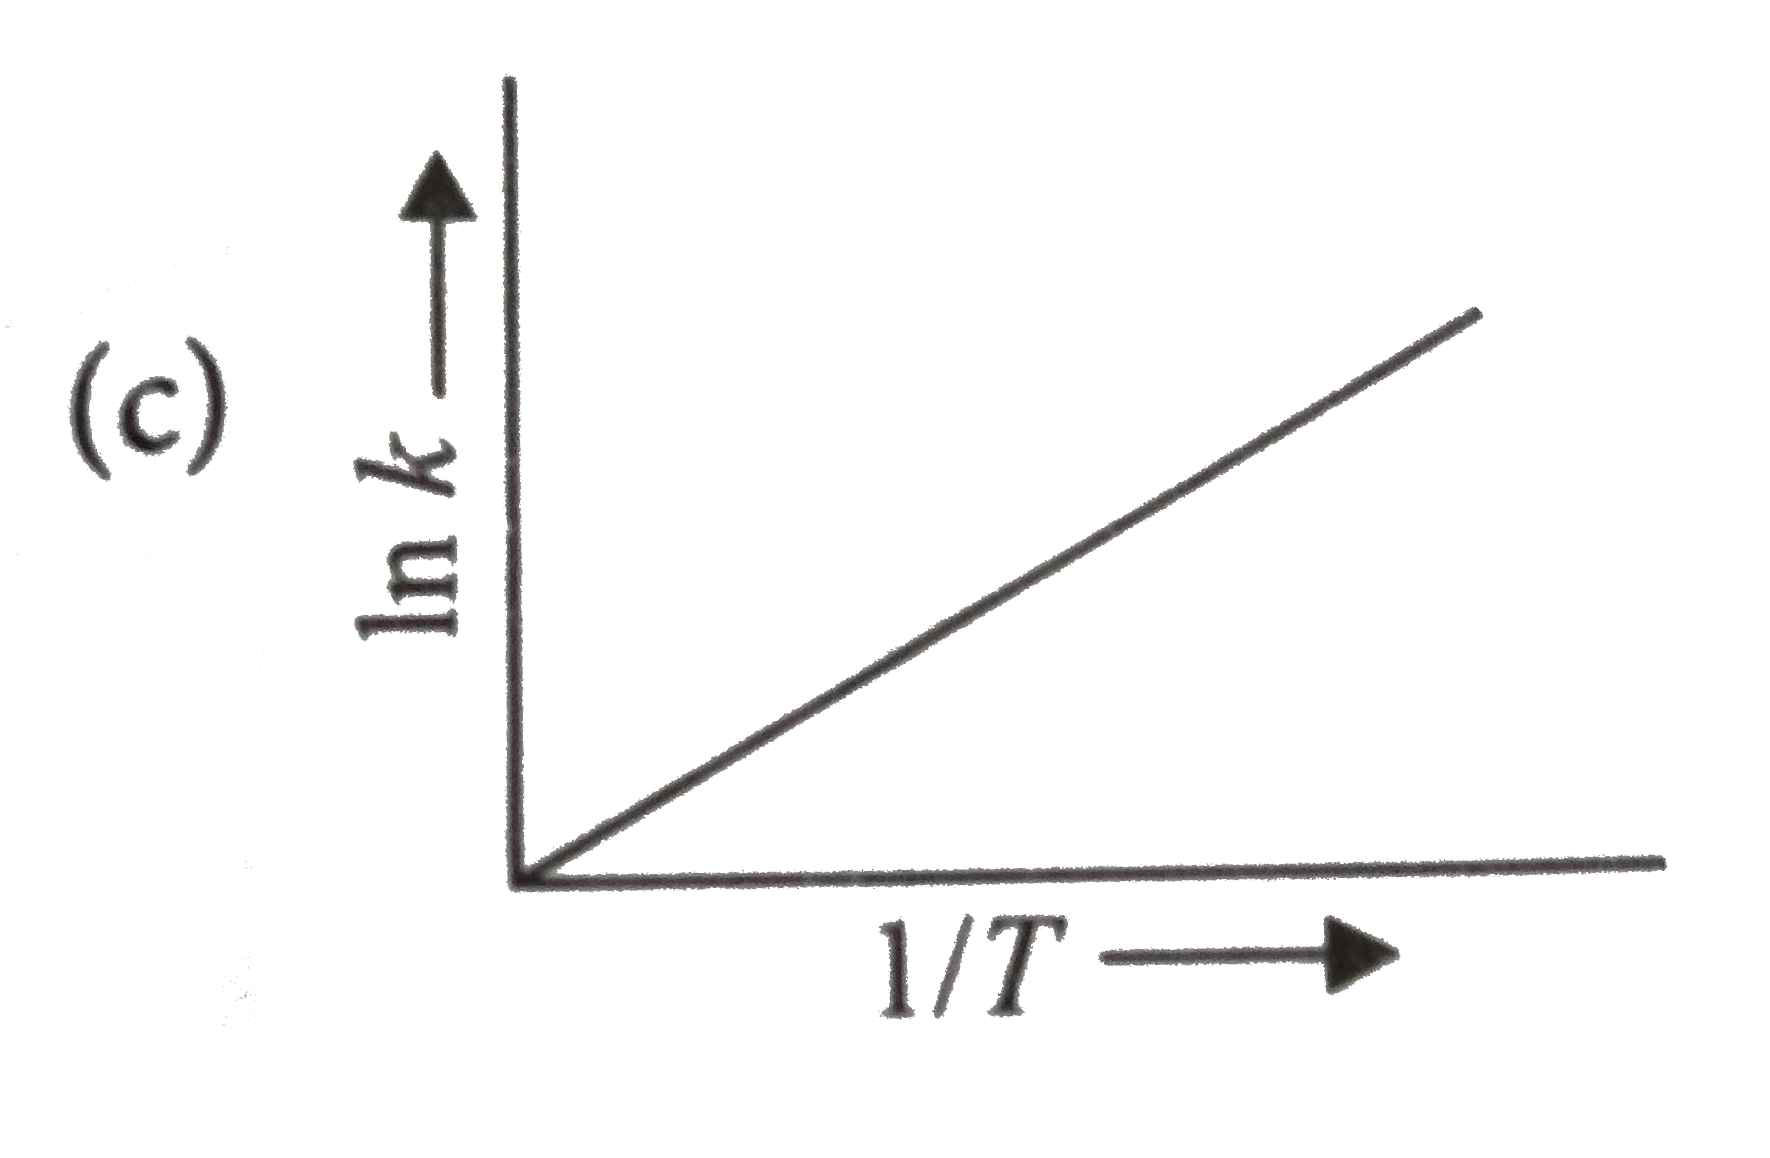 D
D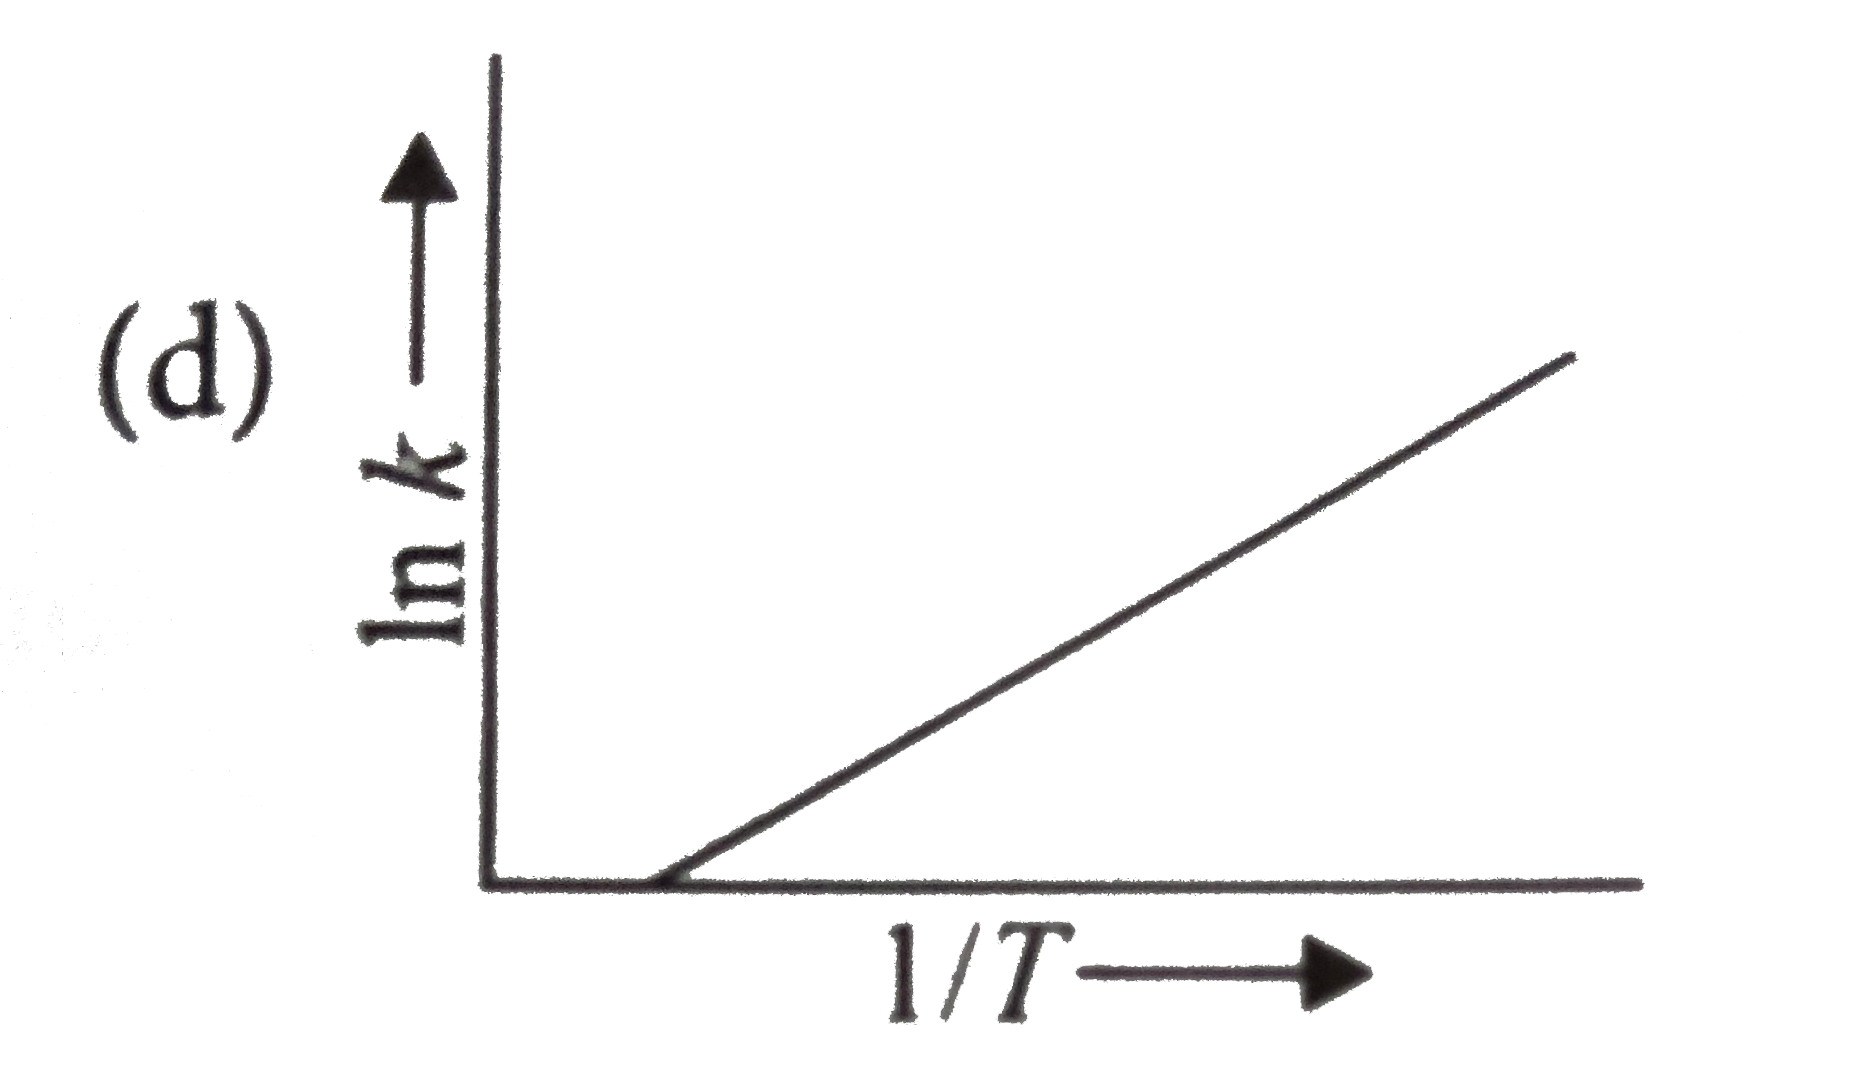
- Question 2 - Select One
According to Arrhenius equation rate constant k is equal to Ae−Ea/RT. Which of the following option. Represents the graph of ln k us 1T?
A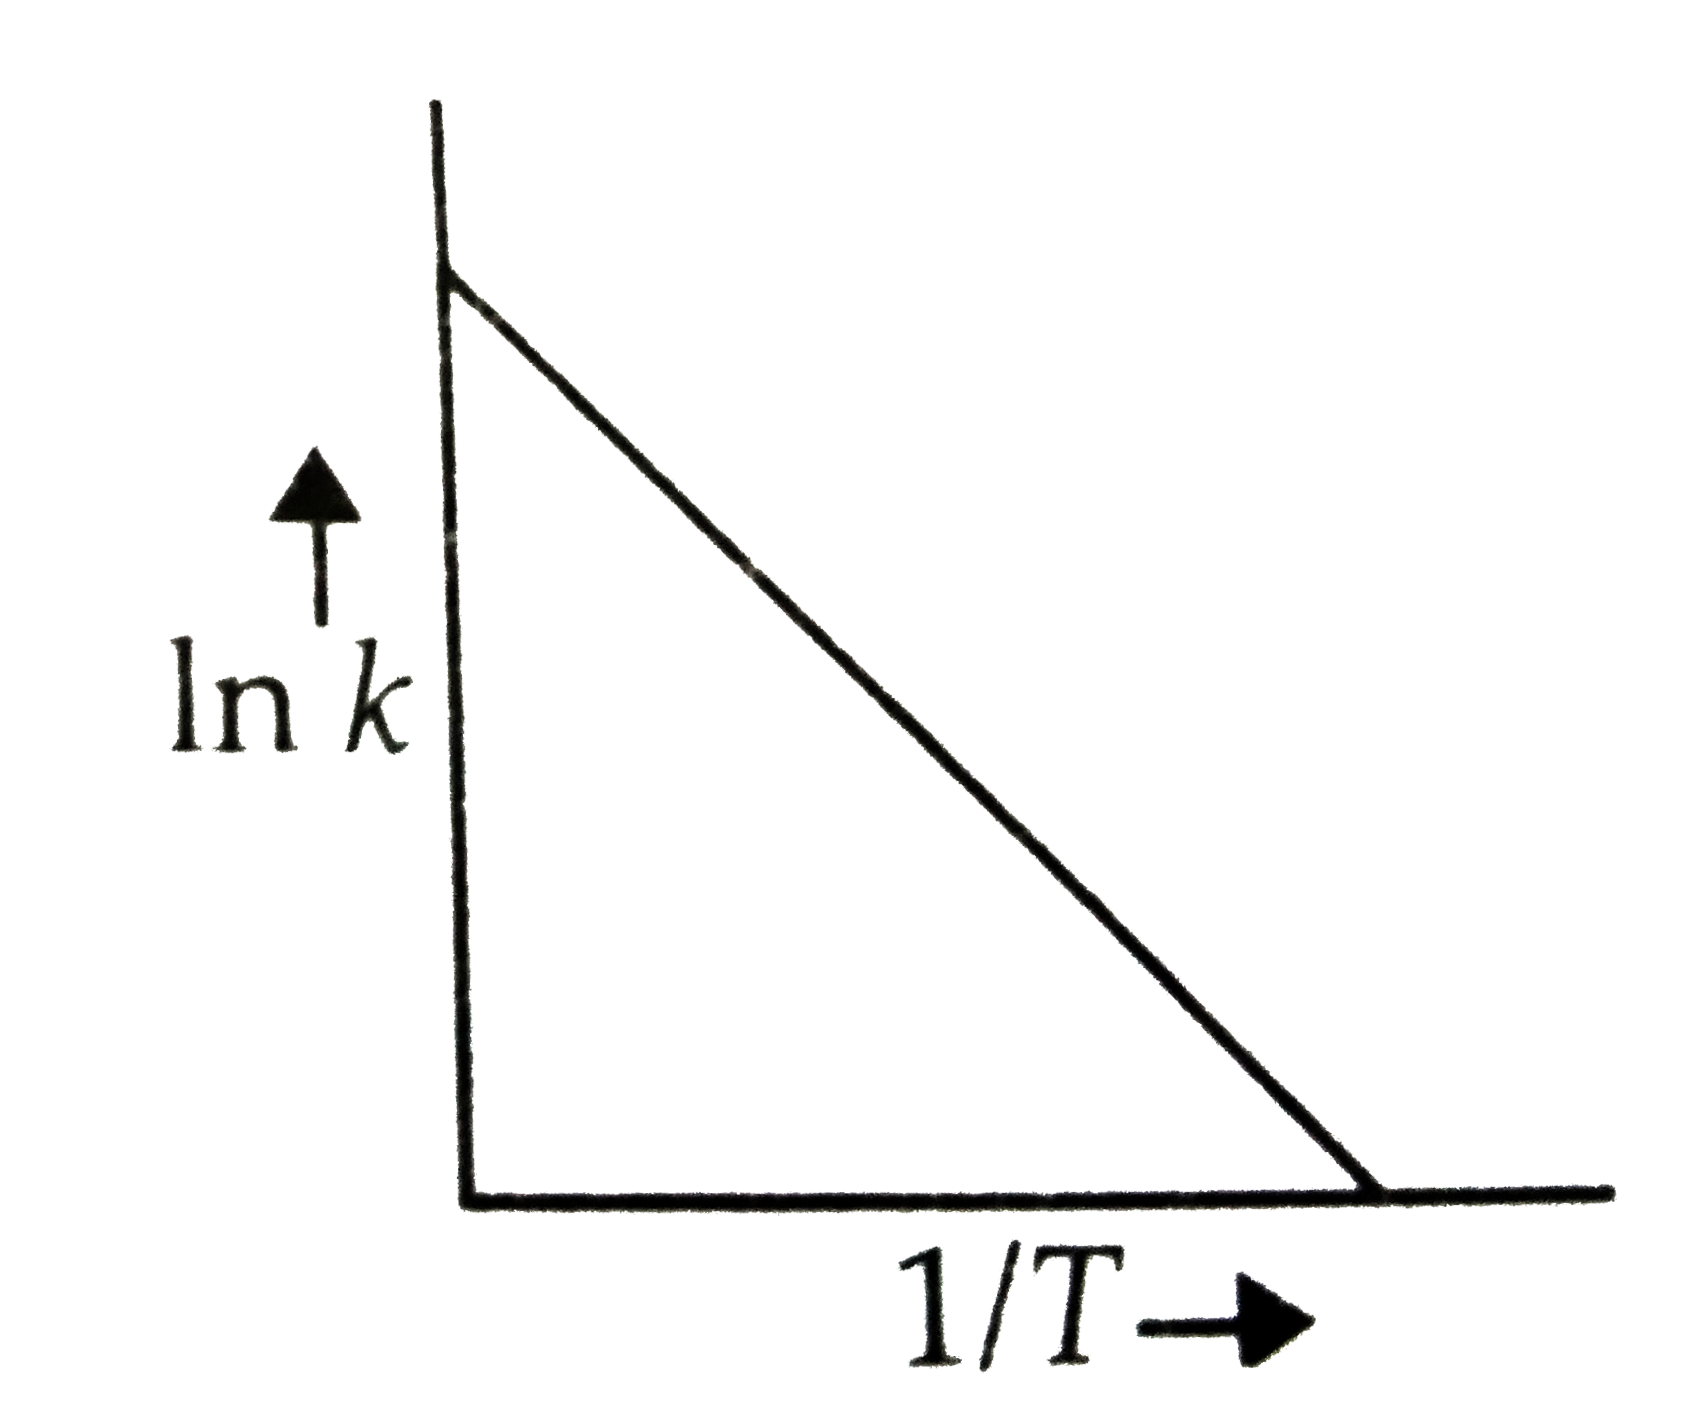 B
B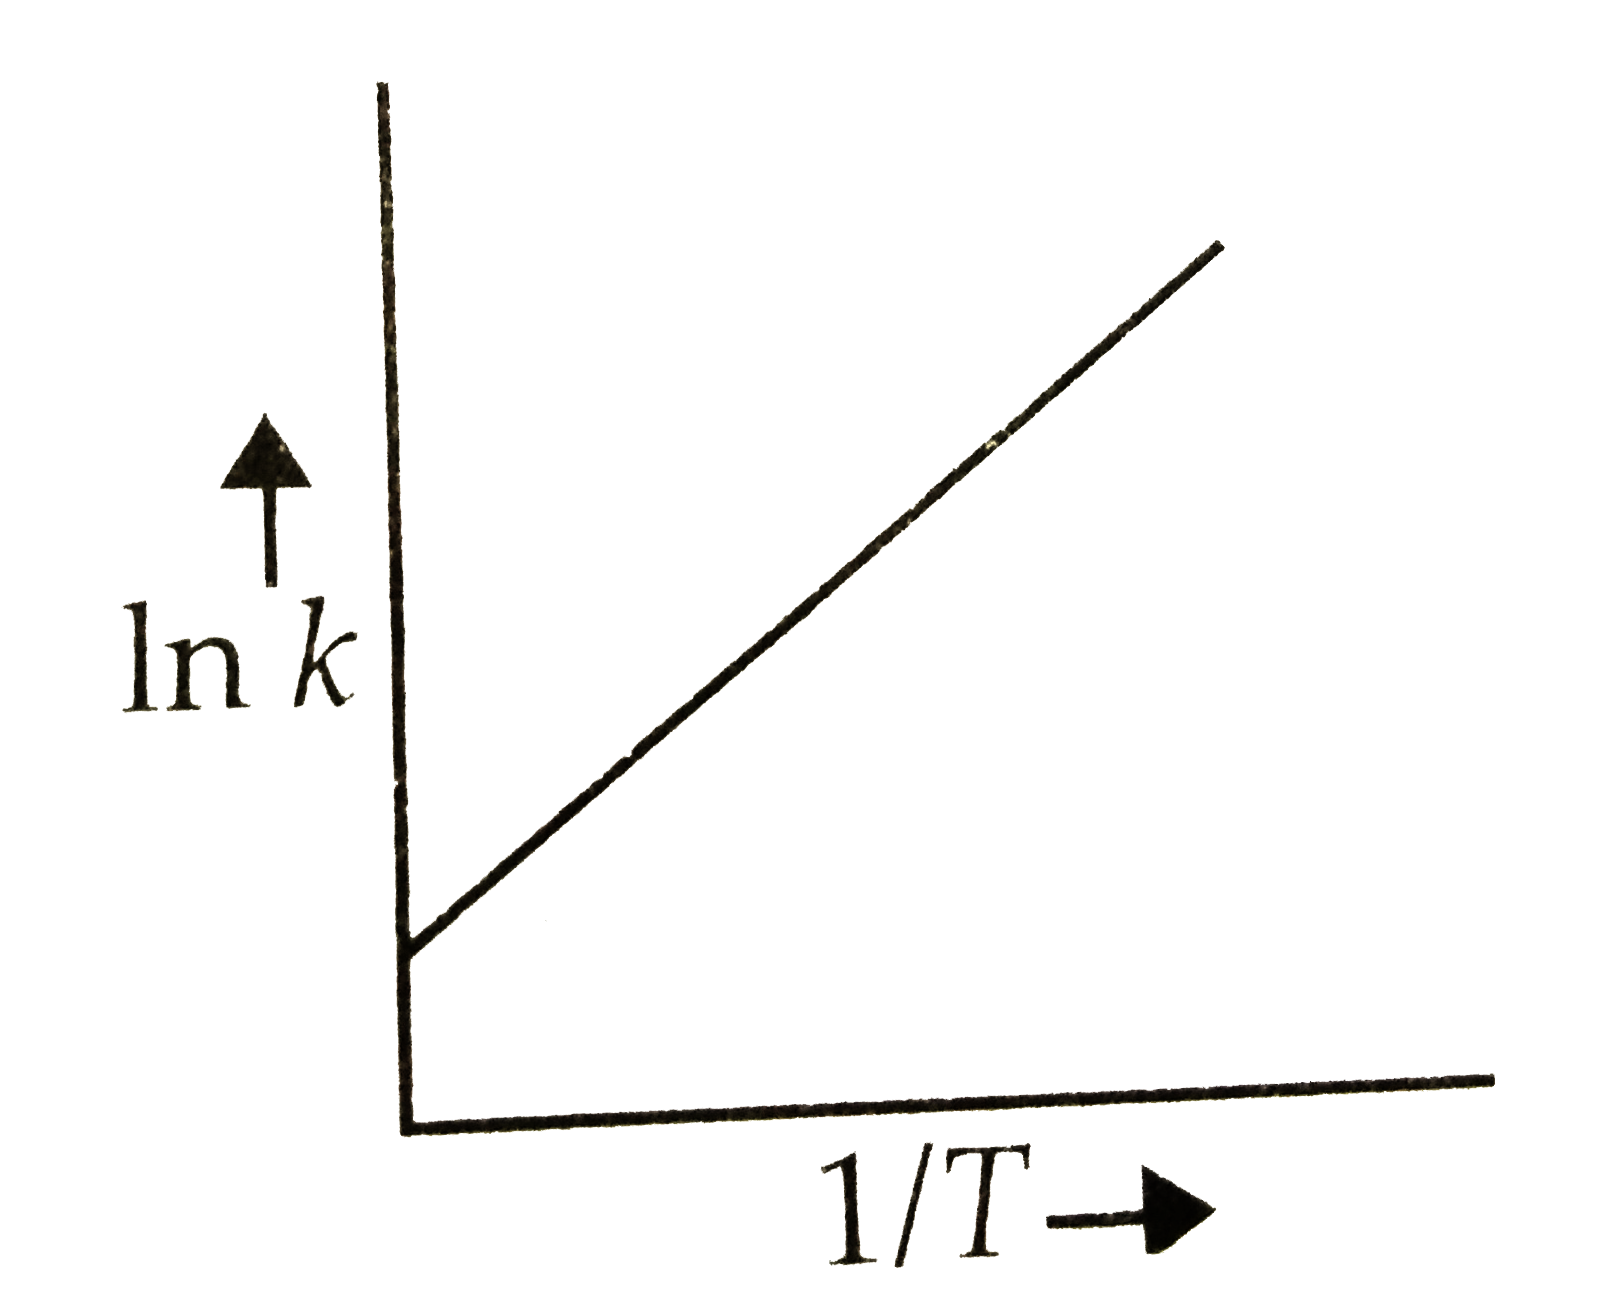 C
C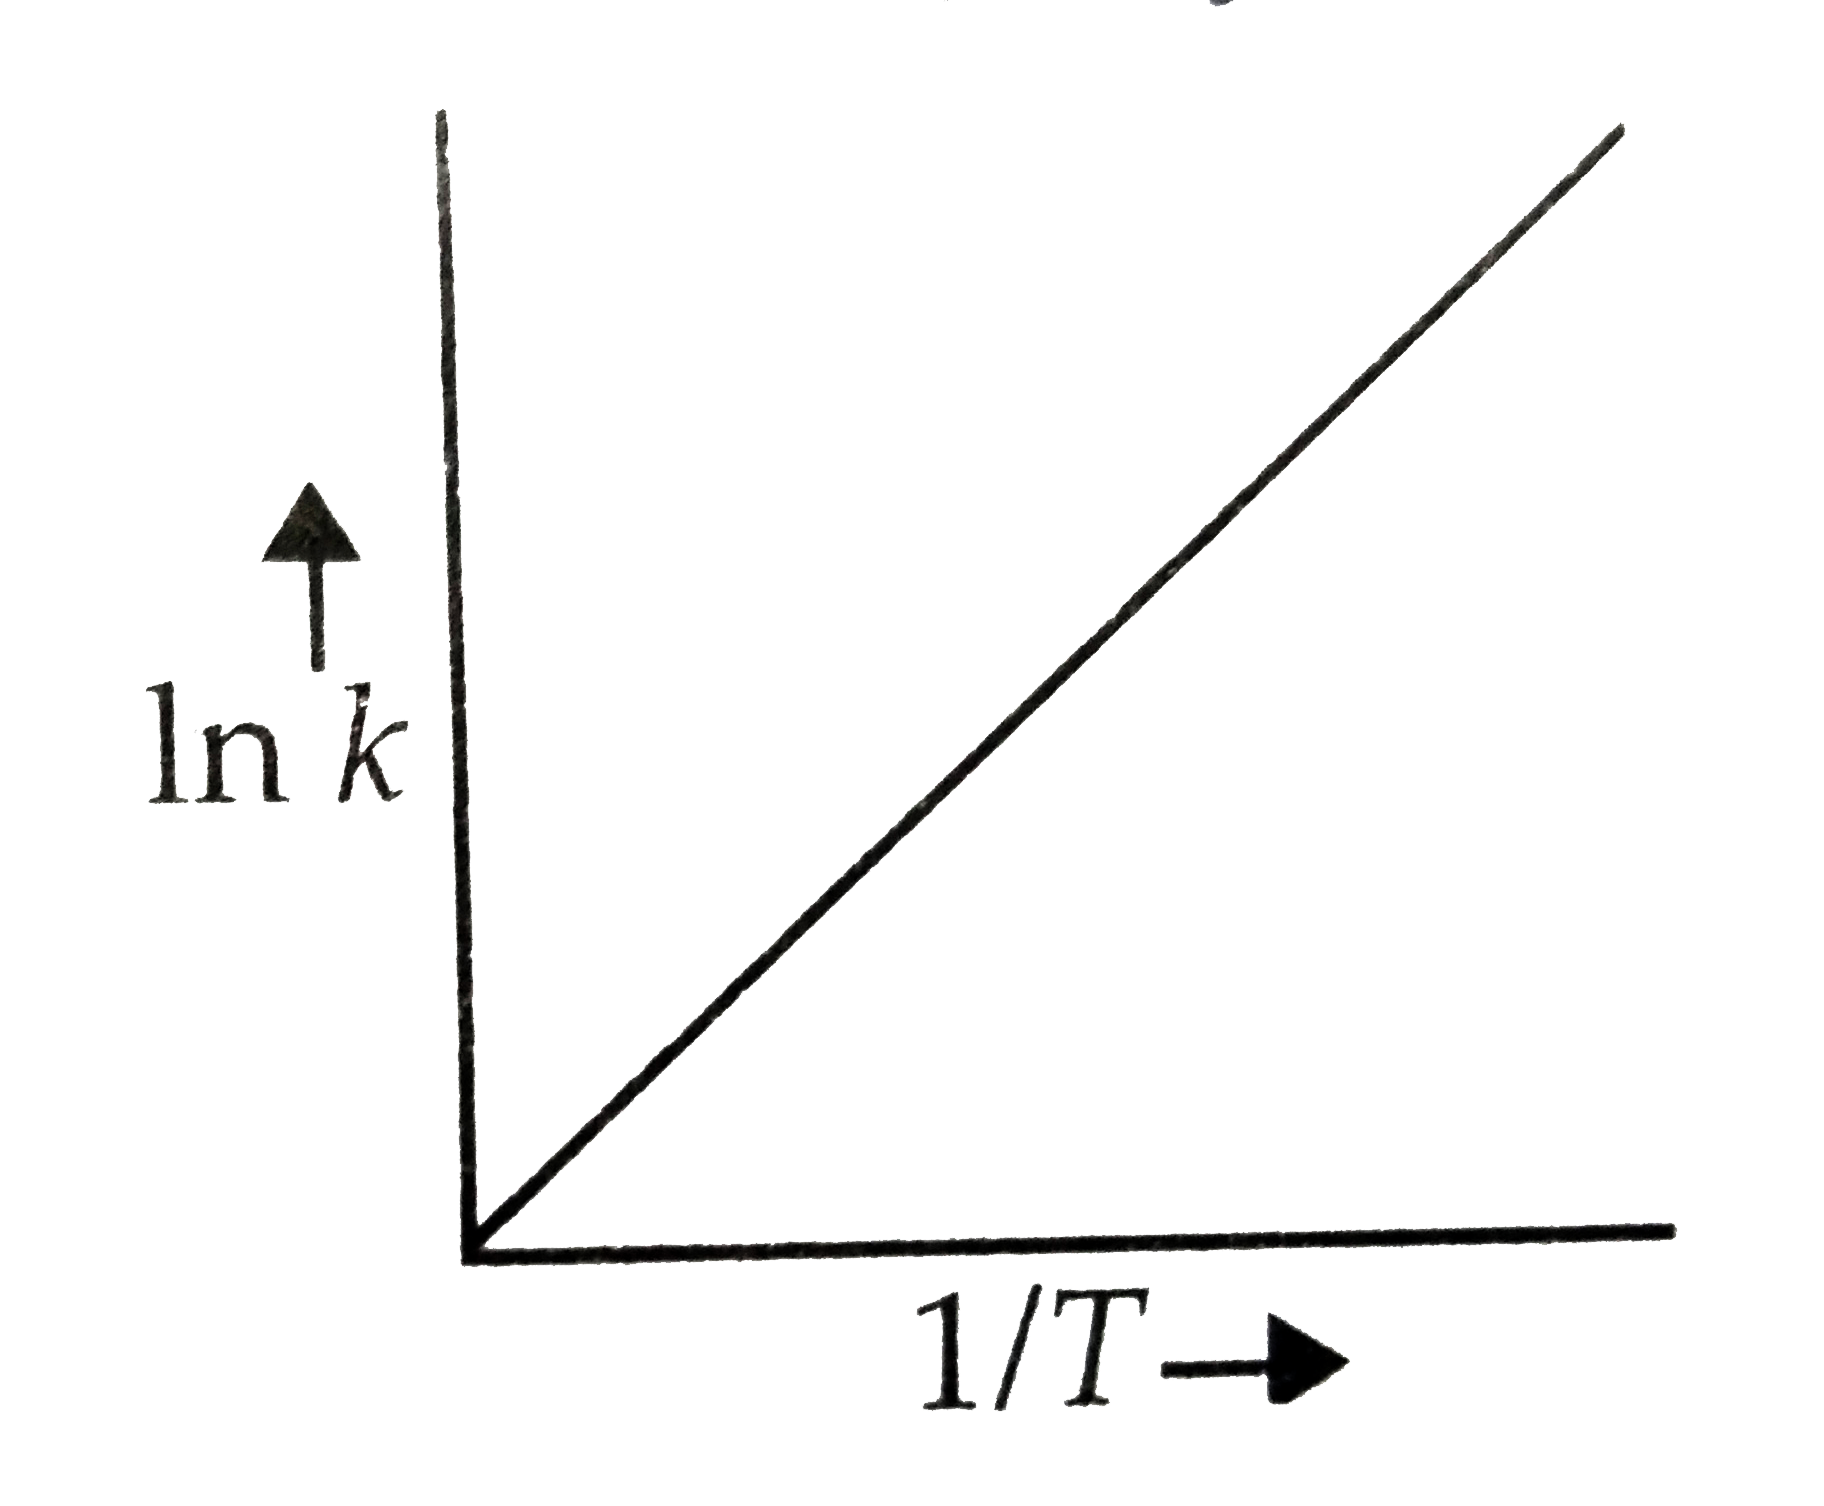 D
D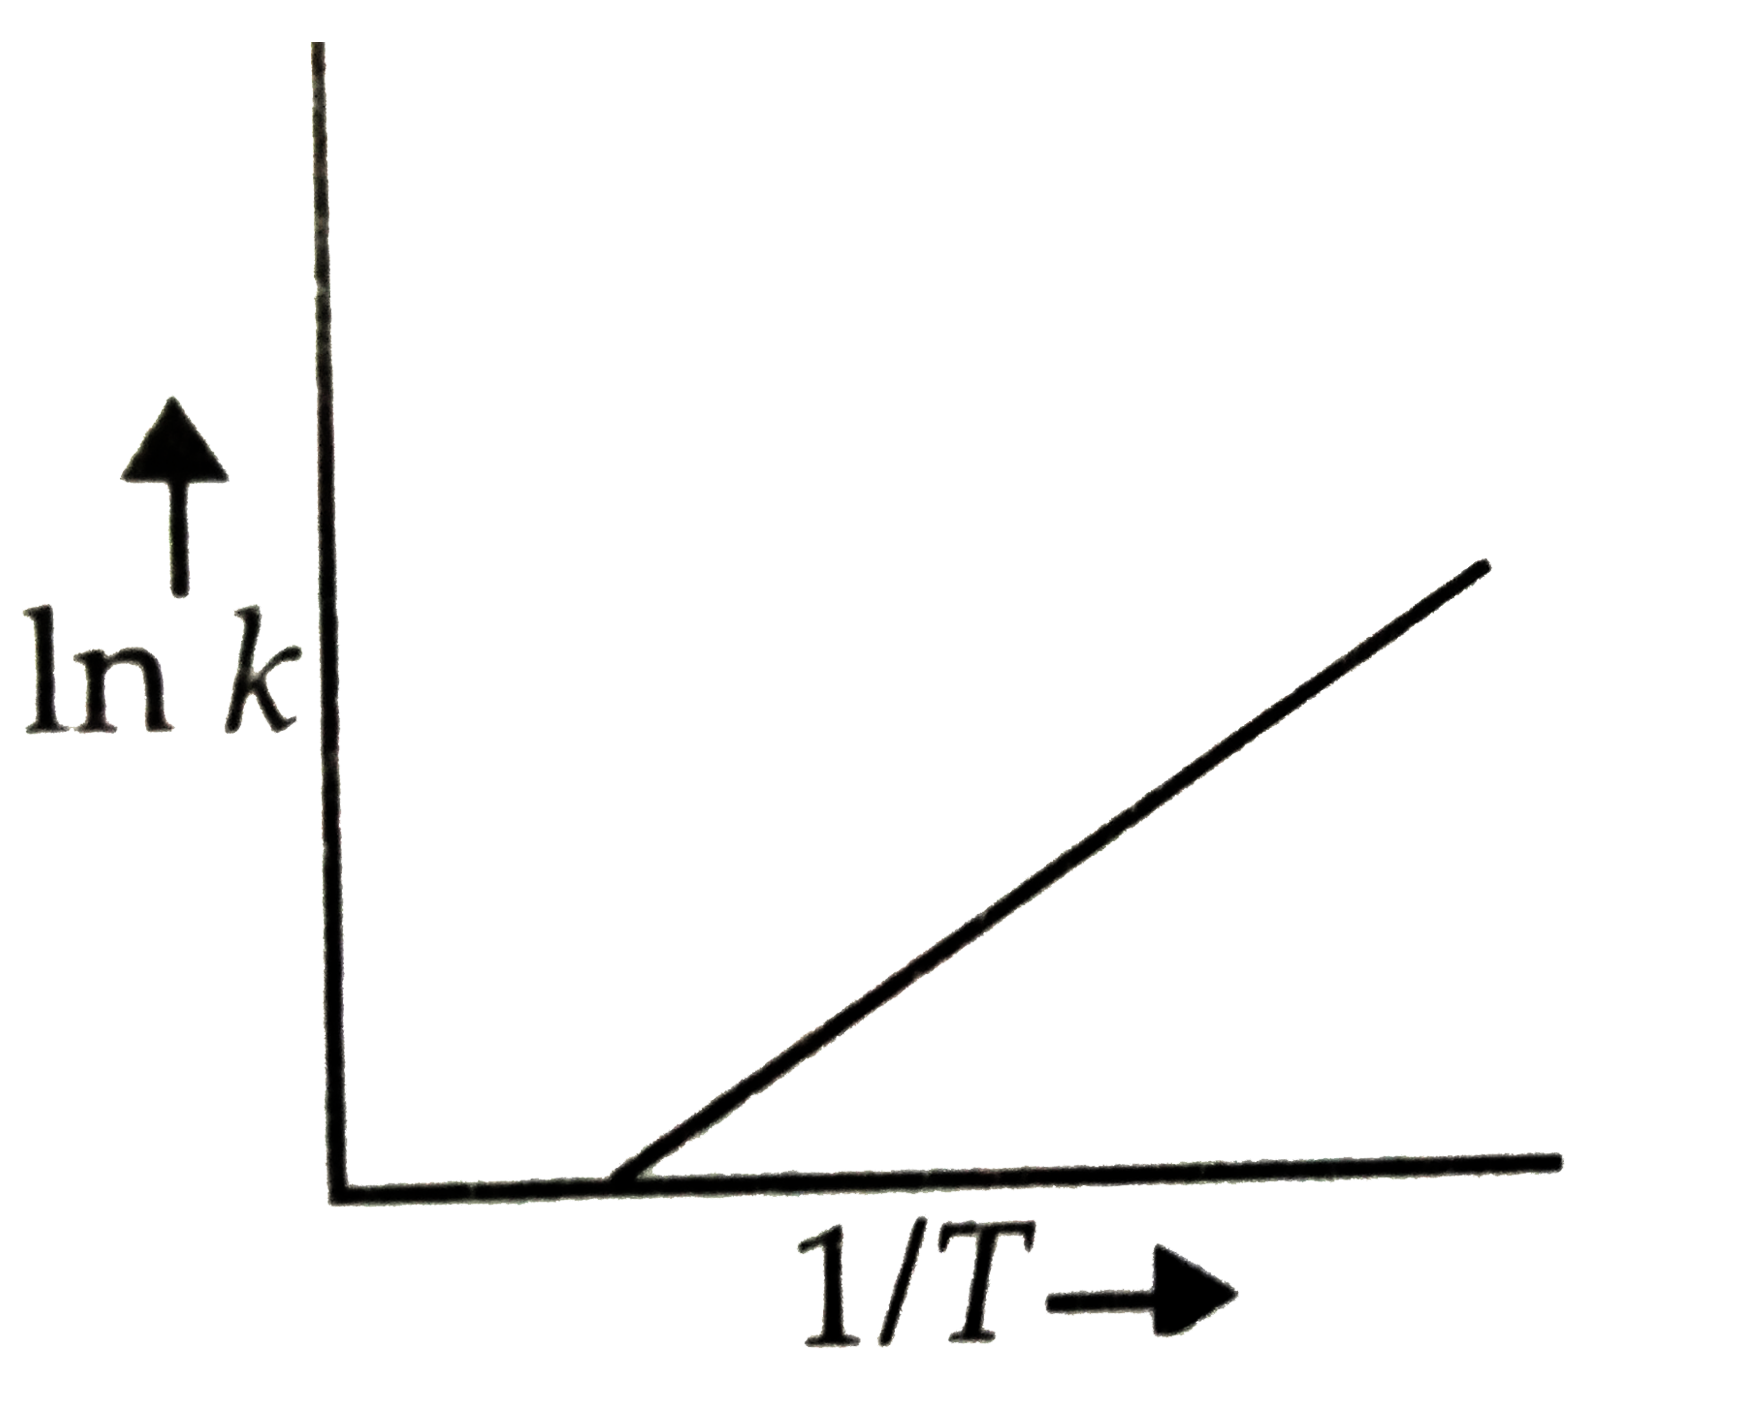
The intercept on y-axis and slope of curve plotted between P/T vs. T
( For an ideal gas having 10 moles in a closed rigid container of volume 8.21 L. (P= Pressure in atm and T = Temp. in K, log102=0.30)) are respectively :View SolutionAccording to Arrhenius equation rate constant K is equal to A e.−Ea/RT . Which of the following options represents the graph of ln K vs 1T?
View SolutionThe slope of the line graph of logk versus 1/T for the reaction N2O5→2NO2+1/2O2 is −5000.Calculate the energy of activation of the reaction (in kJK−1mol−1).
View SolutionThe slope of P-V graph for isochoric process is
View SolutionThe slope of the line in the graph of log k (k = rate constant) versus 1Tis - 5841. Calculate the activation energy of the reaction.
View SolutionThe slope of the line in the graph of log k (k = rate constant) versus 1Tis - 5841. Calculate the activation energy of the reaction.
View Solution


