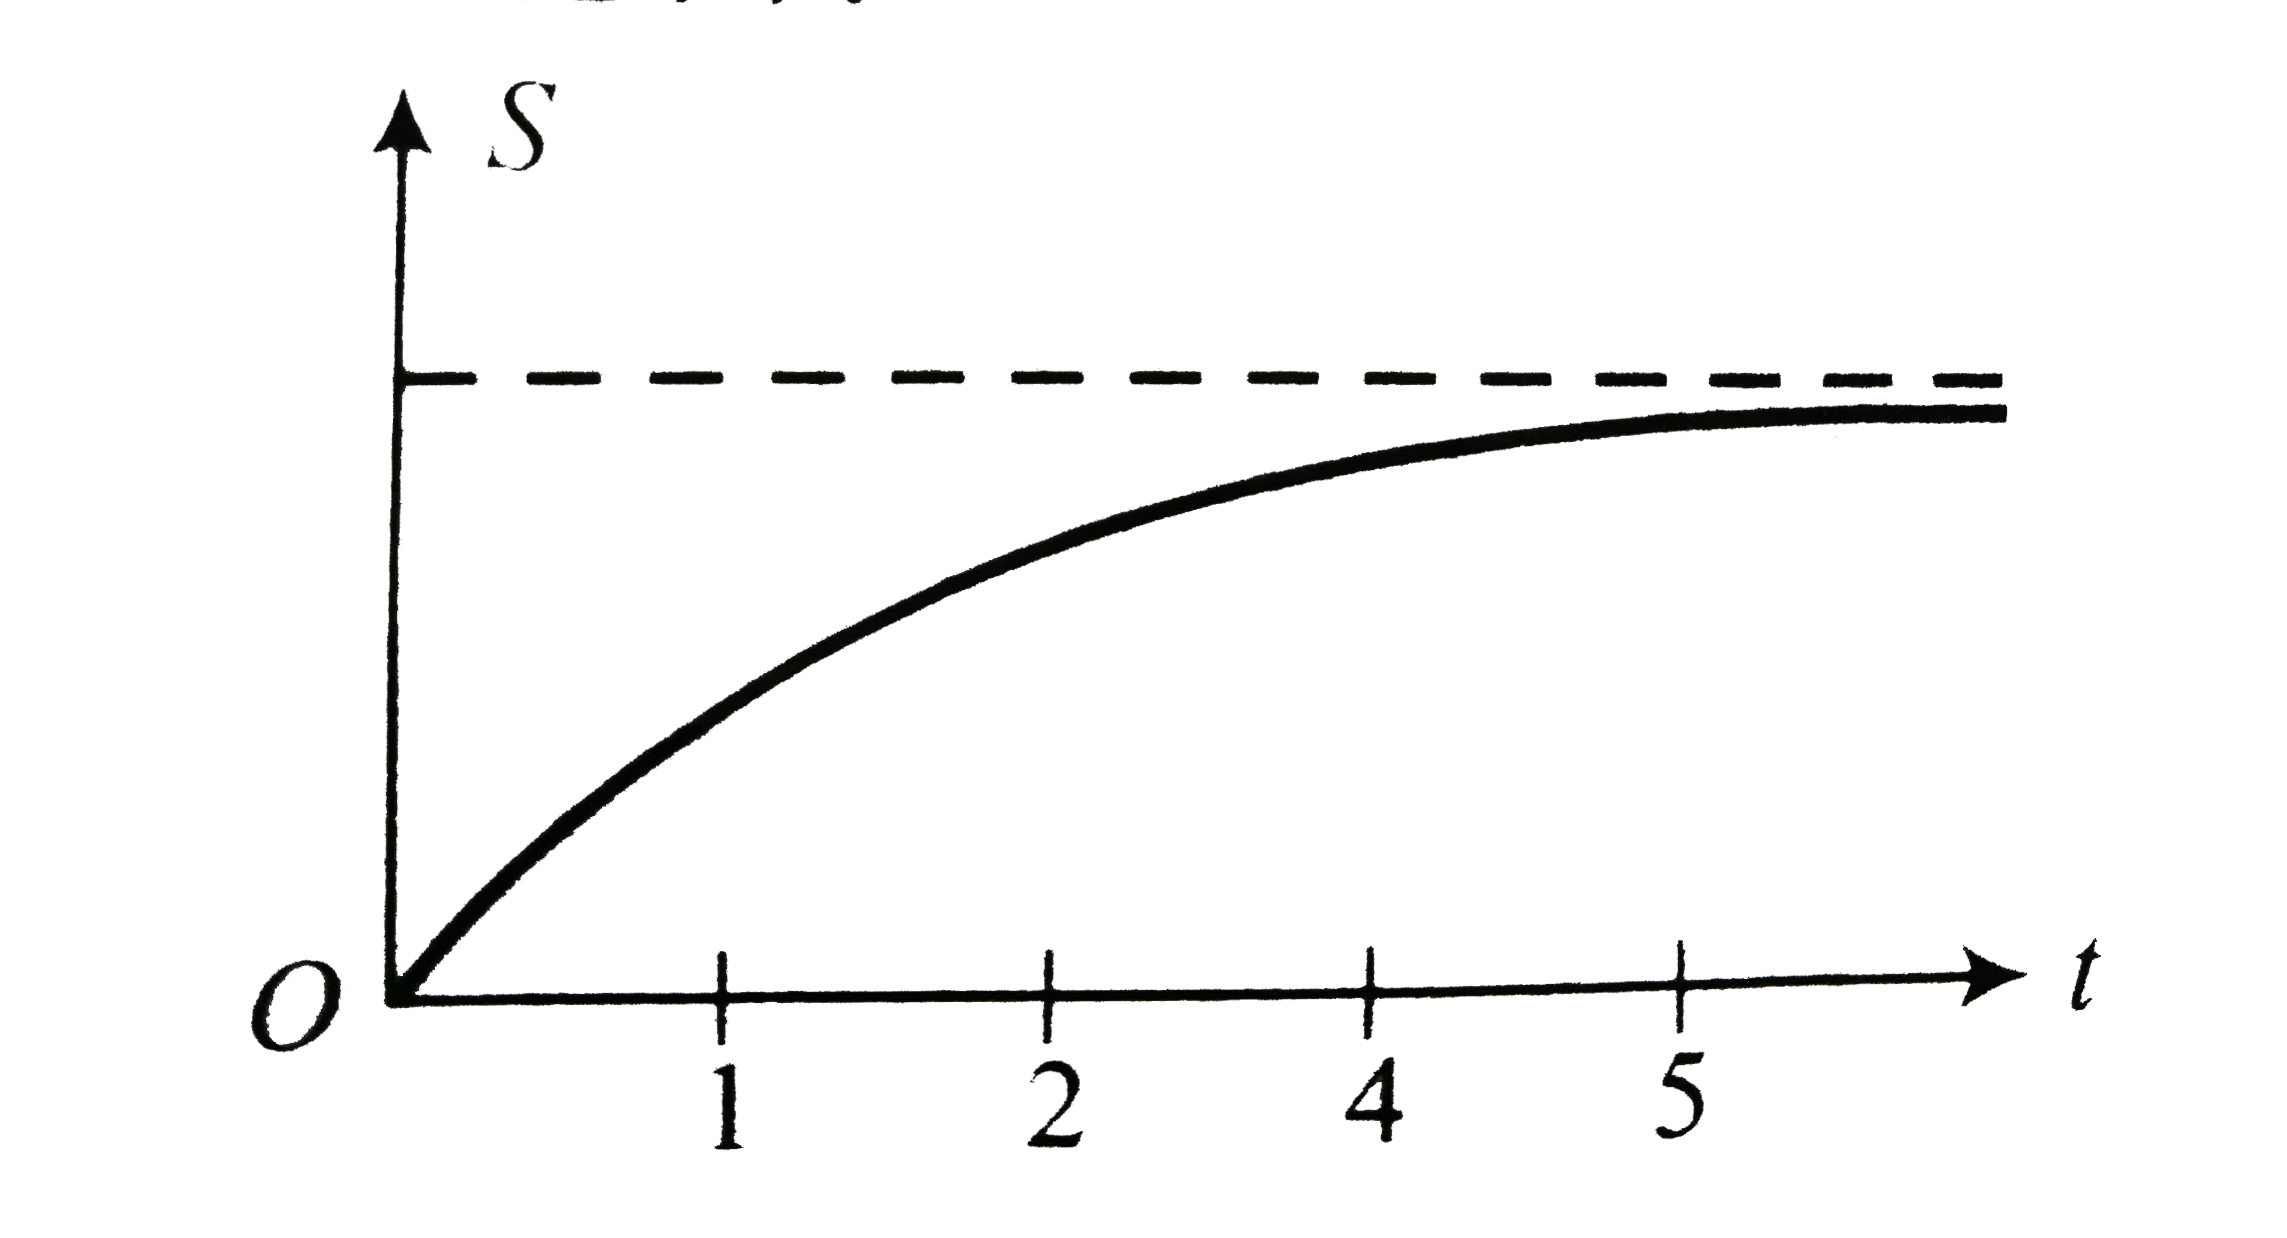
The displacement of a particle as a function of time is shown in the figure. The figure shows that

The particle starts with certain velocity but the motion is retarded and finally the particle stops
The velocity of the particle is constant throughout
The acceleration of the particle is constant throughout
The particle starts with constant velocity, then motion is accelerated and finally the particle moves with another constant velocity.
The correct Answer is:A
Step by step video & image solution for The displacement of a particle as a function of time is shown in the figure. The figure shows that by Physics experts to help you in doubts & scoring excellent marks in Class 12 exams.
Updated on:21/07/2023Topper's Solved these Questions
- MOTION IN A STRAIGHT LINE BOOK - AAKASH SERIESCHAPTER - MOTION IN A STRAIGHT LINE EXERCISE - EXERCISE -II
80 Videos
- MOTION IN A STRAIGHT LINE BOOK - AAKASH SERIESCHAPTER - MOTION IN A STRAIGHT LINE EXERCISE - PRACTICE EXERCISE
58 Videos
- MOTION IN A STRAIGHT LINE BOOK - AAKASH SERIESCHAPTER - MOTION IN A STRAIGHT LINE EXERCISE - very Short answer type question
15 Videos
- MOTION IN A PLANEBOOK - AAKASH SERIESCHAPTER - MOTION IN A PLANEEXERCISE - QUESTION FOR DESCRIPTIVE ANSWER
7 Videos
- MOVING CHARGES AND MAGNETISMBOOK - AAKASH SERIESCHAPTER - MOVING CHARGES AND MAGNETISMEXERCISE - EXERCISE-III
49 Videos
Similar Questions
The displacement of a particle as a function of time is shown in . It indicates
 .
.
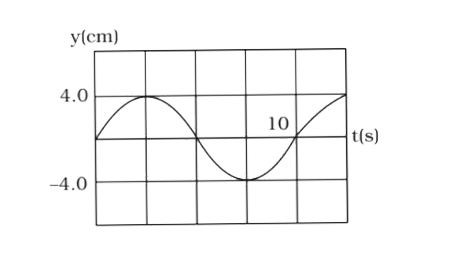
View SolutionA transverse sinusoidal wave of wavelength 20 cm is moving along a string towards increasing x. The transverse displacement of the string particle at as a function of time is shown in Figure.
The equation of the wave with all the constants evaluated is:
View SolutionA transverse sinusoidal wave of wavelength 20 cm is moving along a string towards increasing x. the transverse displacement of the string particle at x=0 as a function of time is shown in figure.
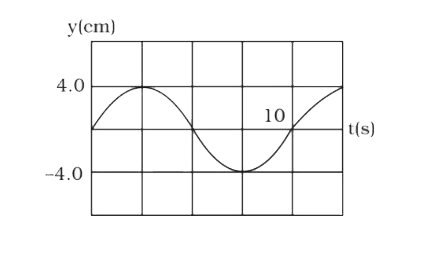
Q. The velocity of propagation of the wave is ?
View SolutionThe displacement-time graph of a particle executing SHM is as shown in the figure.

The corresponding force-time graph of the particle is
(a)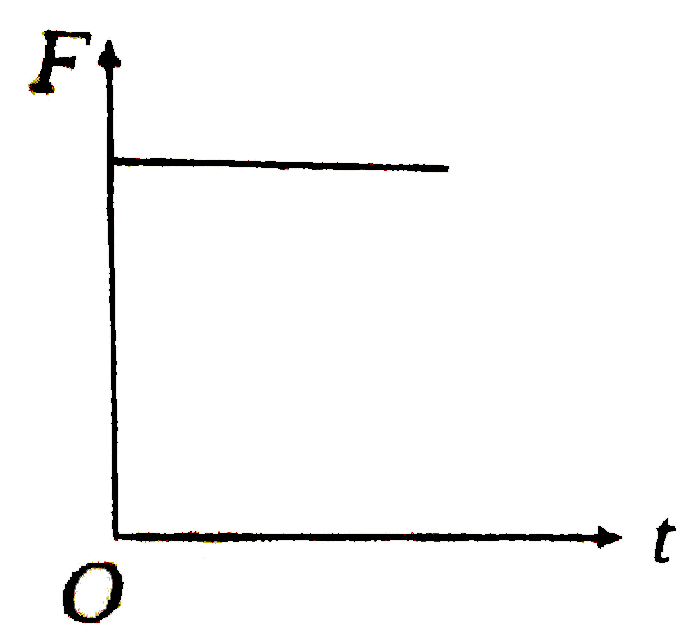
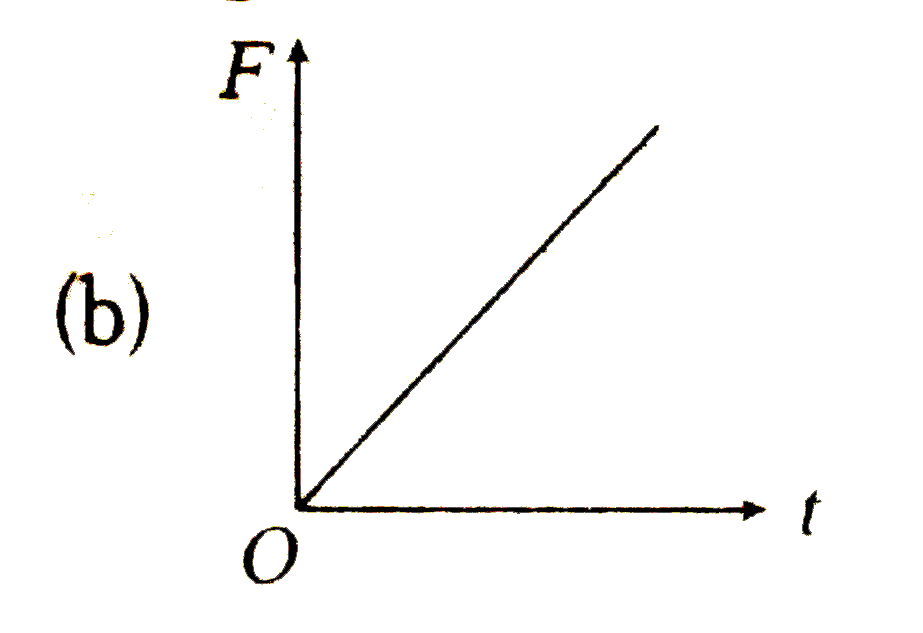
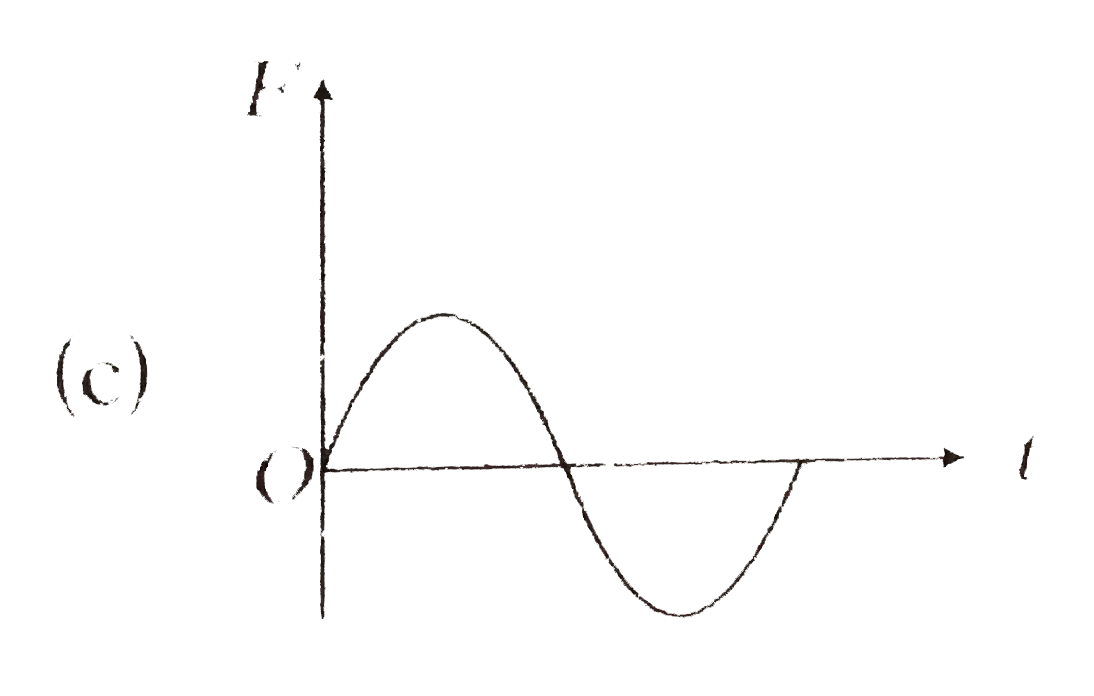
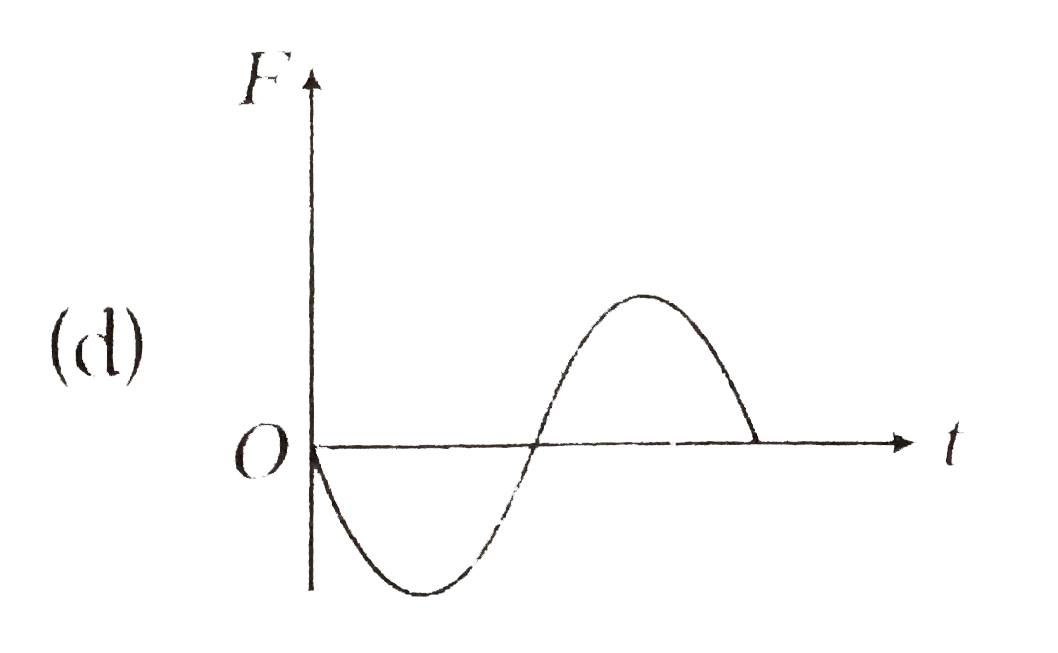
View SolutionThe displacement-time graphs of two particles P and Q are as shown in the figure. The ratio of their velocities VP and VQ will be

View SolutionThe displacement time graph of a particle executing S.H.M as shown in the figure.
 The corresponding force-time graph of the partical will be
View SolutionGraph of velocity versus displacement of a particle moving in a straight line is as shown in figure.
The acceleration of the particle is.
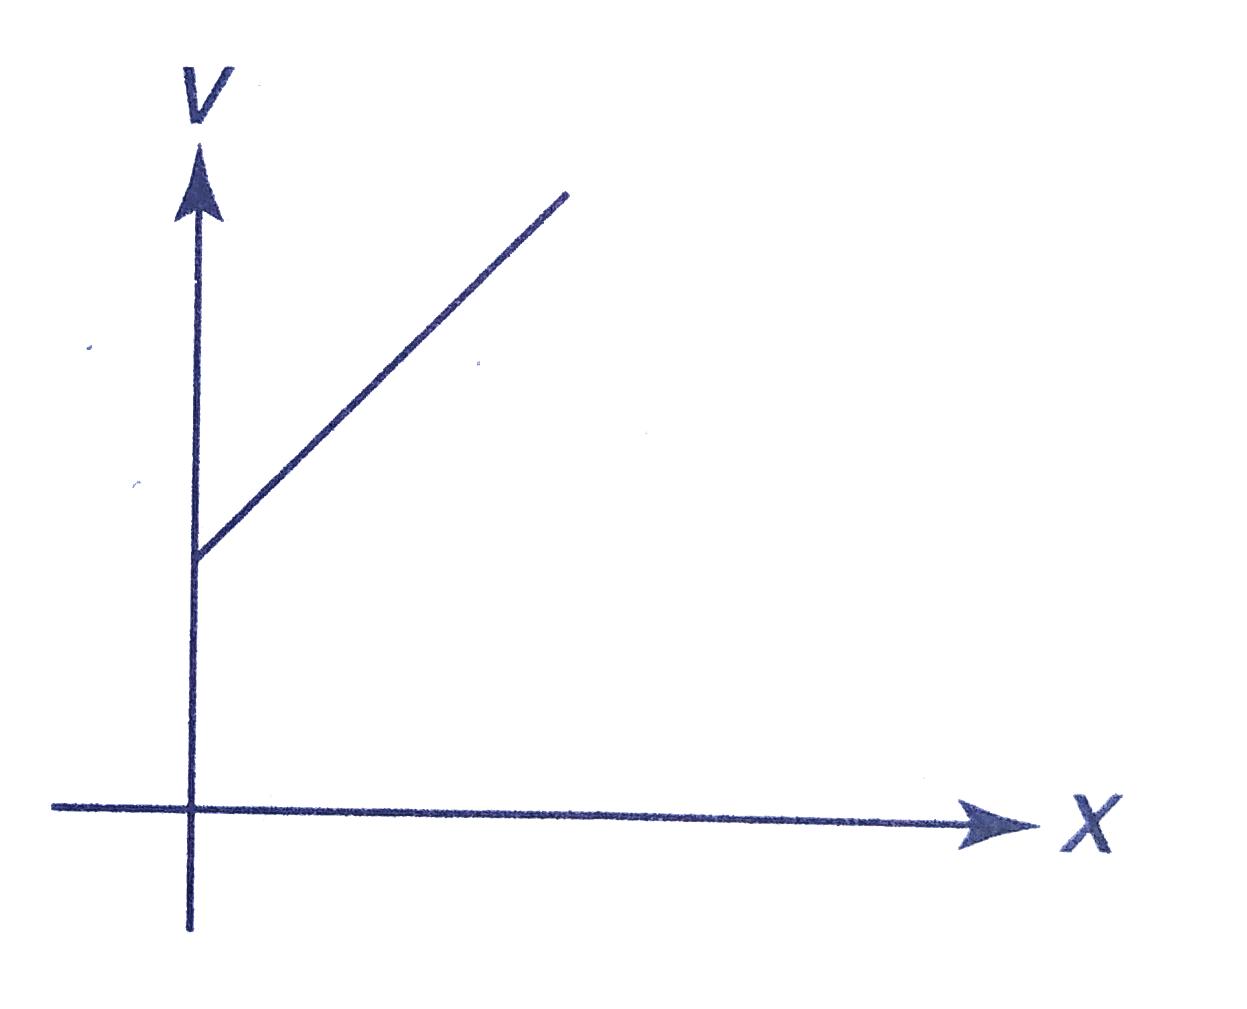
View SolutionThe acceleration-displacement graph of a particle executing simple harmonic motion is shown in the figure. The frequency of oscillation is
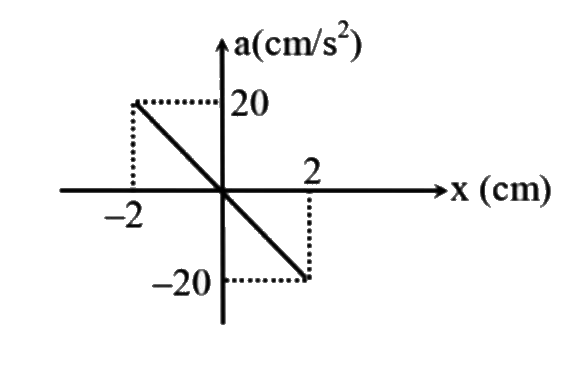
View SolutionAcceleration displacement (a-x) graph of a particle executing S.H.M. is shown in the figure. The frequency of oscillation is (tanθ=8)
View SolutionFigure shows the displacement of a particle going along the X-axis as a function of time. The force acting on the particle is zero in the region

View Solution
