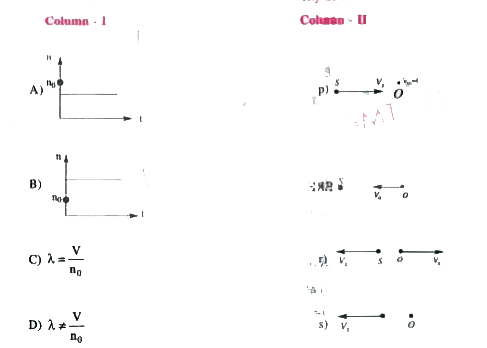
The following figures in the Column-II indicate the direction of motion of source and the observer match the corresponding graph in Column-I drawn between the apparent frequency. and time V0 is the velocity of observer Vs the velocity of source, and n0 the frequency of the source

The correct Answer is:A, B, C, D
Step by step video & image solution for The following figures in the Column-II indicate the direction of motion of source and the observer match the corresponding graph in Column-I drawn between the apparent frequency. and time V_0 is the velocity of observer V_s the velocity of source, and n_0 the frequency of the source by Physics experts to help you in doubts & scoring excellent marks in Class 12 exams.
Updated on:21/07/2023Topper's Solved these Questions
- WAVE MOTIONBOOK - AAKASH SERIESCHAPTER - WAVE MOTIONEXERCISE - PRACTICE SET (EXERCISE-VI (LEVEL-II(ADVANCED) INTEGER TYPE QUESTIONS))
4 Videos
- WAVE MOTIONBOOK - AAKASH SERIESCHAPTER - WAVE MOTIONEXERCISE - ADDITIONAL PRACTICE EXERCISE (LEVEL-I(MAIN) STRAIGHT OBJECTIVE TYPE QUESTIONS))
14 Videos
- WAVE MOTIONBOOK - AAKASH SERIESCHAPTER - WAVE MOTIONEXERCISE - PRACTICE SET (EXERCISE-VI (LEVEL-II(ADVANCED) LINKED COMPREHENSION TYPE QUESTIONS))
9 Videos
- UNITS AND MEASUREMENTSBOOK - AAKASH SERIESCHAPTER - UNITS AND MEASUREMENTSEXERCISE - EXERCISE -3
66 Videos
- WAVE MOTION AND SOUNDBOOK - AAKASH SERIESCHAPTER - WAVE MOTION AND SOUNDEXERCISE - PROBLEMS (LEVEL - II)
97 Videos
Similar Questions
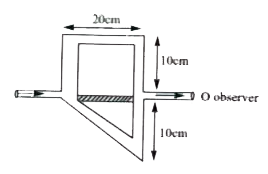
Find out frequency at which maximum intensity detected by observer 0. If velocity of sound =340m/s−1 and frequency range of source 2000 Hz to 5000 Hz

View Solution
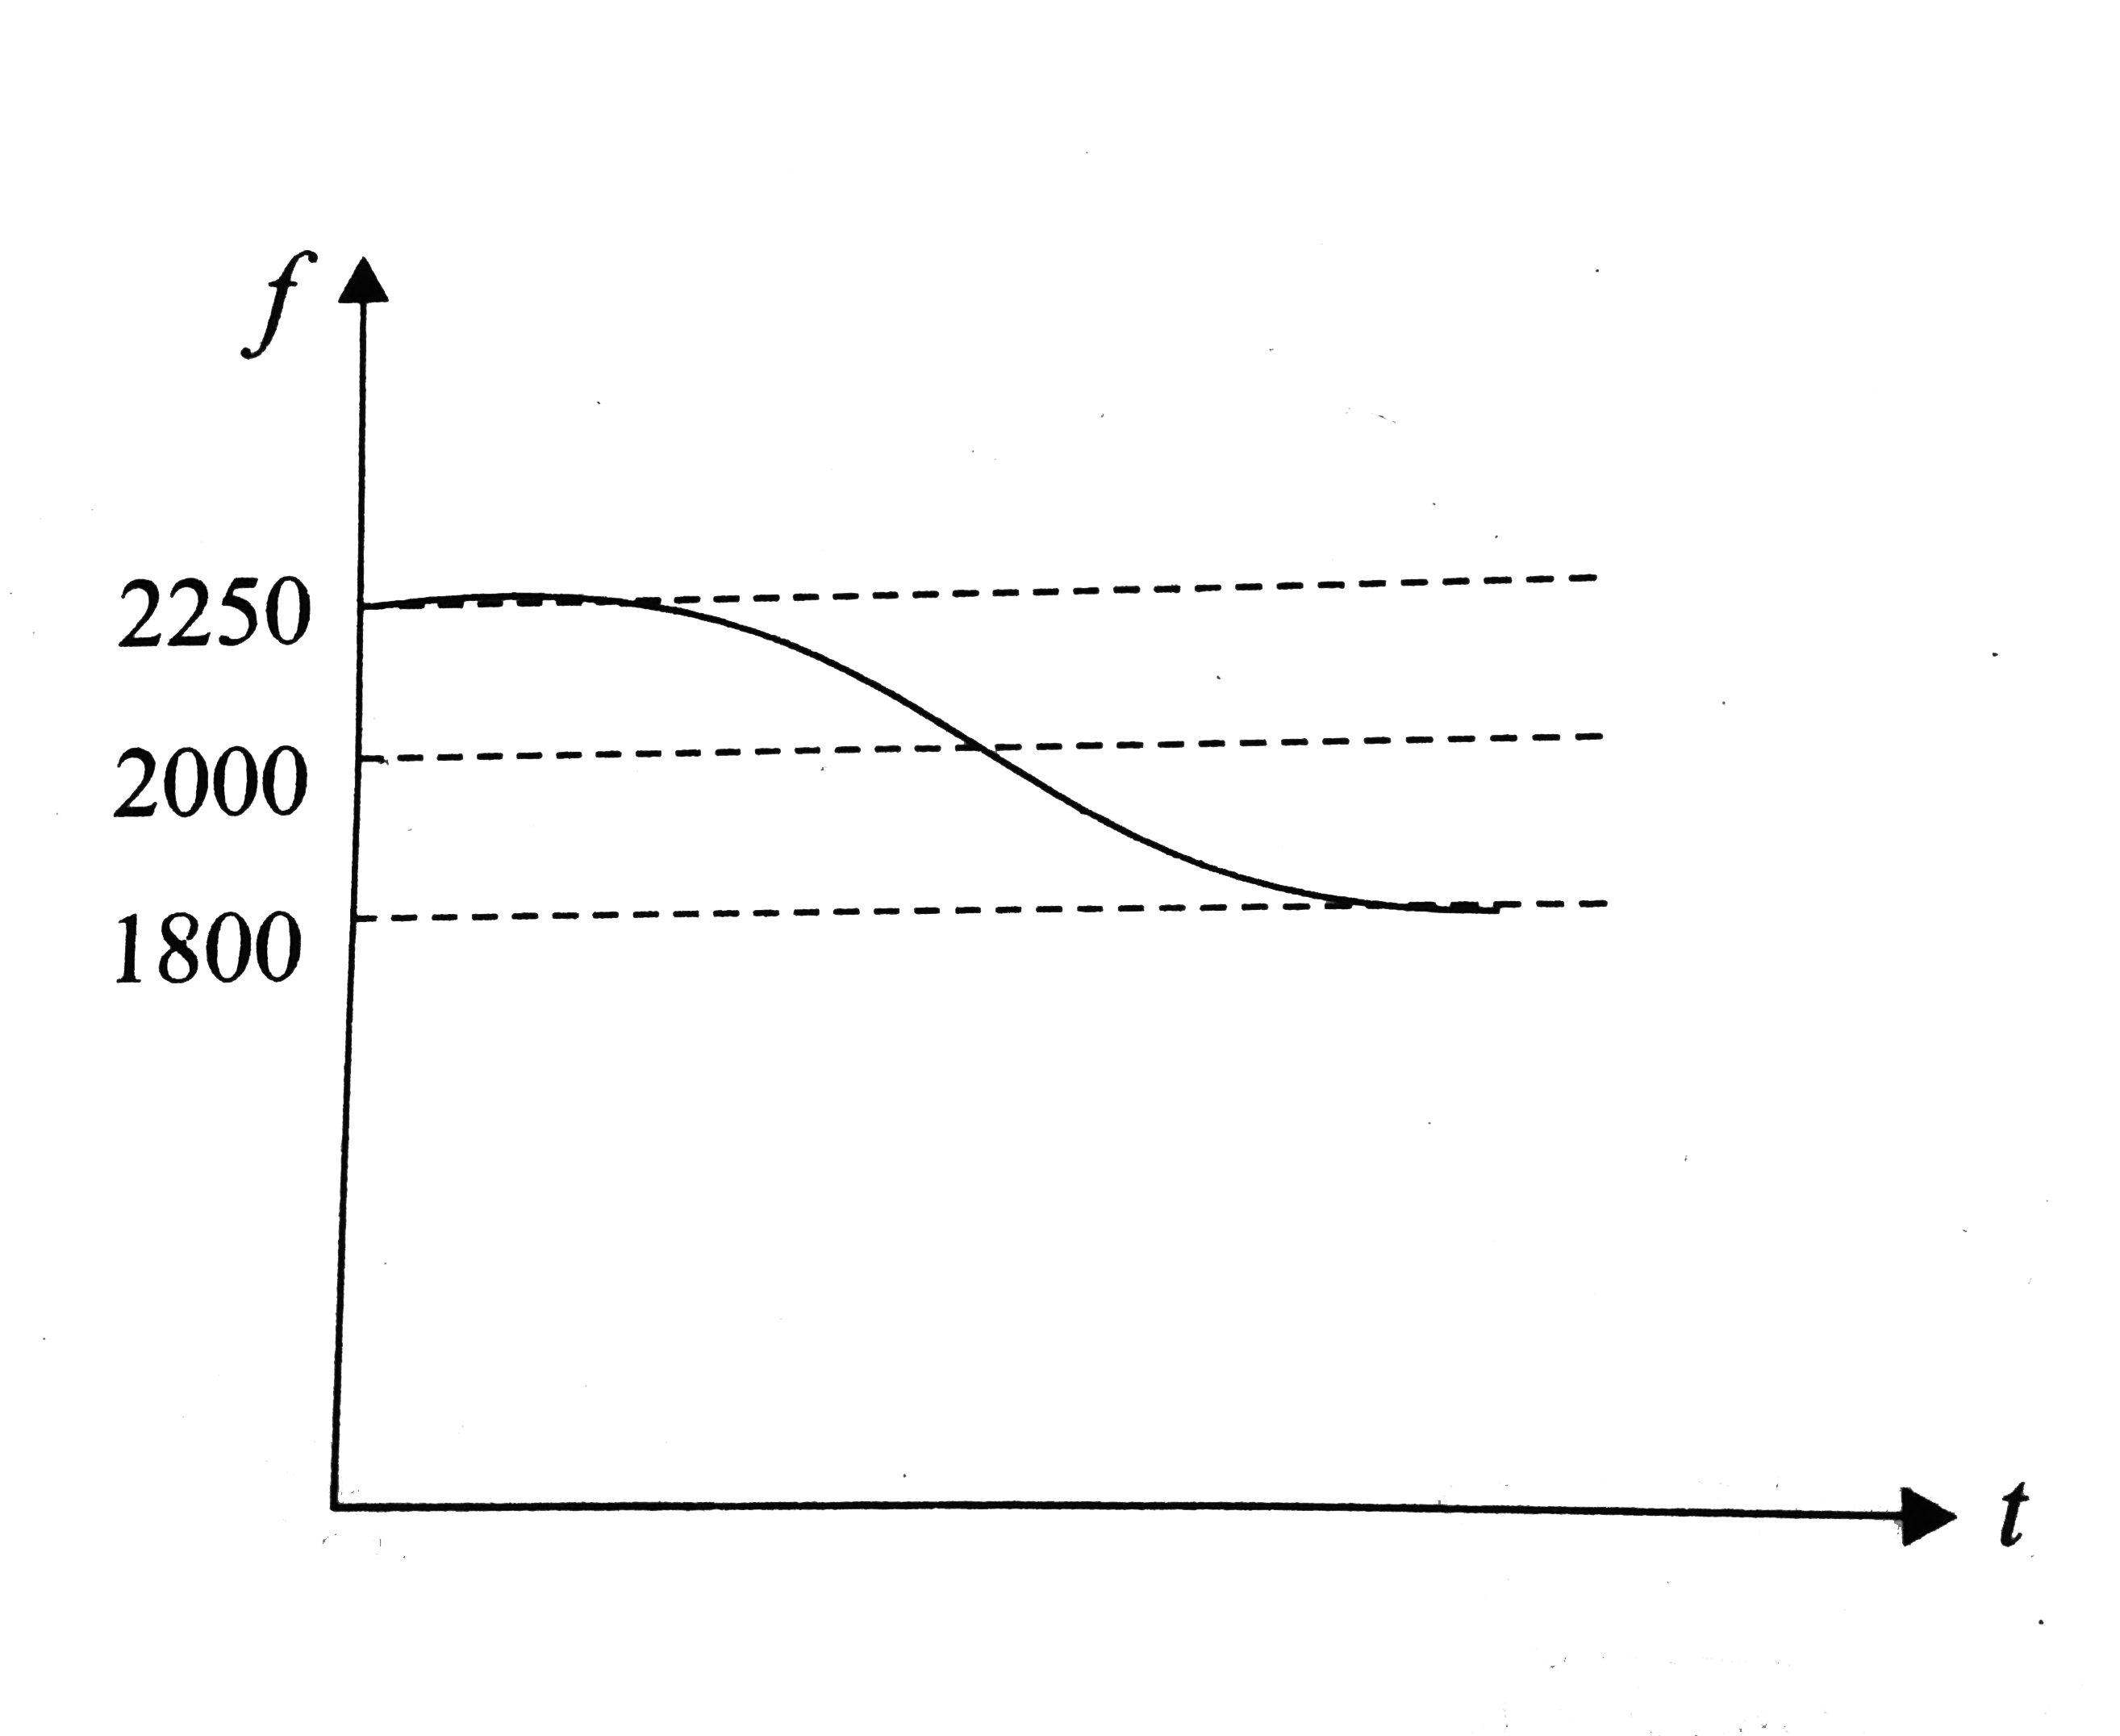
A statinary observer receives a sound of frequency 2000 Hz. The variation of apparent frequency and time is shown. Find the speed of source, if velocity of sound is 300ms
View Solution
Knowledge Check
The difference between the apparent frequency of a source of sound as perceived by the observer during its approach and recession is 2% of the natural frequency of the source. If the velocity of sound in air is 300 m/s, the velocity of the source is
A6 m/sB3 m/sC1.5 m/sD12 m/s
Source and observer start moving simulatneously along x and y-axis respectively. The speed of source is twice the speed of observer V0. If the ratio of observer frequency to the frequency of the source is 0.75, find the velocity of sound.
View SolutionSource and observer start moving simulatneously along x and y-axis respectively. The speed of source is twice the speed of observer V0. If the ratio of observer frequency to the frequency of the source is 0.75, find the velocity of sound.
View Solution(A): Apparent frequency is equal to actual frequency when there is no relative motion between source and observer.
(R): When there is no relative motion between the source and observer the velocity of sound is zero
View SolutionA source of sound of frequency 500 Hz is moving towards an observer with velocity 30 m/s . The speed of sound is 330 m/s . the frequency heard by the observer will be
View SolutionAn observer starts moving with unifrom acceleration a towards a stationary sound soure of frequency fo. As the observer approaches the source ,the apparent frequency f heard by the observer varies with time t as
View SolutionAssertion : A sound source is approaching towards a stationary observer along the tine joining them. Then , apparent frequency to the observer will go on increasing.
Reason : If there is no relative motion between source and observer , apparent frequency is equal to the actual frequency.
View Solutionsource and observer both start moving simultaneously from origion one along y - axis with speed of source = 2 (speed of observer ). The graph between the apparent frequency observed by observer (f) and time (t) would be
View Solution
