What kind pyramid is represented by the given figure ?
https://haygot.s3.amazonaws.com/questions/929221_4dbe11c723cb43258136cd29db69b611.png
Pyramid of numbers in a forest ecosystem
Pyramid of numbers in a parasitic food chain
Pyramid of biomass in forest ecosystem
It is a wrong pyramid
The correct Answer is:C
To determine what kind of pyramid is represented by the given figure, we can follow these steps:
Step 1: Analyze the Figure
- Look closely at the figure provided in the question. Identify the shape and structure of the pyramid.
Step 2: Identify the Components
- Check the labels or any indicators that show the different levels of the pyramid. Typically, a pyramid will have producers at the base, followed by primary consumers, secondary consumers, and so on.
Step 3: Understand Pyramid Types
- Recall the different types of ecological pyramids:
1. Pyramid of Numbers: Represents the number of organisms at each trophic level.
2. Pyramid of Biomass: Represents the total mass of living matter at each trophic level.
3. Pyramid of Energy: Represents the energy flow through each trophic level.
Step 4: Determine the Type of Pyramid
- Based on the analysis of the figure, determine if the pyramid shows a decrease in numbers, biomass, or energy as you move up the levels.
- If the figure indicates a decrease in biomass at each ascending level, it suggests that it is a pyramid of biomass.
Step 5: Match with Options
- Compare your findings with the provided options:
1. Pyramid of numbers in forest ecosystem.
2. Pyramid of numbers in parasitic food chain.
3. Pyramid of biomass in forest ecosystem.
4. It is a wrong pyramid.
Step 6: Select the Correct Answer
- Since the analysis indicates that the figure represents a pyramid of biomass in a forest ecosystem, the correct answer is option C: Pyramid of biomass in forest ecosystem.
Final Answer
The pyramid represented by the given figure is a Pyramid of Biomass in Forest Ecosystem.
---
- Look closely at the figure provided in the question. Identify the shape and structure of the pyramid.
- Check the labels or any indicators that show the different levels of the pyramid. Typically, a pyramid will have producers at the base, followed by primary consumers, secondary consumers, and so on.
- Recall the different types of ecological pyramids:
1. Pyramid of Numbers: Represents the number of organisms at each trophic level.
2. Pyramid of Biomass: Represents the total mass of living matter at each trophic level.
3. Pyramid of Energy: Represents the energy flow through each trophic level.
- Based on the analysis of the figure, determine if the pyramid shows a decrease in numbers, biomass, or energy as you move up the levels.
- If the figure indicates a decrease in biomass at each ascending level, it suggests that it is a pyramid of biomass.
- Compare your findings with the provided options:
1. Pyramid of numbers in forest ecosystem.
2. Pyramid of numbers in parasitic food chain.
3. Pyramid of biomass in forest ecosystem.
4. It is a wrong pyramid.
- Since the analysis indicates that the figure represents a pyramid of biomass in a forest ecosystem, the correct answer is option C: Pyramid of biomass in forest ecosystem.
The pyramid represented by the given figure is a Pyramid of Biomass in Forest Ecosystem.
Topper's Solved these Questions
- ECOSYSTEMBOOK - AAKASH SERIESCHAPTER - ECOSYSTEMEXERCISE - EXERCISE-II (PLANT SUCCESSION)
25 Videos
- ECOSYSTEMBOOK - AAKASH SERIESCHAPTER - ECOSYSTEMEXERCISE - EXERCISE-II (NUTRIENT CYCLING)
11 Videos
- ECOSYSTEMBOOK - AAKASH SERIESCHAPTER - ECOSYSTEMEXERCISE - EXERCISE-II (ENERGY FLOW)
4 Videos
- CELL CYCLE AND CELL DIVISIONBOOK - AAKASH SERIESCHAPTER - CELL CYCLE AND CELL DIVISIONEXERCISE - Exercise-III
18 Videos
- ENVIRONMENTAL ISSUESBOOK - AAKASH SERIESCHAPTER - ENVIRONMENTAL ISSUESEXERCISE - Exercise-III (Previous AIPMT/NEET Questions)
41 Videos
Similar Questions
Fig 2.35 shows the velocity-time graph for two cars A and B moving in same direction. Which car has the greater acceleration ? Give reason to your answer.

Reason: Slope of straight line for car B is more than that of line A. https://haygot.s3.amazonaws.com/questions/202728_8d7544af7b20492cb472c5b5c8c57e3d.png
View SolutionA small sphere of radius R is held against the inner surface of a larger sphere of radius 6R. The mass of large and small spheres are 4M and M respectively. This arrangement is placed on a horizontal table. There is no friction between any surface of contact. The small sphere is now released. The x coordinate of the centre of the larger sphere when the smaller sphere reaches the other extreme position, is found to be (L+nR) , find n.
View Solution
Knowledge Check
On a logarithmic scale, the species area relationship is a straight line described by the equation log S = log C + Z log A.
What does S, C, Z and A represent in the given equation? Select the correct answer from the codes given below.
Species richness=1Slope of the line=2Y-intercept=3Area=4
a) 1 2 3 4
C S Z A
b) 1 2 3 4
S Z C A
c) 1 2 3 4
Z S C A
d) 1 2 3 4
A C S ZAa) 1234CSZABb) 1234SZCACc) 1234ZSCADd) 1234ACSZ
Consider an elliptically shaped rail PQ in the vertical plane with OP = 3 m and OQ = 4 m. A block of mass 1 kg is pulled along the rail from P to Q with a force of 18 N, which is always parallel to line PQ (see the figure given). Assuming no frictional losses, the kinetic energy of the block when it reaches Q is: (n×10) joules. The value of n is (take acceleration due to gravity = 10ms−2 )
 https://haygot.s3.amazonaws.com/questions/113759.jpg
View SolutionTwo friends Seema and Aditya work in the same office at Delhi. In the Christmas vacations, both decided to go to their hometowns represented by Town A and Town B respectively in the figure given below. Town A and Town B are connected by trains from the same station C (in the given figure)in Delhi.Based on the given situation, answer the following questions:
img src="https://d10lpgp6xz60nq.cloudfront.net/physics_images/MATH_041_X_SQP_E03_007_Q01.png" width="80%"gt
(i) Who will travel more distance, Seema or Aditya, to reach to their hometown?
(ii) Seema and Aditya planned to meet at a location D situated at a point D represented by the mid-point of the line joining the points represented by Town A and Town B. Find the coordinates of the point represented by the point D .
(iii) Find the area of the triangle formed by joining the points represented by A, B and C.
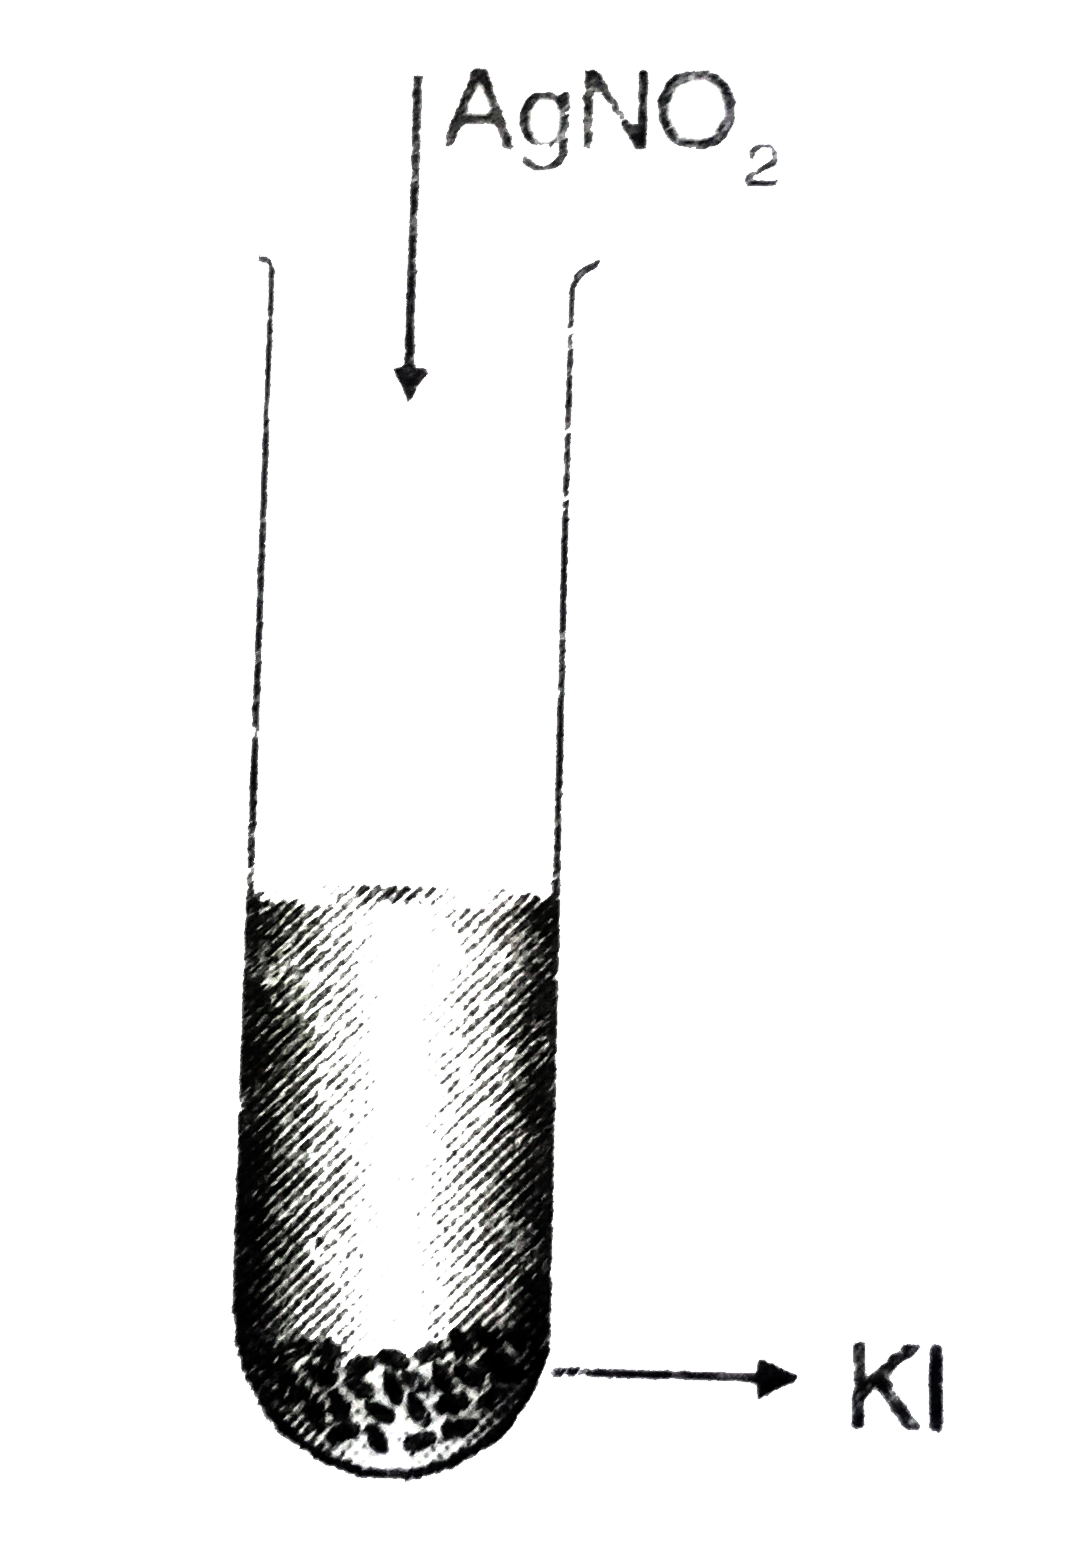
View Solution(a) A colloidal sol is prepared by the given method in figure. What is the charge of AgI colloidal particles in the test tube ? How is the sol formed, represented?
 (b) Explain how the phenomenon of adsorption finds application in Heterogeneous catalysis.
(c) Which of the following electroytes is the most effective for the coagulation of Fe(OH)3 sol which is a positively charged sol?
NaCI,Na2SO4,Na3PO4
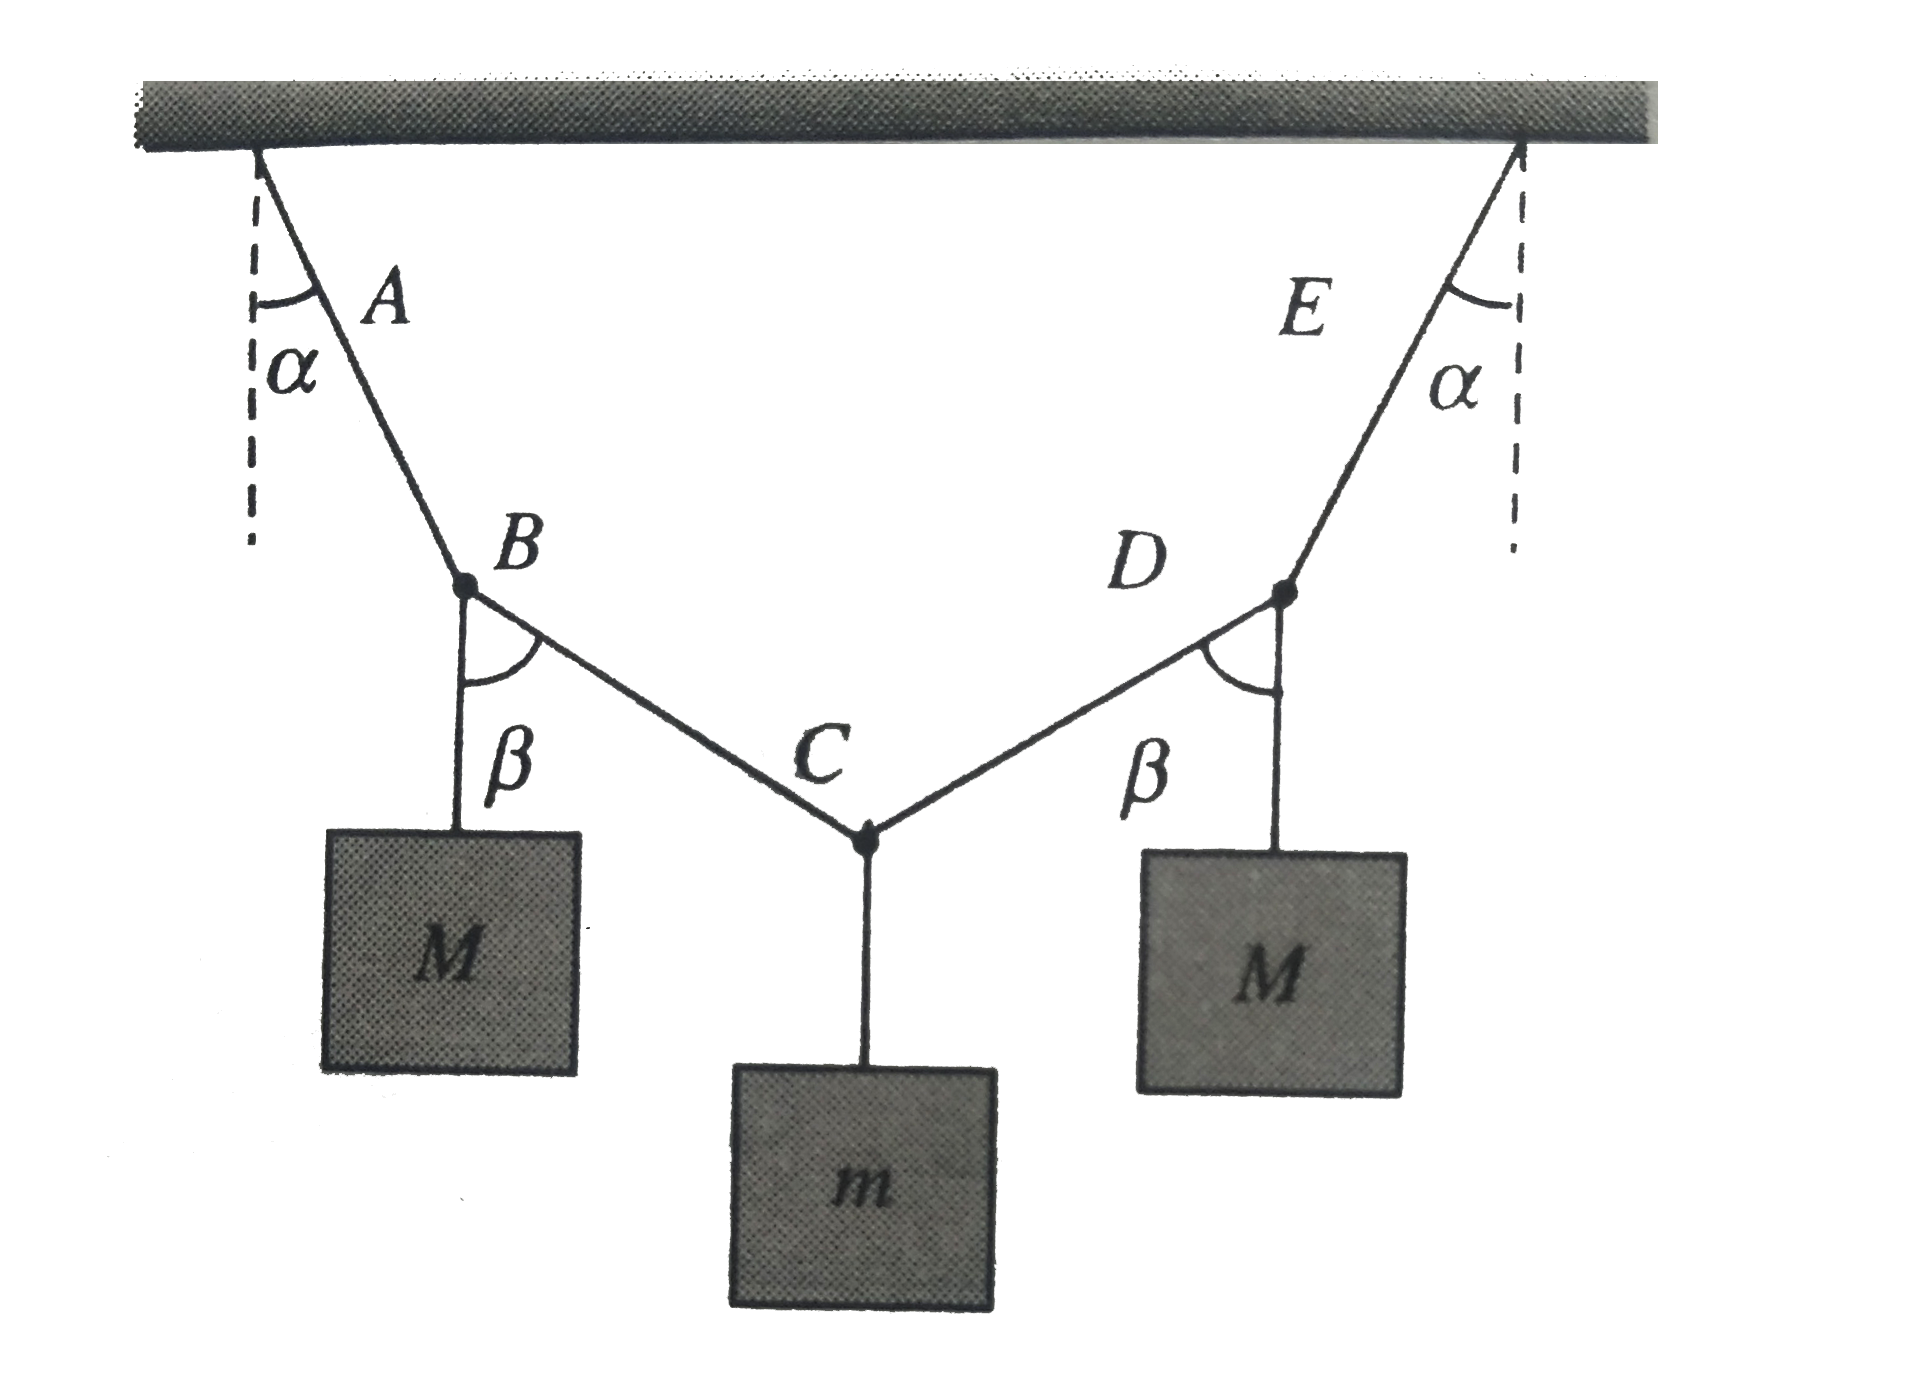
View SolutionFigure, represents a light inextensible string ABCDE in which AB=BC=CD=DE and to which are attached masses M,m, and M at the point B,C and D, respectively. The system hangs freely in equilibrium with ends A and E of the string fixed in the same horizontal line. it is given that tanα=3/4 and tanβ=12/5. Then the tension in the string BC is

View SolutionA tetrahedron is three dimensional figure bounded by four non coplanar triangular plane. So a tetrahedron has points A,B,C,D as its vertices, which have coordinates (x1,y1,z1)(x2,y2,z2),(x3,y3,z3)and(x4,y4,z4) respectively in a rectangular three –dimensional space. Then the coordinates of its centroid are
(x1+x2+x3+x44,y1+y2+y3+y44,z1+z2+z3+z44).
The circumcentre of the tetrahedron is the centre of a sphere passing through its vertices. So, the circumcentre is a point equidistant from each of the vertices of tetrahedron.
Let tetrahedron has three of its vertices represented by the points
(0,0,0),(6,−5,−1)and(−4,1,3) and its centroid lies at the point (1,−2,5). Now answer the following questions
The equation of the triangular plane of tetrahedron that contains the given vertices is :
View SolutionWhen an object moves through a fluid, as when a ball falls through air or a glass sphere falls through water te fluid exerts a viscous foce F on the object this force tends to slow the object for a small sphere of radius r moving is given by stoke's law, Fw=6πηrv. in this formula η in the coefficient of viscosity of the fluid which is the proportionality constant that determines how much tangential force is required to move a fluid layer at a constant speed v, when the layer has an area A and is located a perpendicular distance z from and immobile surface. the magnitude of the force is given by F=ηAv/z. For a viscous fluid to move from location 2 to location 1 along 2 must exceed that at location 1, poiseuilles's law given the volumes flow rate Q that results from such a pressure difference P2−P1. The flow rate of expressed by the formula Q=πR4(P2−P1)8ηL poiseuille's law remains valid as long as the fluid flow is laminar. For a sfficiently high speed however the flow becomes turbulent flow is laminar as long as the reynolds number is less than approximately 2000. This number is given by the formula Re=2¯vρRη In which ¯v is the average speed ρ is the density η is the coefficient of viscosity of the fluid and R is the radius of the pipe. Take the density of water to be ρ=1000kg/m3
Q. If the sphere in previous question has mass of 1×10⁻⁵kg what is its terminal velocity when falling through water? (η=1×10⁻³Pa−s)
A. 1.3m/s
B. 3.4m/s
C. 5.2m/s
D. 6.5m/s
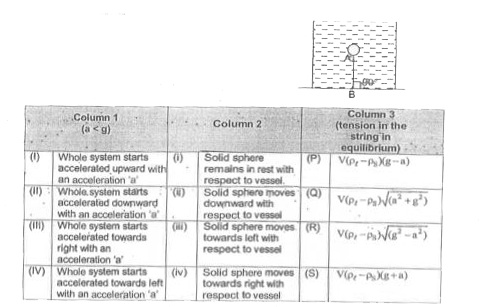
View SolutionThe following table has 3 comumn and 4 rows . . Based on table , there are Three questions . Each question has Four optios (A),(B) (C ) and (D) . ONLY One of these four options is correct .
A solid sphere of volume V and density ρS is tied by light inextensible string AB with the bottom surface of the vessel as shown in the figure . The vessel is filled with a liquid of density ρt .(given ρl>ρs)

Choose the correct combination in which tension in the string is maximum.
View Solution