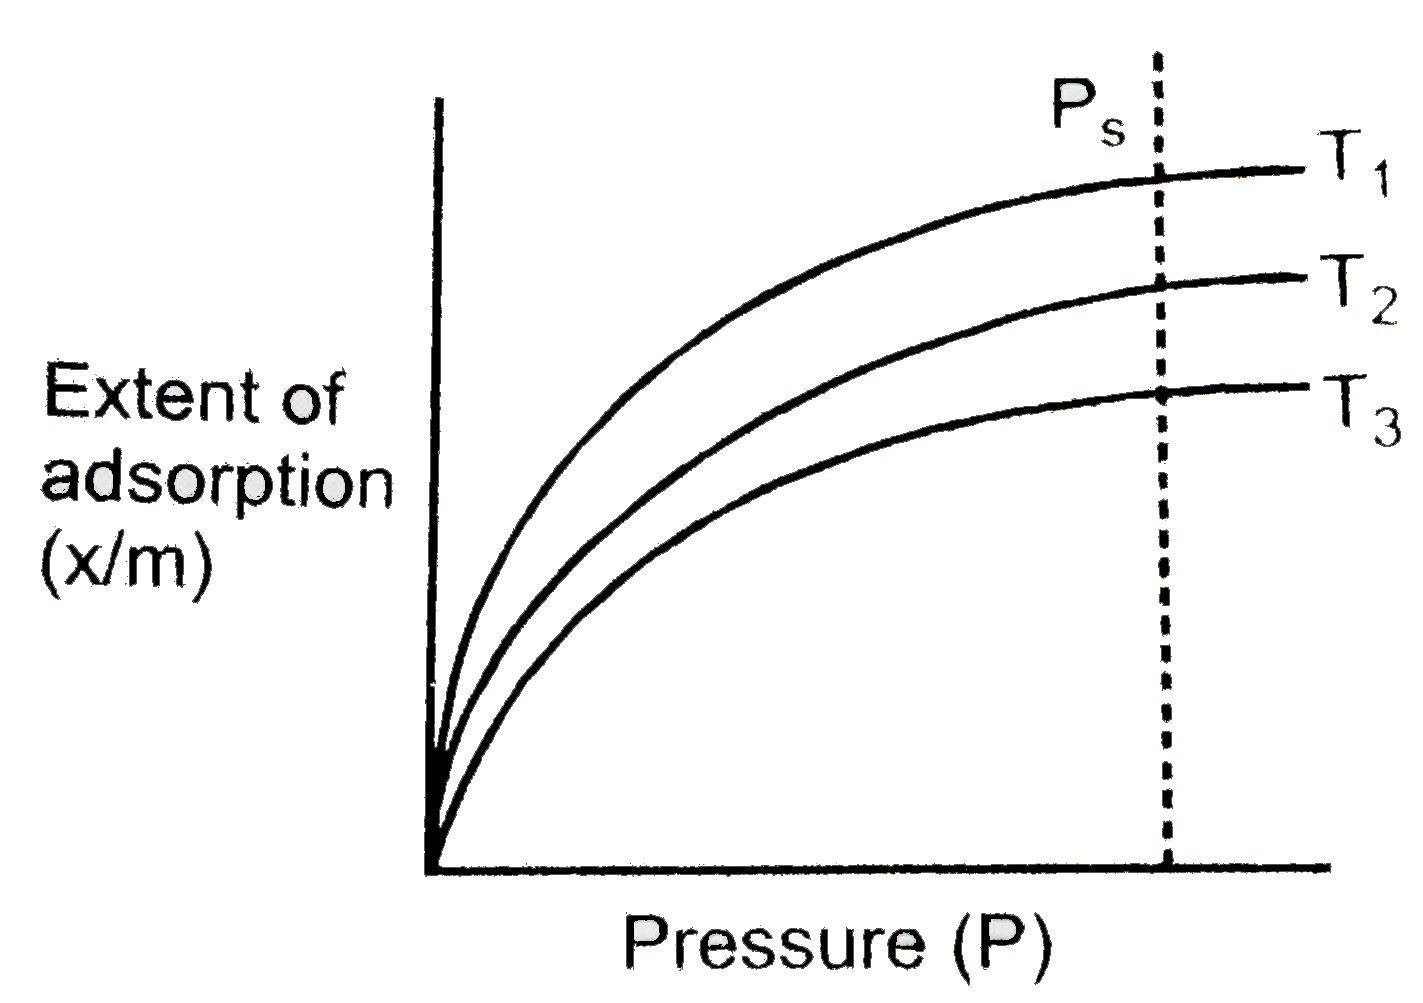
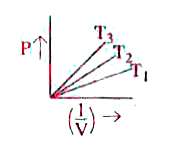
for the graph below, select correct order of temperture ?
 Solution in Telugu
T1>T2>T3
T2>T3>T1
T3>T2>T1
T1>T2>T3
The correct Answer is:c
Step by step video & image solution for for the graph below, select correct order of temperture ? by Chemistry experts to help you in doubts & scoring excellent marks in Class 12 exams.
Updated on:21/07/2023Topper's Solved these Questions
- SURFACE CHEMISTRYBOOK - NARENDRA AWASTHICHAPTER - SURFACE CHEMISTRYEXERCISE - Level 3 - Assertion - Reason Type Questions
1 Videos
- SURFACE CHEMISTRYBOOK - NARENDRA AWASTHICHAPTER - SURFACE CHEMISTRYEXERCISE - Level 3 - Assertion - Reason Type Questions
1 Videos
- CHEMICAL KINETIC & NUCLEAR CHEMISTRYBOOK - NARENDRA AWASTHICHAPTER - CHEMICAL KINETIC & NUCLEAR CHEMISTRYEXERCISE - Level 3 - Subjective Problems
3 Videos
Similar Questions
each question constain STATEMENT-1(Assertion ) and STATEMENT - 2 (reason). examine the statement carefully and work the correct answer accoridng to the instructions given below :
STATEMENT-1: Dispersed phase particles of colloidal solution cannot pass through ultra -filter paper.
STATEMENT-2: The size of colloidal particles are larger than the size of true solution particles.
View Solutioneach question constain STATEMENT-1(Assertion ) and STATEMENT - 2 (reason). examine the statement carefully and work the correct answer accoridng to the instructions given below :
STATEMENT-1: Dispersed phase particles of colloidal solution cannot pass through ultra -filter paper.
STATEMENT-2: The size of colloidal particles are larger than the size of true solution particles.
View Solution5A→Product
In above reaction, half-life period is directly proportional to initial concentration of reactant. The initial rate of reaction is 400 mol lit−1 min−1. Calculate the half - life period ( in sec ) when initial concentration of reactant is 200 mol lit−1 min−1.
View SolutionStudy the charactristics of a population represented in the graphs below. Mark the correct graph that represents the type of selection that this population is likely to undergo
View SolutionStudy the charactristics of a population represented in the graphs below. Mark the correct graph that represents the type of selection that this population is likely to undergo
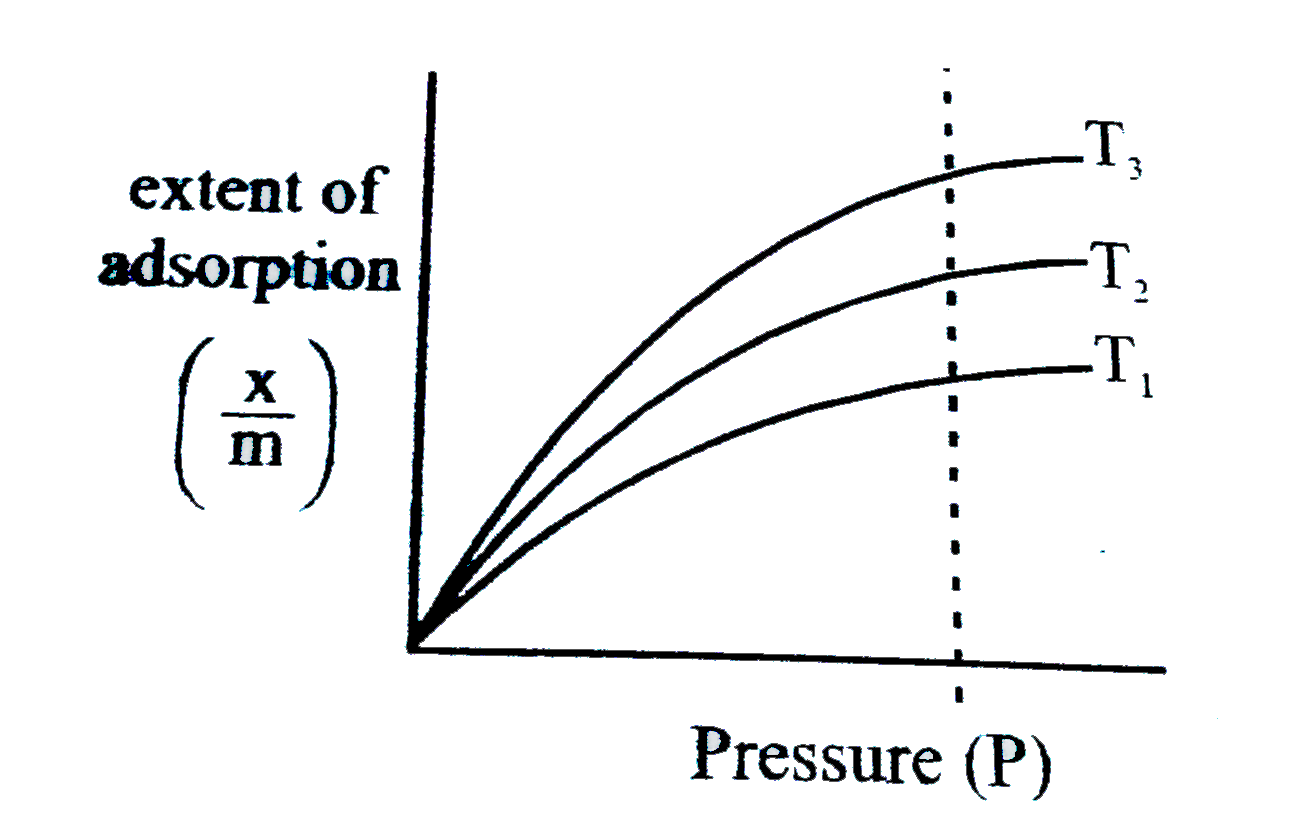
View SolutionFor the graph below select correct order of temperture :-
View SolutionSelect the correct order of CFSE (Delta) for the ions given below
View SolutionA graph showing the variation of volume with temperture at constant pressure would look like
View SolutionFor the graph below, select correct order of temperature?
View SolutionFrom the graph the correct order of temperatures is:
View SolutionFrom the graph the correct order of temperature is:
View SolutionFrom the graph the correct order of temperatures is
View SolutionFrom the graph the correct order of temperatures is
View SolutionFrom the graph the correct order of temperature is
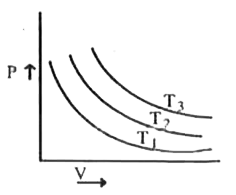
View Solutionfor the graph below, select correct order of temperture ?
View SolutionStudy the charactristics of a population represented in the graphs below.
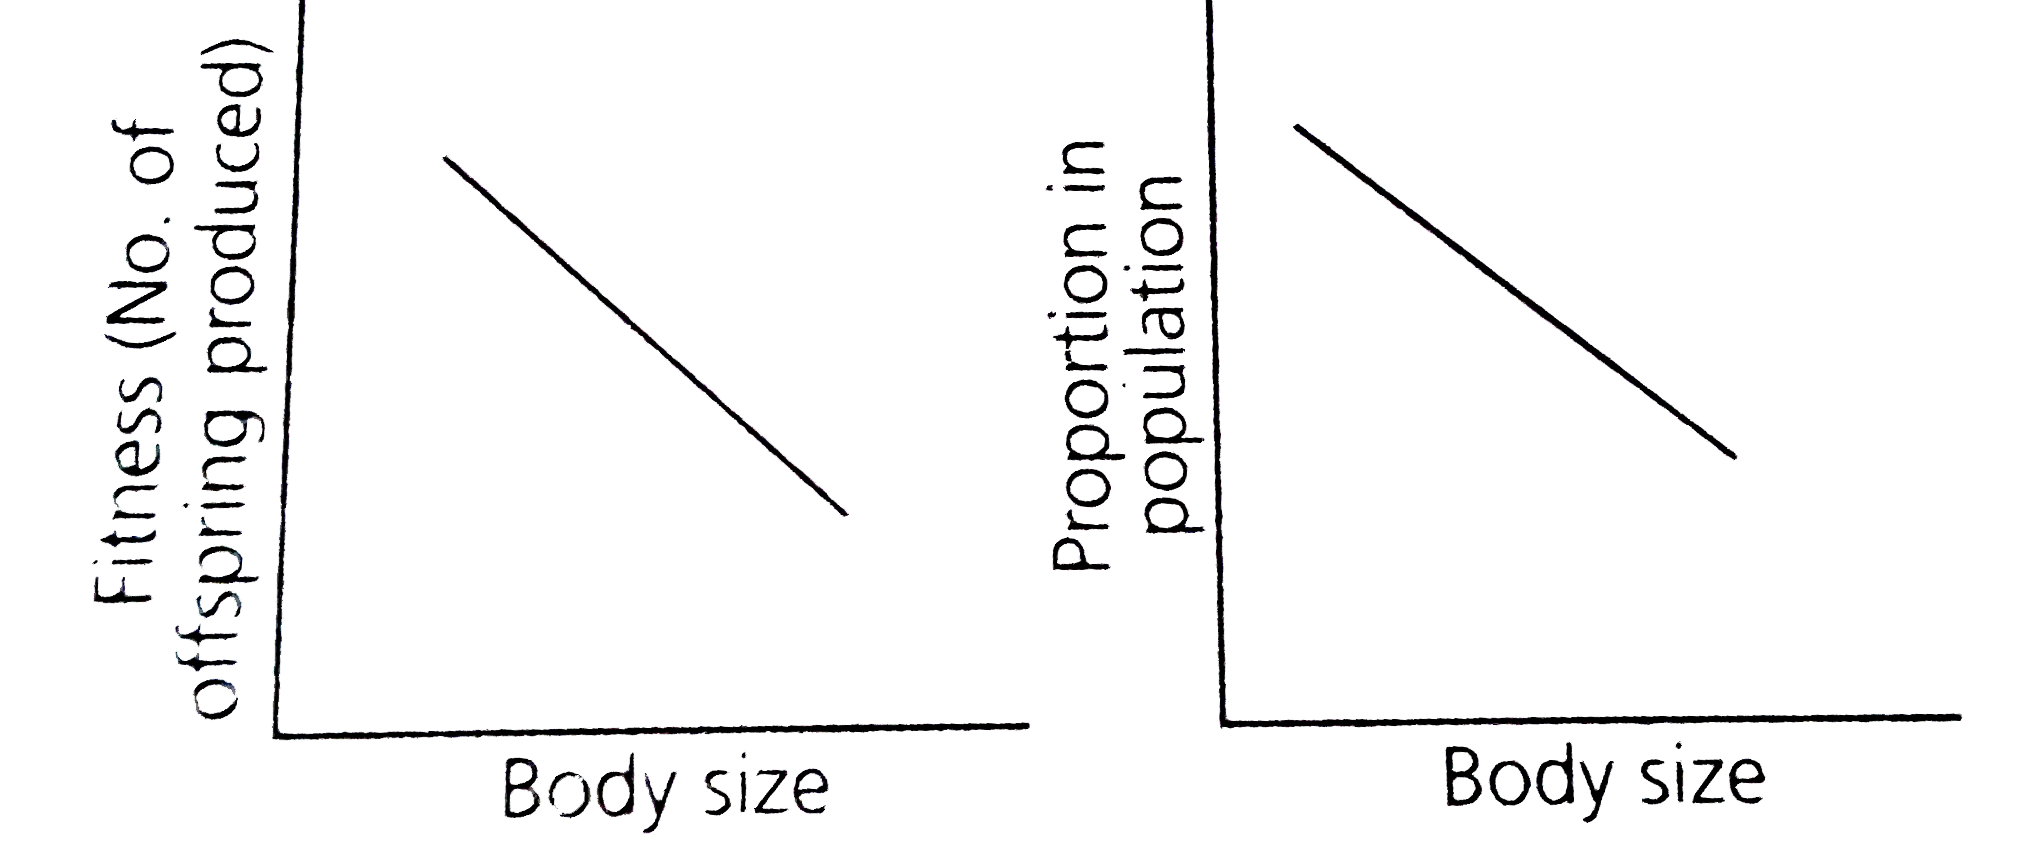
Mark the correct graph that represents the type of selection that this population is likely to undergo

View Solution
