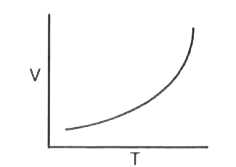
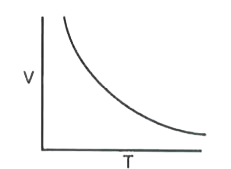
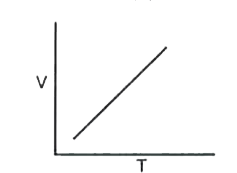
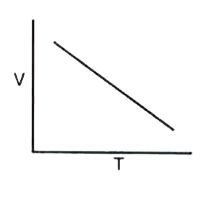
A graph showing the variation of volume with temperture at constant pressure would look like Solution in Kannada


The correct Answer is:C
Step by step video, text & image solution for A graph showing the variation of volume with temperture at constant pressure would look like by Chemistry experts to help you in doubts & scoring excellent marks in Class 12 exams.
Topper's Solved these Questions
- BOOK - MODERN PUBLICATIONCHAPTER - STATES OF MATTEREXERCISE - MULTIPLE CHOICE QUESTIONS (LEVEL-II)95videos
STATES OF MATTER
- BOOK - MODERN PUBLICATIONCHAPTER - STATES OF MATTEREXERCISE - MULTIPLE CHOICE QUESTIONS (LEVEL-III)7videos
STATES OF MATTER
- BOOK - MODERN PUBLICATIONCHAPTER - SOME BASIC CONCEPTS OF CHEMISTRY EXERCISE - RECENT EXAMINATION QUESTION15videos
SOME BASIC CONCEPTS OF CHEMISTRY
- BOOK - MODERN PUBLICATIONCHAPTER - STRUCTURE OF ATOMEXERCISE - RECENT EXAMINATION QUESTIONS11videos
STRUCTURE OF ATOM
Similar Questions
Which of the following statements is not correct ?
02:15View Solutiona' and 'b' are van der Waals' constant for gases. Chlorine is more easily liquefied than ethane because
01:01View Solution80 g of oxygen contains as many atoms as in
02:07View SolutionThe correct set of four quantum numbers for outermost electron of potassium (Z=19 ) is
03:54View SolutionThe graph betwene P and V at constant temperature should look like
View SolutionThe curve showing the variation of adorpton with pressure at constant temperature is called :
03:12View SolutionAt constant temperture, the product of pressure and volume of a given amount of a gas is constant. This is :
01:10View SolutionWhen does the graph showing variation of the volume of a given mass of gas with pressure at a constant temperature become linear?
03:01View SolutionThomas Andrew measured variation of the volume with pressure of ____________ at different constant temperatures.
07:59View SolutionThe given P-U graph shows the variation of internal energy of an ideal gas with increase in pressure. Which of the following pressure-volume graph is equivalent to this graph?
02:06View SolutionPressure vs volume graph at constant temperature is known as…………….
02:06View SolutionThe curve showing the variation of adsorption with pressure at constant temperature is called:
03:02View SolutionThomas Andrew measured variation of the volume with pressure of "____________" at different constant temperatures.
03:58View SolutionThe curve showing the variation of adsorption with pressure at constant temperature is is called :
02:23View SolutionThe curve showing the variation of adsorption with pressure at constant temperature is is called :
03:11View Solution

