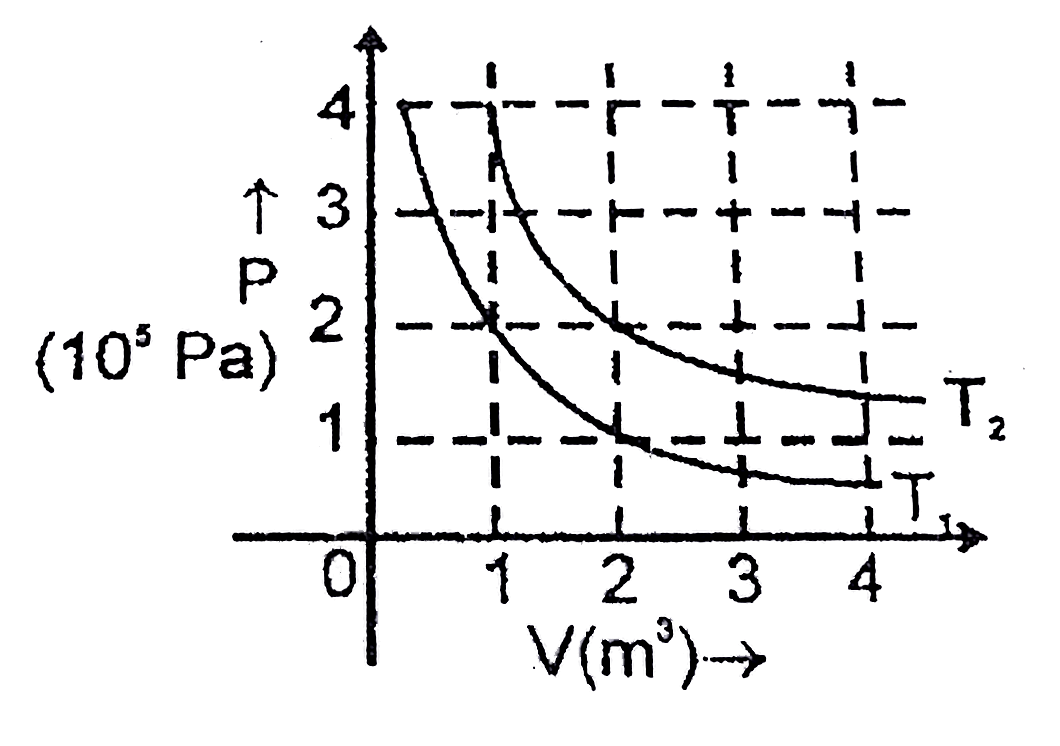
The following PV curve shows two isothermal processes for two diff erent temperatures and. Identify the higher temperature of these two.
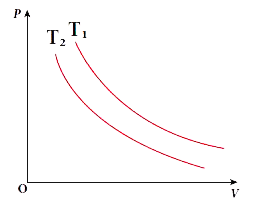
Text Solution
To determine the curve corresponding to higher temperature, draw a horizontal line parallel to x axis as shown in the fi gure. Th is is the constant pressure line. Th e volumes V1andV2 belong to same pressure as the vertical lines from V1andV2meet the constant pressure line.
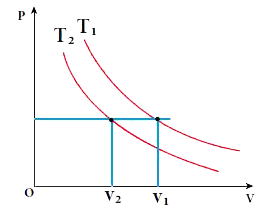
At constant pressure, higher the volume of the gas, higher will be the temperature. from the figure, as V1>V2 we conclude T1>T2. in general the isothermal curve closer to the origin, has lower temperature.
|
Topper's Solved these Questions
- HEAT AND THERMODYNAMICSBOOK - NCERT TAMILCHAPTER - HEAT AND THERMODYNAMICSEXERCISE - EVALUATION (MULTIPLE CHOICE QUESTIONS)
15 Videos
- HEAT AND THERMODYNAMICSBOOK - NCERT TAMILCHAPTER - HEAT AND THERMODYNAMICSEXERCISE - EVALUATION (Numerical Problems)
13 Videos
- GRAVITATIONBOOK - NCERT TAMILCHAPTER - GRAVITATIONEXERCISE - ADDITIONAL EXERCISES
4 Videos
- KINEMATICSBOOK - NCERT TAMILCHAPTER - KINEMATICSEXERCISE - EXERCISE (IV. Exercises )
20 Videos
Similar Questions
Knowledge Check
The fusion process is possible at high temperature, because at higher temperatures
Athe nucleus disintegratesBthe molecules disintegratesCatoms become ionisedDthe nucleus get sufficient energy to overcome the strong force of requisitionThe figure shows the plot of PVnT vs P, for oxygen gas at two different temperatures then
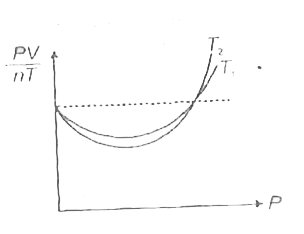 AT1>T2BT2>T1CT1=T2Dmay be (1) & (2)
Can two isothermal curves cut each other
ANeverByesCThey will cut when temperature is 0∘CDYes, when the pressure is critical pressure
Can two isothermal curves intersect each other?
View SolutionCan two isothermal curves intersect each other?
View SolutionThe figure shows two isotherms at temperatures T1 and T2. A gas is taken from one isotherm to another isotherm through different processes. Then change in internal energy ΔU has a relation -
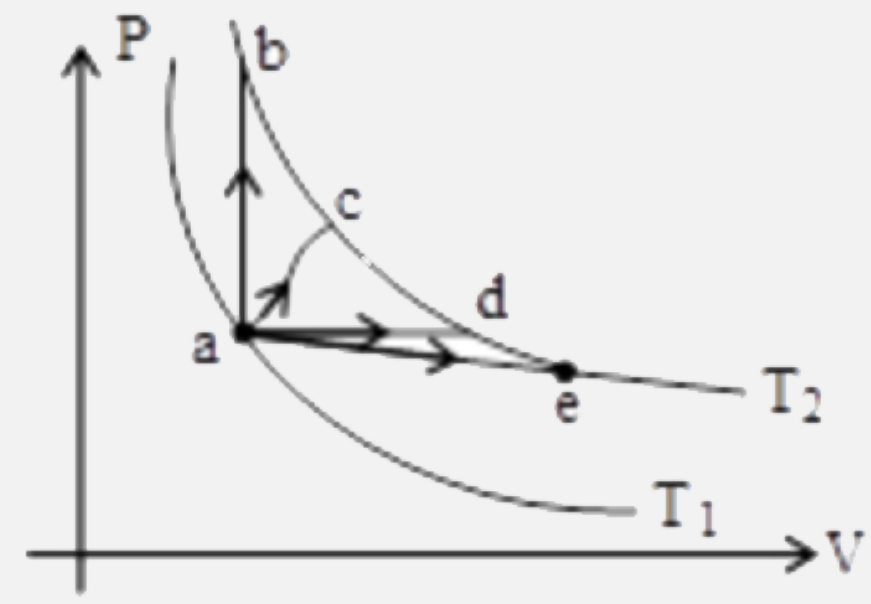
View SolutionThe figure shows two isotherms at temperatures T1 and T2. A gas is taken from one isotherm to another isotherm through different processes. Then change in internal energy ΔU has a relation -

View SolutionThe voltage-current (V-I) graph of a metallic conductor at two different temperature T1 and T2 is shown in figure. At which temperature is the resistance higher?
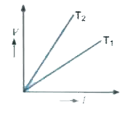
View Solution

