The graph between volume and temperature in Charles’ law is
A
an ellipse
B
a circle
C
a straight line
D
a parabola
Text Solution
The correct Answer is:C
a straight line
|
Topper's Solved these Questions
- HEAT AND THERMODYNAMICSBOOK - NCERT TAMILCHAPTER - HEAT AND THERMODYNAMICSEXERCISE - EVALUATION (Numerical Problems)
13 Videos
- HEAT AND THERMODYNAMICSBOOK - NCERT TAMILCHAPTER - HEAT AND THERMODYNAMICSEXERCISE - EVALUATION (Numerical Problems)
13 Videos
- GRAVITATIONBOOK - NCERT TAMILCHAPTER - GRAVITATIONEXERCISE - ADDITIONAL EXERCISES
4 Videos
- KINEMATICSBOOK - NCERT TAMILCHAPTER - KINEMATICSEXERCISE - EXERCISE (IV. Exercises )
20 Videos
Similar Questions
Knowledge Check
Charles's law-
AVT = constBVT = const,CV=1TDPV = const.The graph drawn between pressure and volume lin Boyles law experiment is shown in figure for different masses of same gas at same temperature then
_E01_059_Q01.png) Am2>m1Bm1<m2Cm1=m2Dm31=m2
Am2>m1Bm1<m2Cm1=m2Dm31=m2At of the following does not showexpliently the relationship between Boyle's law and Charles'law?
AP1P2=T1T2BPV=KCP2P1=V1V2DV2V1=P1P2×T2T1
State Boyle's and Charles' laws.
View SolutionDefine or explain :
Charles's Law
View SolutionWhat is the lowest temperature attainable according to Charles' law ?
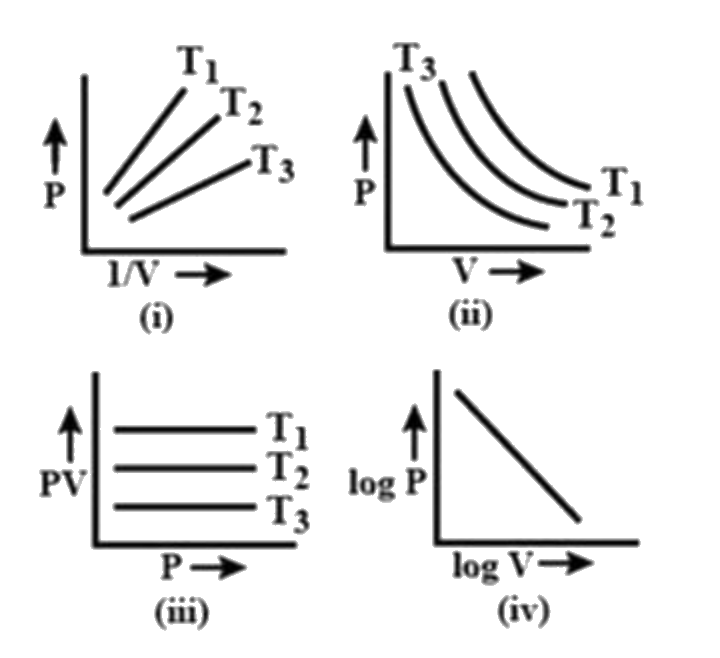
View SolutionGraph between pressure and volume are plotted at different temperature. Which of the following isotherms represent Boyle's law as PV = constant?

View SolutionVolume coefficient according to Charles' law is .
View Solution
