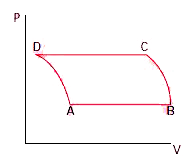
The V-T diagram of an ideal gas which goes through a reversible cycle A→B→C→D is shown below. (Processes D→A and B→C are adiabatic).
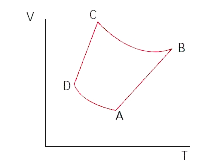
The corresponding PV diagram for the process is (all figures are schematic)
A
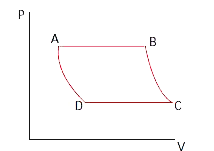
B
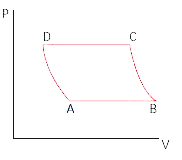
C
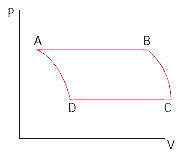
D
Text Solution
The correct Answer is:B
|
Topper's Solved these Questions
- HEAT AND THERMODYNAMICSBOOK - NCERT TAMILCHAPTER - HEAT AND THERMODYNAMICSEXERCISE - EVALUATION (Numerical Problems)
13 Videos
- HEAT AND THERMODYNAMICSBOOK - NCERT TAMILCHAPTER - HEAT AND THERMODYNAMICSEXERCISE - EVALUATION (Numerical Problems)
13 Videos
- GRAVITATIONBOOK - NCERT TAMILCHAPTER - GRAVITATIONEXERCISE - ADDITIONAL EXERCISES
4 Videos
- KINEMATICSBOOK - NCERT TAMILCHAPTER - KINEMATICSEXERCISE - EXERCISE (IV. Exercises )
20 Videos
Similar Questions
Knowledge Check
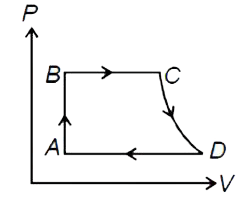
An ideal gas goes through a reversible cycle a→B→c→d has the V-T diagram shown below. Process d→a and b→c are adiabatic
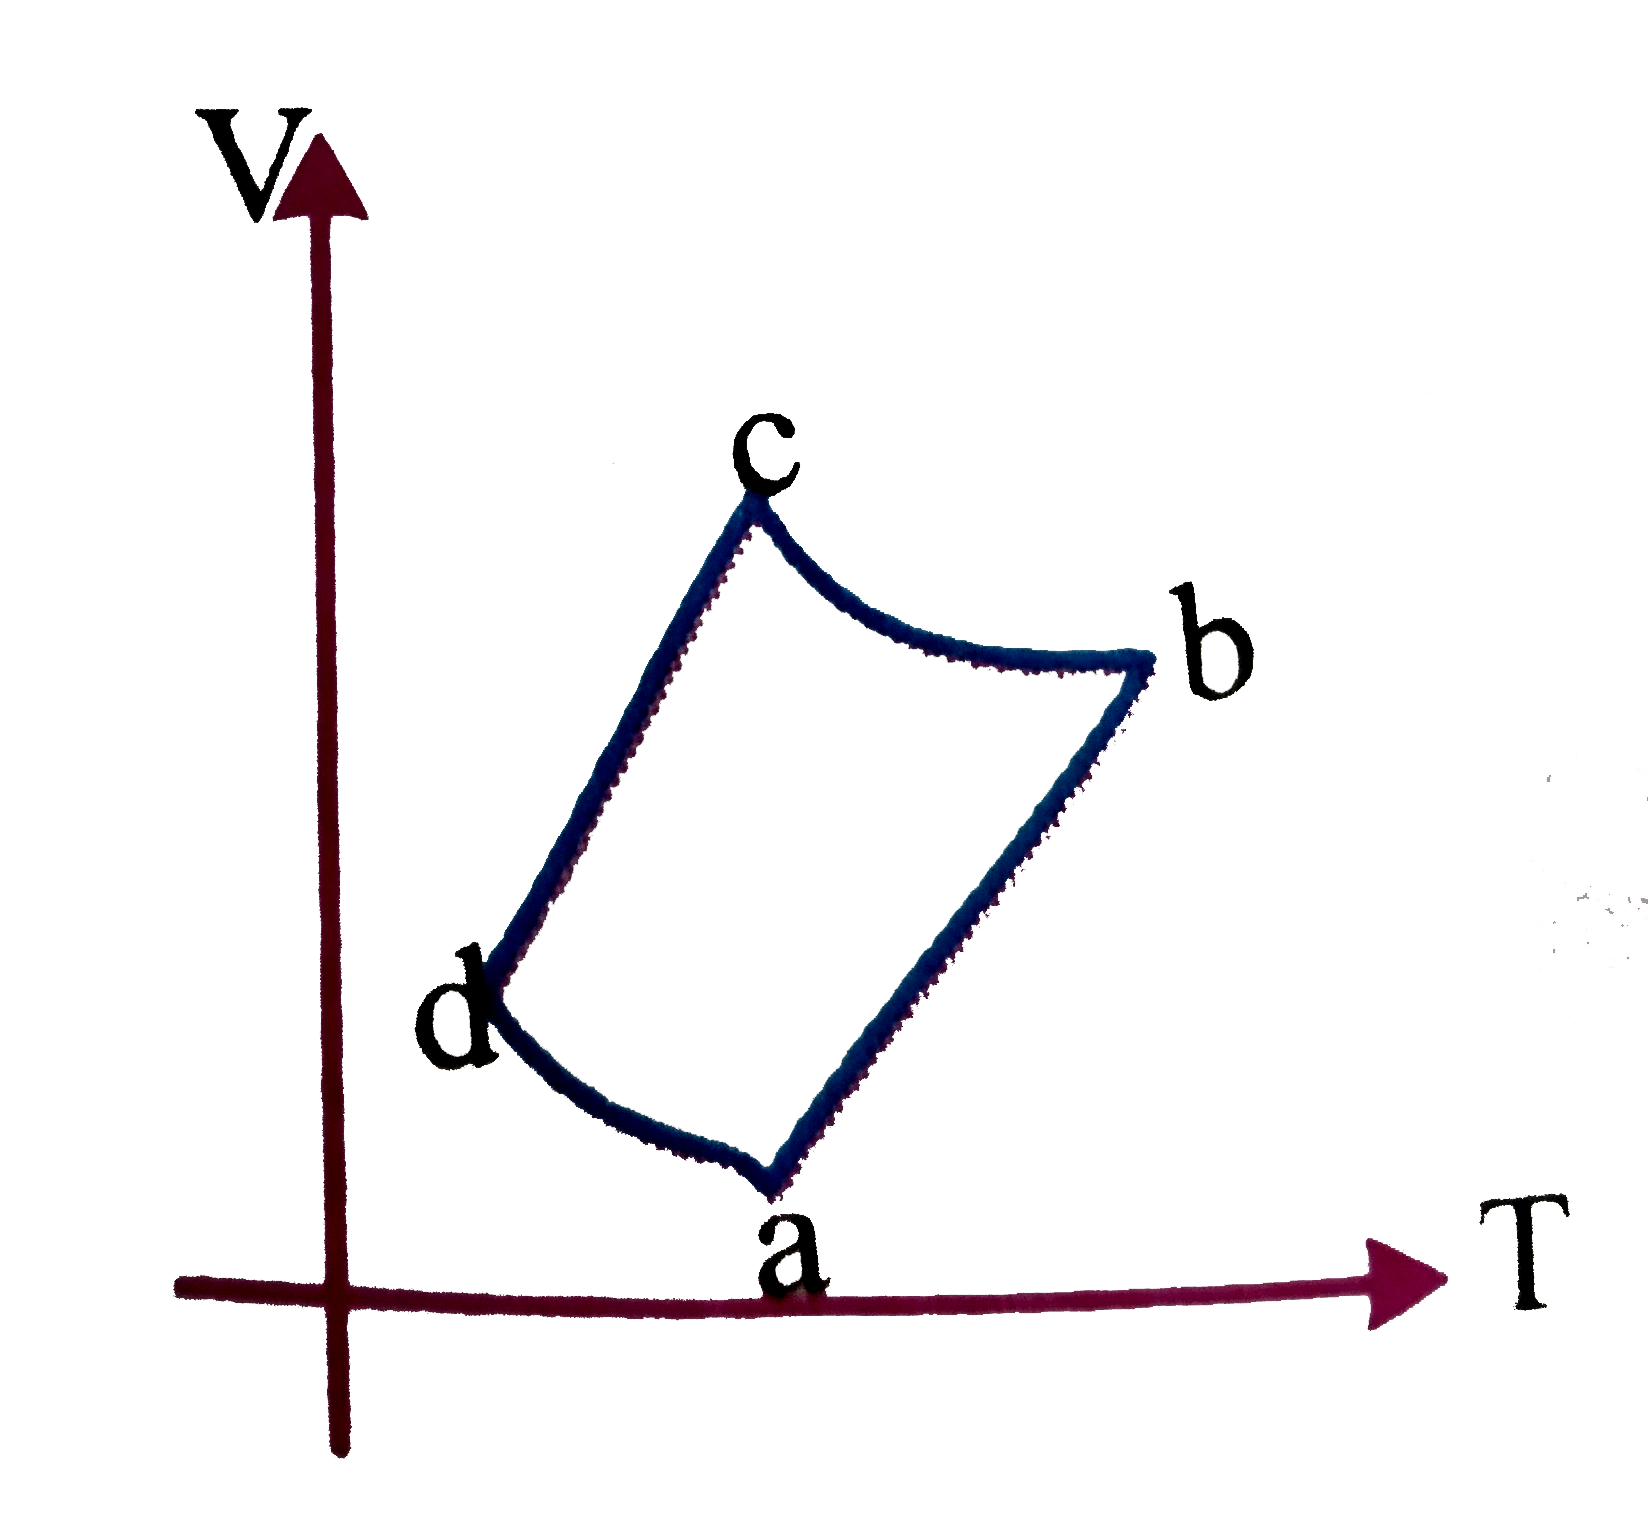
The corresponding P-V diagram for the process is(all figures are schematic and not drawn to scale)A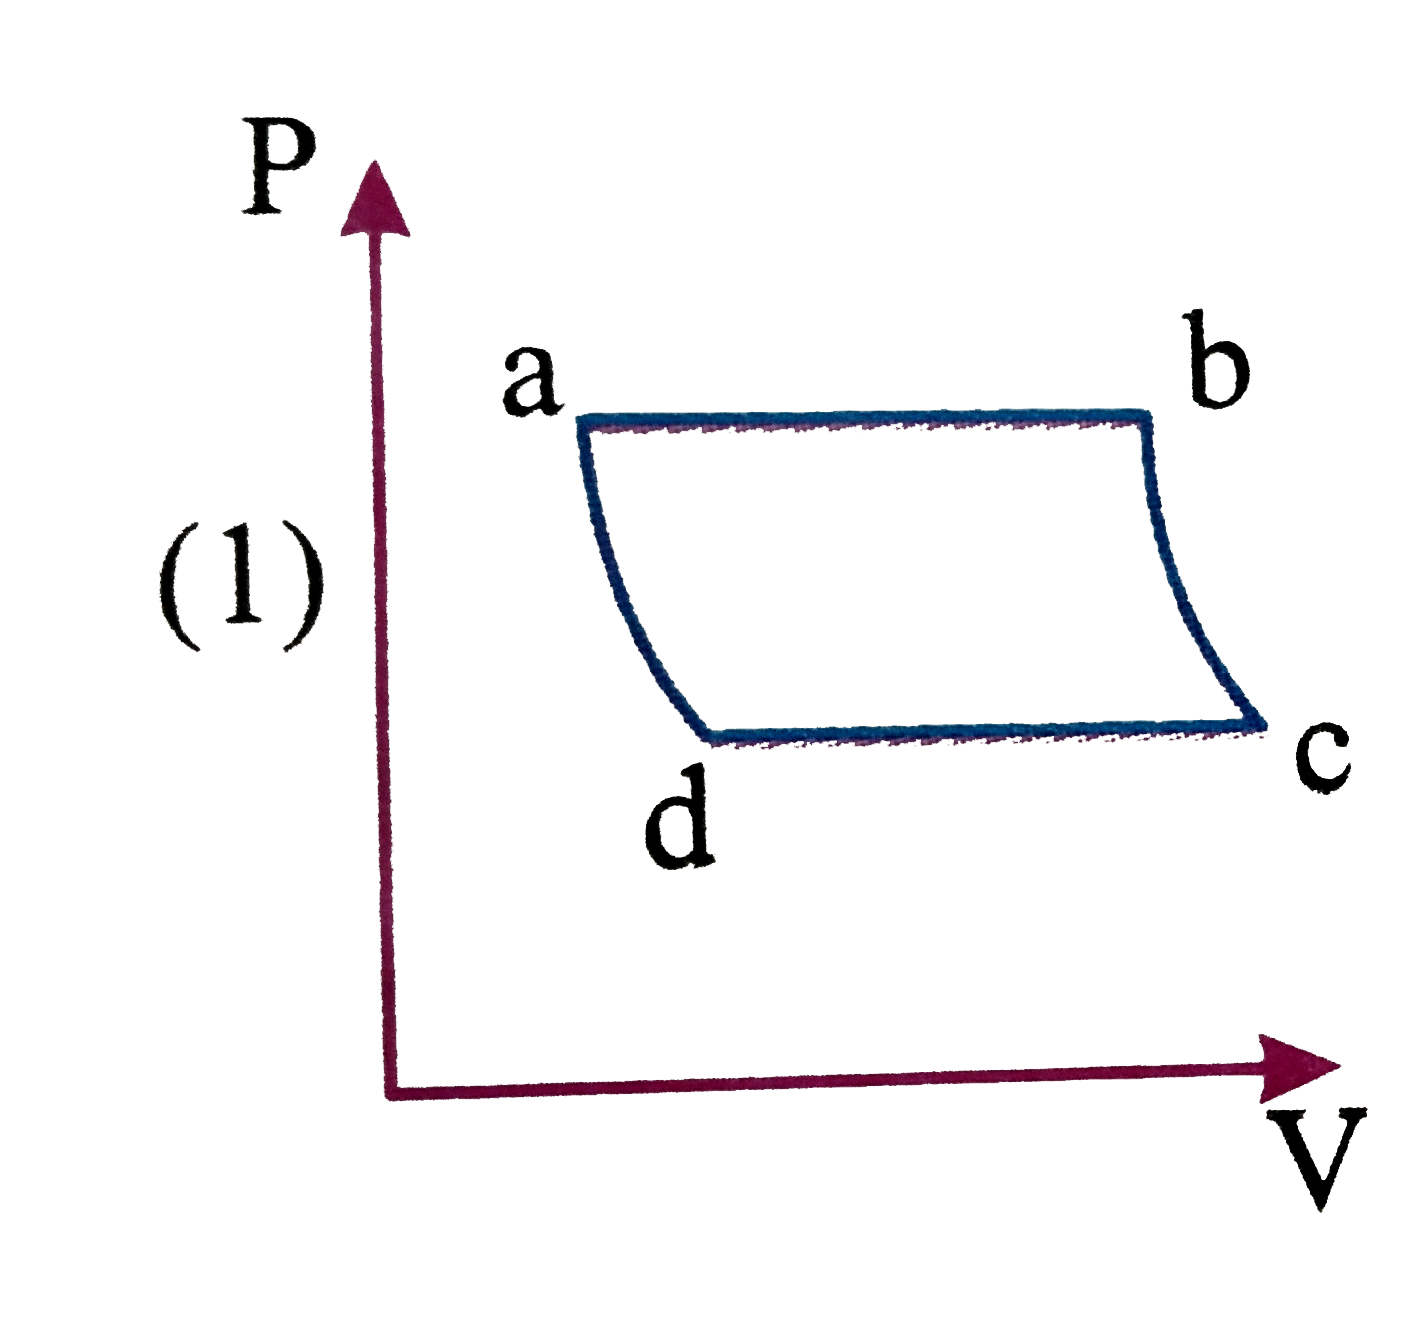 B
B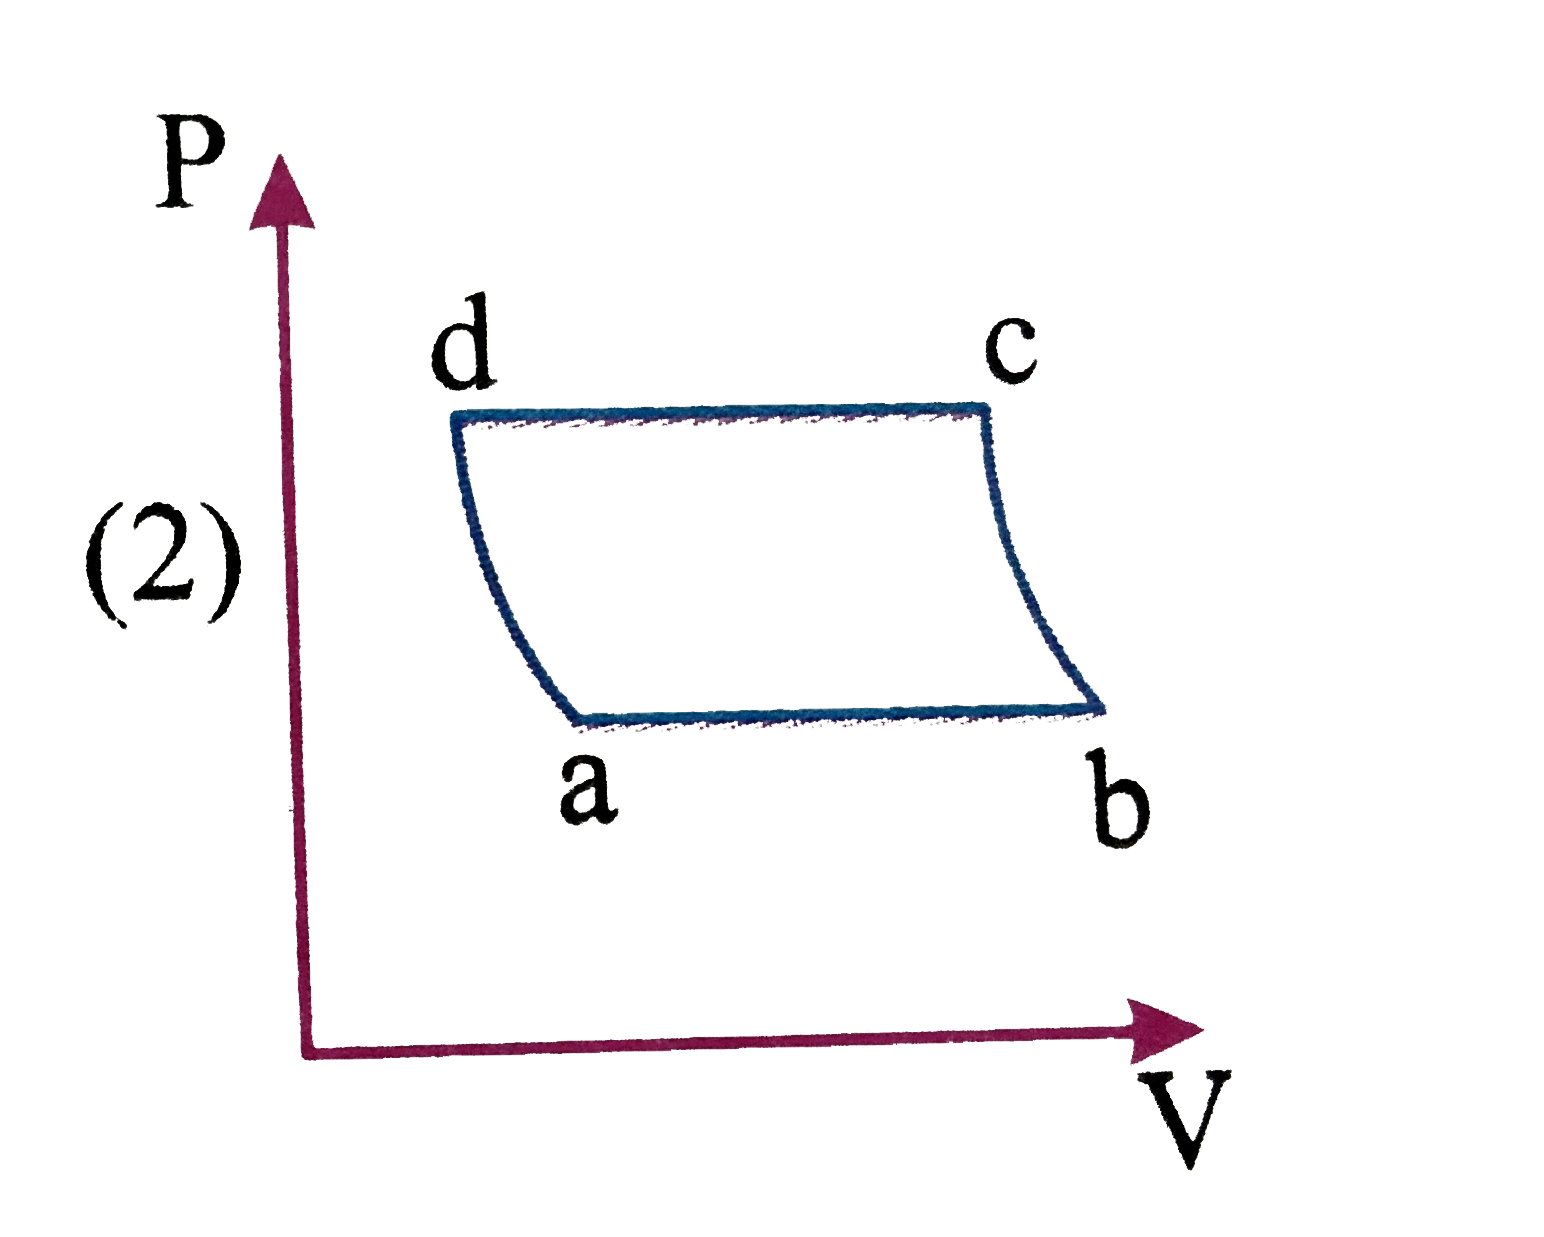 C
C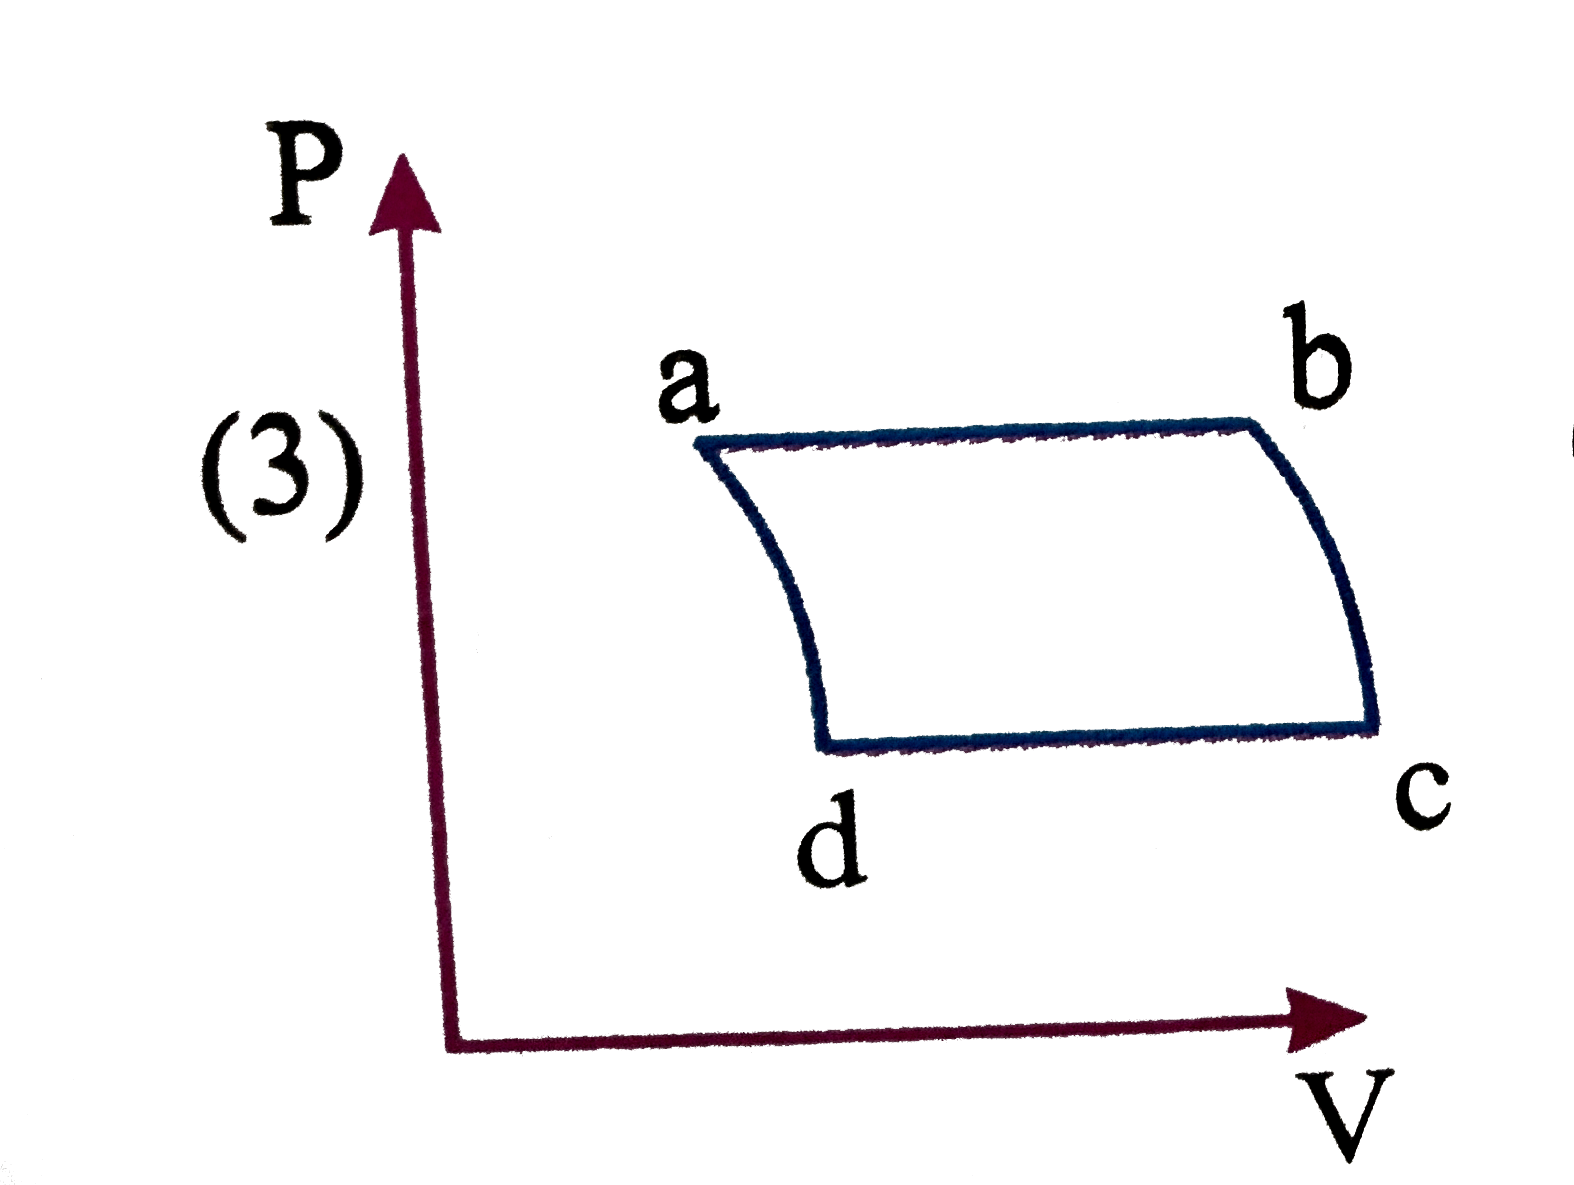 D
D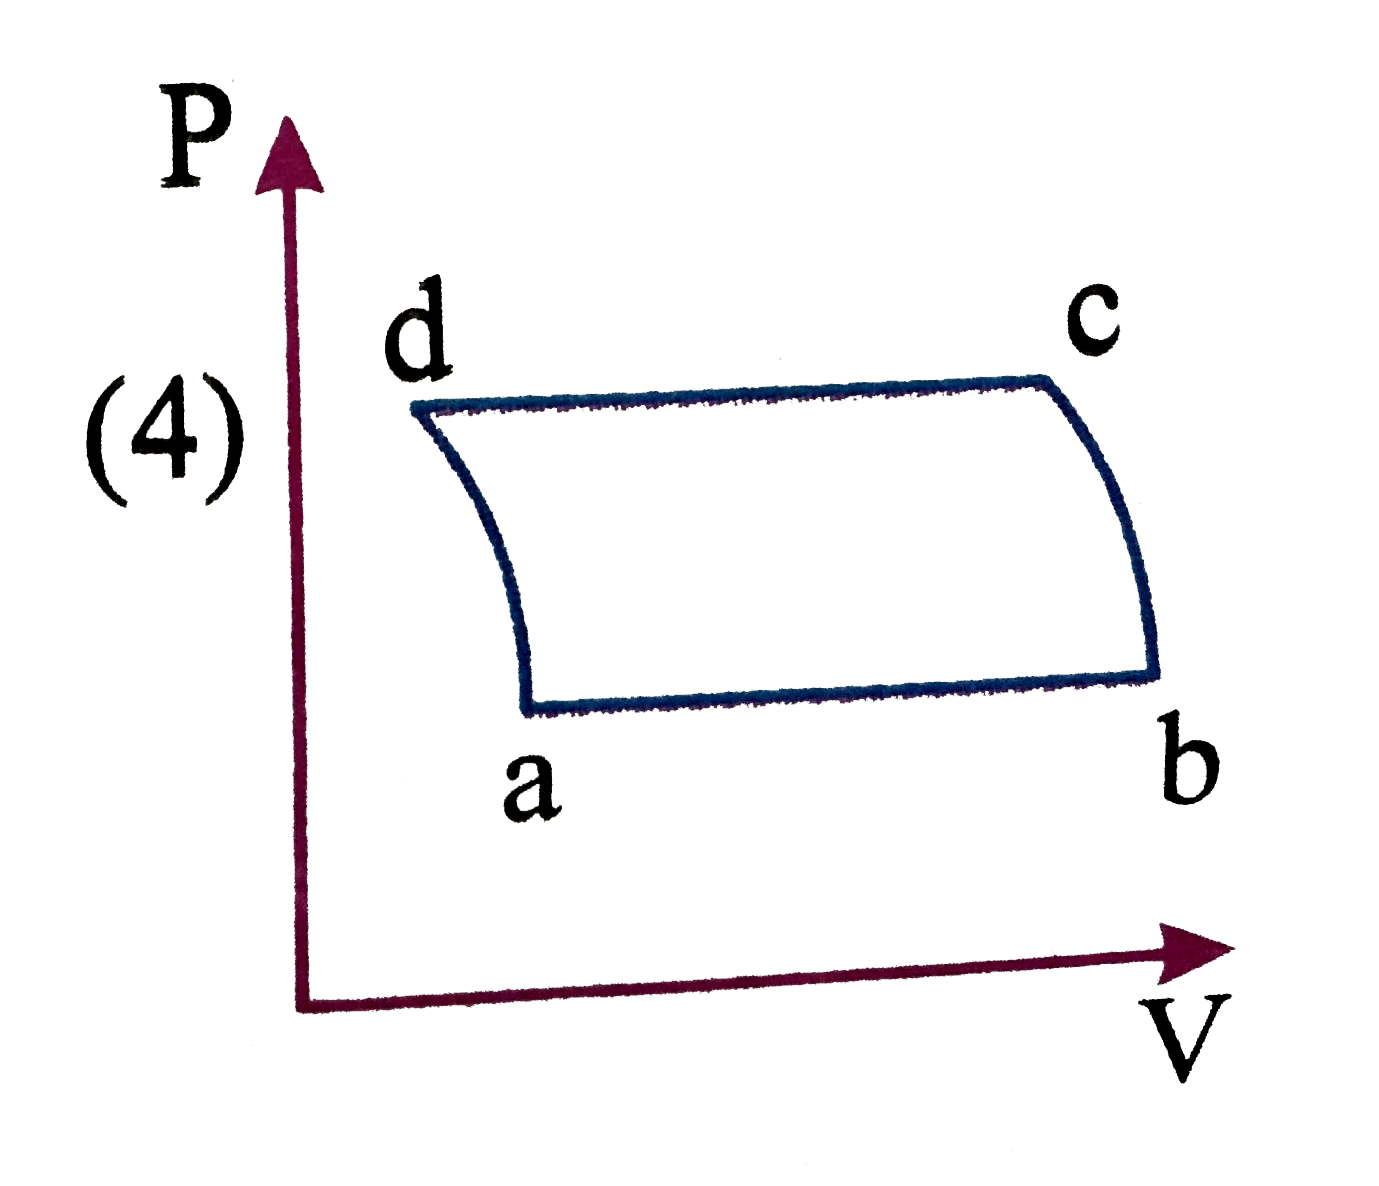
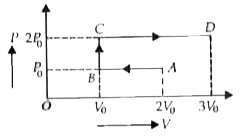
P−V diagram of an ideal gas is as shown in figure. Work done by the gas in process ABCD is
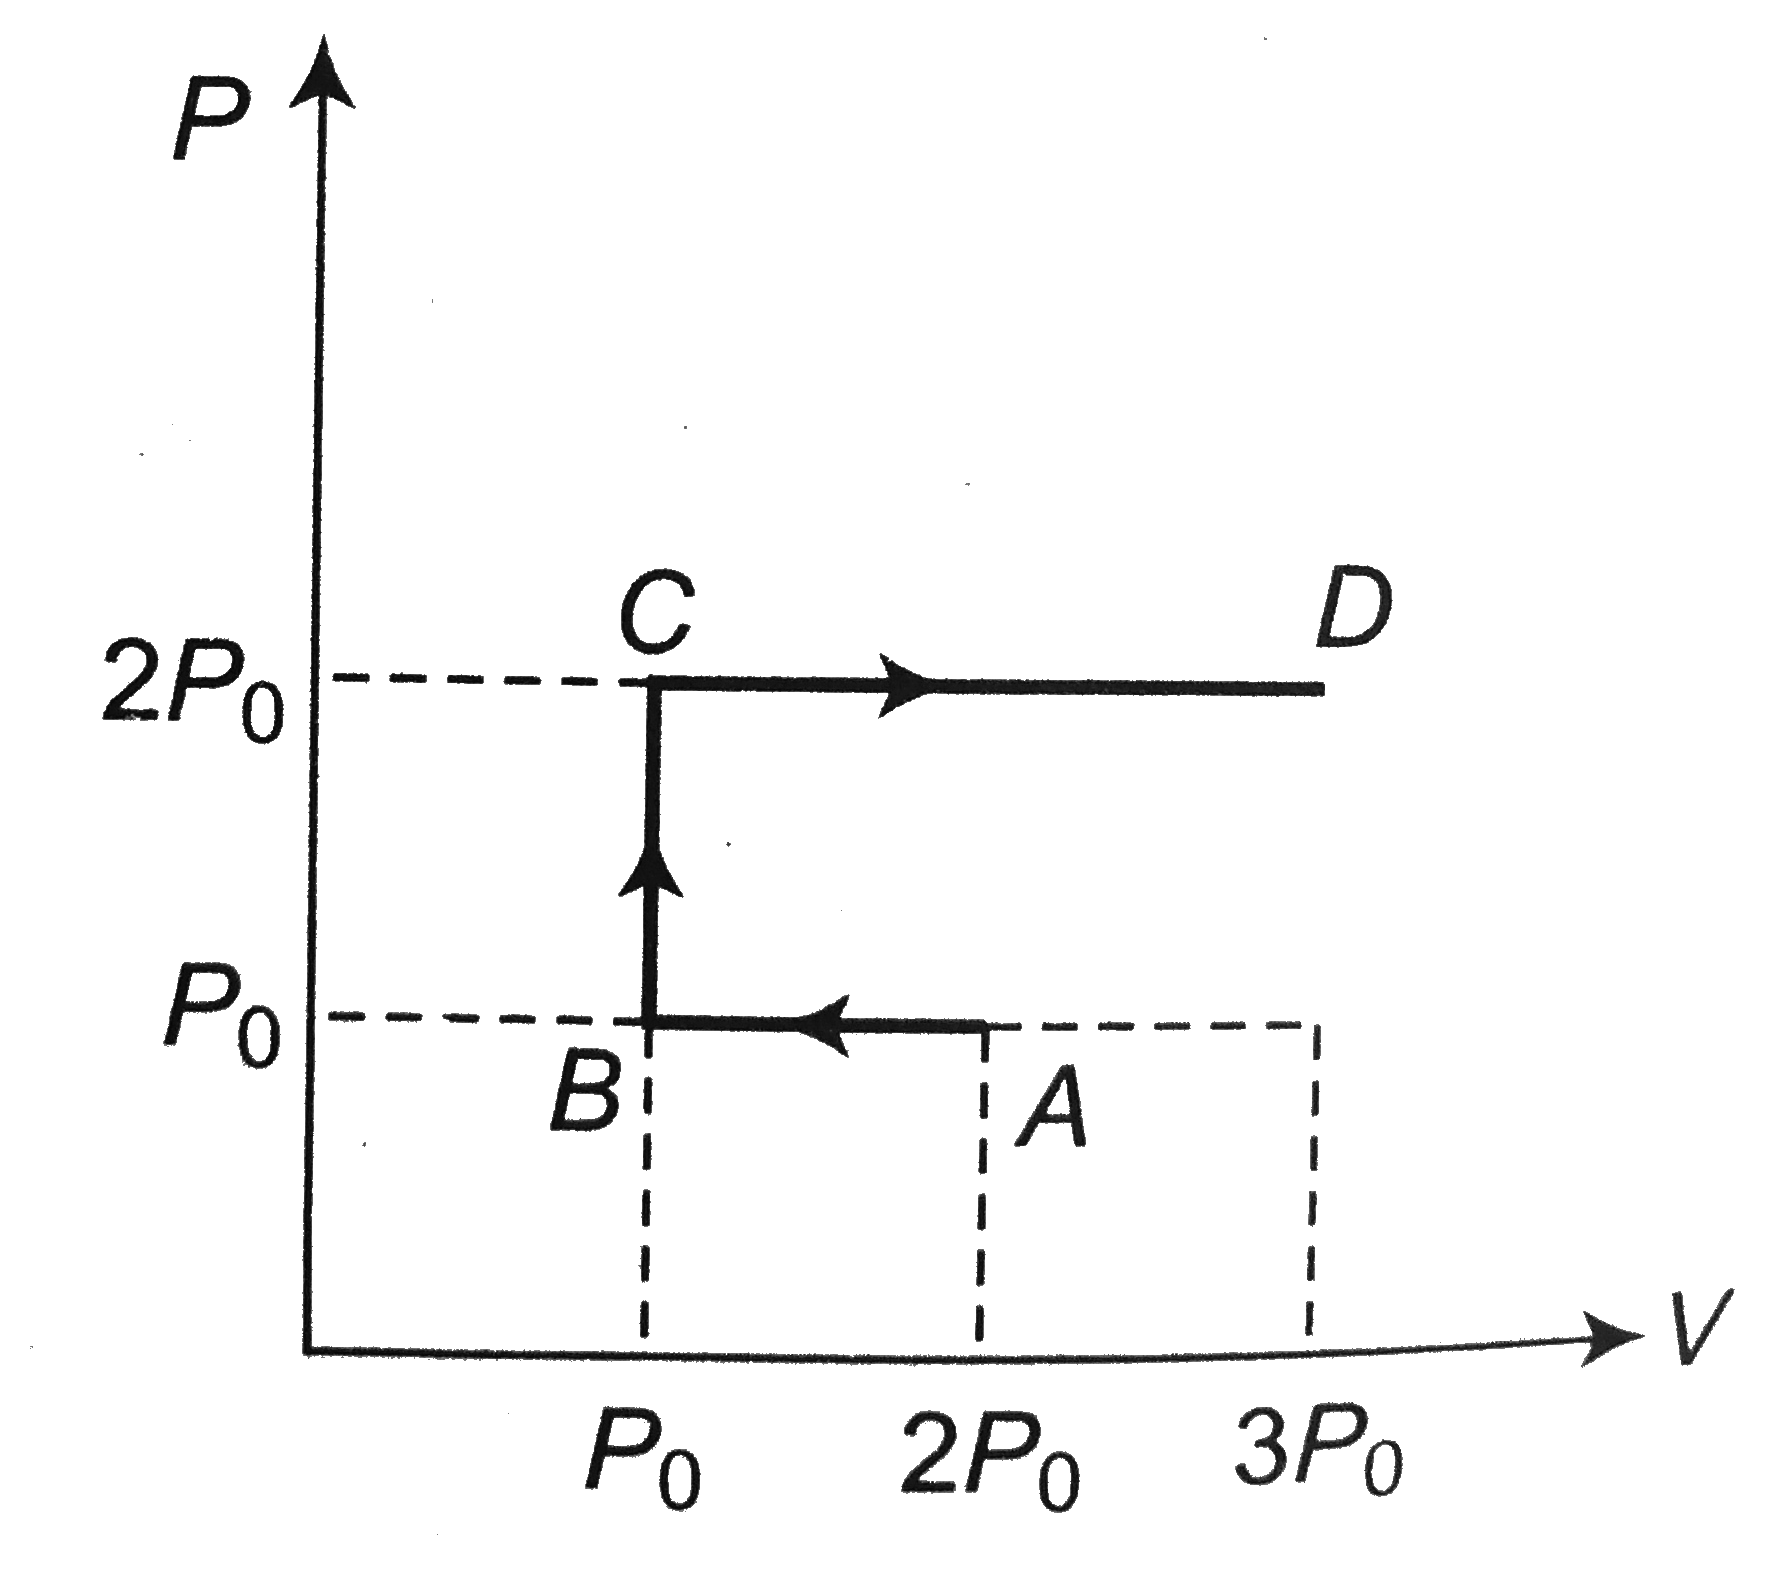 A4P0V0B2P0V0C3P0V0DP0V0
P−V diagram of an ideal gas is as shown in figure. Work done by the gas in process ABCD is
 A4p0V0B2p0V0C3p0V0Dp0V0
P-V diagram of an ideal gas is as shown in figure. Work done by the gas in the process ABCD is

View SolutionP-T diagram is shown below then choose the corresponding V-T diagram
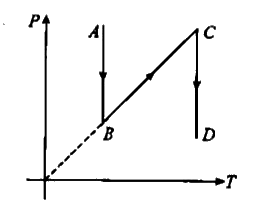
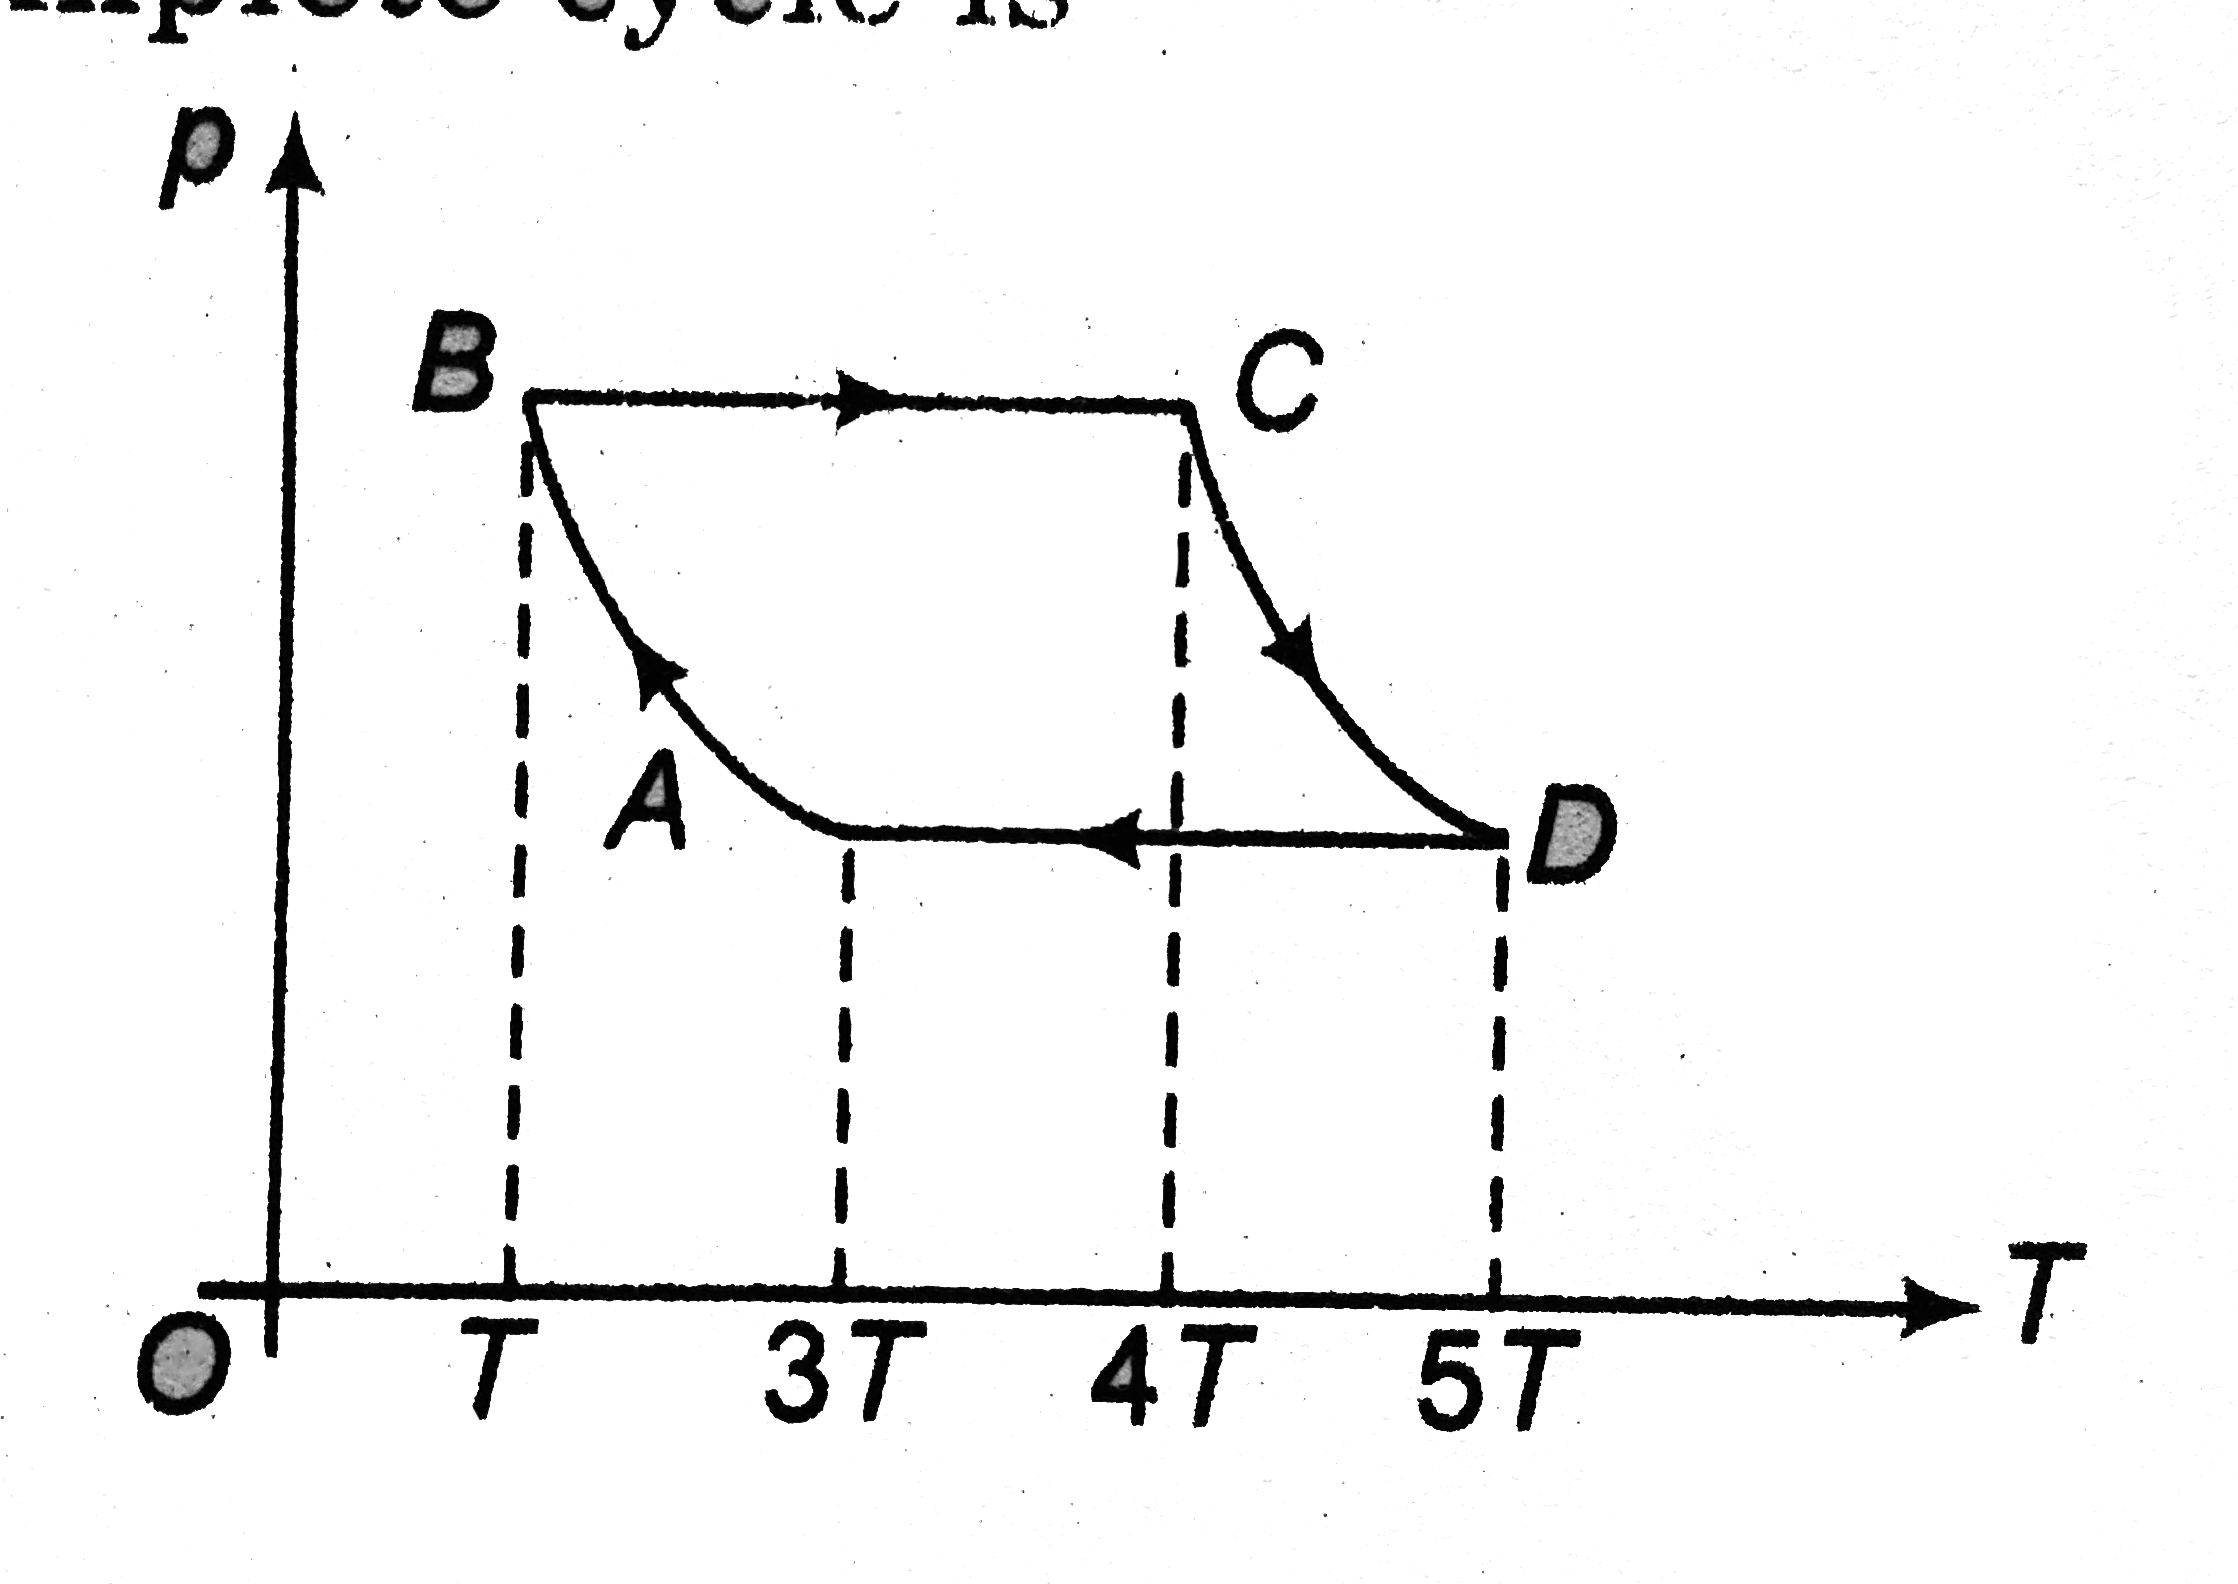
View Solutionp-T diagram of one mole of an ideal monatomic gas is shown. Processes AB and CD are adiabatic. Work done in the complete cycle is
View SolutionP-V diagram of an ideal gas is as shown in figure. Work done by the gas in the process ABCD is
View SolutionWhat is the corresponding P-T diagram, If the P-T diagram for an ideal gas is as shown in the figure ?
View Solution
